Estimated zip code population in 2022: 845 Zip code population in 2010: 727 Zip code population in 2000: 757
Houses and condos: 593 Renter-occupied apartments: 92
% of renters here:
22%
State:
31%
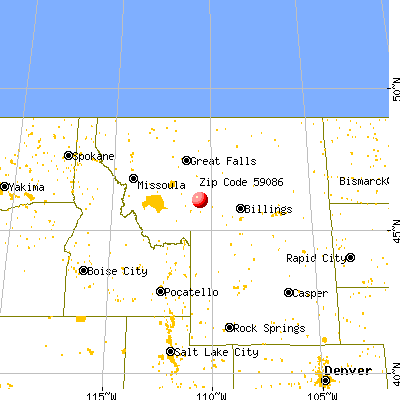
March 2022 cost of living index in zip code 59086: 90.6 (less than average, U.S. average is 100)
Land area: 479.3 sq. mi. Water area: 1.1 sq. mi.
Population density: 2 people per square mile
(very low).
OSM Map
General Map
Google Map
MSN Map
OSM Map
General Map
Google Map
MSN Map
OSM Map
General Map
Google Map
MSN Map
OSM Map
General Map
Google Map
MSN Map
Please wait while loading the map...
Real estate property taxes paid for housing units in 2022:
This zip code:
0.4% ($1,543)
Montana:
0.7% ($2,498)
Median real estate property taxes paid for housing units with mortgages in 2022: $1,729 (0.3%) Median real estate property taxes paid for housing units with no mortgage in 2022: $1,507 (0.5%)
Business Search- 14 Million verified businesses
Males: 421
(49.8%)
Females: 424
(50.2%)
For population 25 years and over in 59086:
High school or higher: 97.9%
Bachelor's degree or higher: 41.8%
Graduate or professional degree: 10.9%
Unemployed: 0.4%
Mean travel time to work (commute): 29.9 minutes
For population 15 years and over in 59086:
Never married: 13.4%
Now married: 69.9%
Separated: 0.0%
Widowed: 3.9%
Divorced: 12.8%
Zip code 59086 compared to state average:
Unemployed percentage significantly below state average.
Black race population percentage significantly below state average.
Hispanic race population percentage below state average.
Median age significantly above state average.
Foreign-born population percentage significantly below state average.
Length of stay since moving in above state average.
Estimated median house/condo value in 2022: $353,336
59086:
$353,336
Montana:
$366,400
According to our research of Montana and other state lists, there was 1 registered sex offender living in 59086 zip code as of June 17, 2024. The ratio of all residents to sex offenders in zip code 59086 is 908 to 1. The ratio of registered sex offenders to all residents in this zip code is much lower than the state average.
Median resident age:
This zip code:
60.4 years
Montana median age:
40.2 years
Average household size:
This zip code:
2.0 people
Montana:
2.4 people
Averages for the 2020 tax year for zip code 59086, filed in 2021:
Average Adjusted Gross Income (AGI) in 2020: $61,850 (Individual Income Tax Returns)
Here:
$61,850
State:
$70,533
Salary/wage: $48,450 (reported on 66.7% of returns)
Here:
$48,450
State:
$52,258
(% of AGI for various income ranges: 1848.0% for AGIs below $25k, 3936.0% for AGIs $25k-50k, 8155.0% for AGIs $50k-75k, 9125.0% for AGIs $75k-100k, 17600.0% for AGIs $100k-200k)
Taxable interest for individuals: $812 (reported on 44.4% of returns)
This zip code:
$812
Montana:
$1,928
(% of AGI for various income ranges: 56.0% for AGIs below $25k, 38.0% for AGIs $25k-50k, 140.0% for AGIs $50k-75k, 183.3% for AGIs $100k-200k)
Ordinary dividends: $9,640 (reported on 27.8% of returns)
Here:
$9,640
State:
$7,554
(% of AGI for various income ranges: 414.0% for AGIs $25k-50k, 1880.0% for AGIs $50k-75k, 1270.0% for AGIs $100k-200k)
Net capital gain/loss in AGI: +$23,317 (reported on 33.3% of returns)
Here:
+$23,317
State:
+$26,730
(% of AGI for various income ranges: 66.0% for AGIs below $25k, 344.0% for AGIs $25k-50k, 2190.0% for AGIs $50k-75k, 7183.3% for AGIs $100k-200k)
Profit/loss from business: +$9,489 (reported on 25.0% of returns)
Here:
+$9,489
State:
+$13,757
(% of AGI for various income ranges: 194.0% for AGIs below $25k, 956.0% for AGIs $25k-50k, 1395.0% for AGIs $75k-100k)
Taxable individual retirement arrangement distribution: $8,067 (reported on 8.3% of returns)
59086:
$8,067
Montana:
$19,575
(% of AGI for various income ranges: 484.0% for AGIs below $25k)
Earned income credit: $1,700 (reported on 11.1% of returns)
Here:
$1,700
State:
$2,035
(% of AGI for various income ranges: 136.0% for AGIs below $25k)
Percentage of individuals using paid preparers for their 2020 taxes: 88.9%
Here:
89%
State:
94%
(% for various income ranges: 83.3% for AGIs below $25k, 88.9% for AGIs $25k-50k, 80.0% for AGIs $50k-75k, 100.0% for AGIs $75k-100k, 100.0% for AGIs $100k-200k)
Averages for the 2012 tax year for zip code 59086, filed in 2013:
Average Adjusted Gross Income (AGI) in 2012: $45,686 (Individual Income Tax Returns)
Here:
$45,686
State:
$53,401
Salary/wage: $33,138 (reported on 68.6% of returns)
Here:
$33,138
State:
$40,976
(% of AGI for various income ranges: 61.8% for AGIs below $25k, 61.1% for AGIs $25k-50k, 67.5% for AGIs $50k-75k, 59.4% for AGIs $75k-100k, 28.9% for AGIs $100k-200k)
Taxable interest for individuals: $800 (reported on 45.7% of returns)
This zip code:
$800
Montana:
$1,689
(% of AGI for various income ranges: 2.2% for AGIs below $25k, 0.6% for AGIs $25k-50k, 0.8% for AGIs $50k-75k, 0.8% for AGIs $100k-200k)
Ordinary dividends: $3,667 (reported on 25.7% of returns)
Here:
$3,667
State:
$5,585
(% of AGI for various income ranges: 2.8% for AGIs below $25k, 1.6% for AGIs $25k-50k, 10.5% for AGIs $75k-100k)
Net capital gain/loss in AGI: +$30,230 (reported on 28.6% of returns)
Here:
+$30,230
State:
+$14,401
(% of AGI for various income ranges: 4.4% for AGIs below $25k, 7.3% for AGIs $25k-50k, 17.4% for AGIs $50k-75k, 36.0% for AGIs $100k-200k)
Profit/loss from business: +$6,000 (reported on 31.4% of returns)
Here:
+$6,000
State:
+$10,980
(% of AGI for various income ranges: 12.0% for AGIs below $25k, 7.7% for AGIs $25k-50k, 7.6% for AGIs $50k-75k)
Taxable individual retirement arrangement distribution: $8,667 (reported on 8.6% of returns)
59086:
$8,667
Montana:
$13,434
Total itemized deductions: $20,589 (25% of AGI, reported on 25.7% of returns)
Here:
$20,589
State:
$21,750
Here:
24.7% of AGI
State:
20.5% of AGI
(% of AGI for various income ranges: 17.7% for AGIs below $25k, 10.9% for AGIs $25k-50k, 19.0% for AGIs $50k-75k, 10.8% for AGIs $100k-200k)
Charity contributions: $2,543 (reported on 20.0% of returns)
Here:
$2,543
State:
$3,989
(% of AGI for various income ranges: 3.6% for AGIs below $25k, 1.0% for AGIs $50k-75k, 1.4% for AGIs $100k-200k)
Taxes paid: $5,611 (reported on 25.7% of returns)
59086:
$5,611
State:
$7,640
(% of AGI for various income ranges: 2.3% for AGIs below $25k, 1.8% for AGIs $25k-50k, 4.2% for AGIs $50k-75k, 4.7% for AGIs $100k-200k)
Earned income credit: $1,586 (reported on 20.0% of returns)
Here:
$1,586
State:
$2,015
(% of AGI for various income ranges: 6.3% for AGIs below $25k)
Percentage of individuals using paid preparers for their 2012 taxes: 71.4%
Here:
71%
State:
57%
(% for various income ranges: 73.3% for AGIs below $25k, 62.5% for AGIs $25k-50k, 80.0% for AGIs $50k-75k, 66.7% for AGIs $75k-100k, 75.0% for AGIs $100k-200k)
Averages for the 2004 tax year for zip code 59086, filed in 2005:
Average Adjusted Gross Income (AGI) in 2004: $32,844 (Individual Income Tax Returns)
Here:
$32,844
State:
$37,845
Salary/wage: $22,146 (reported on 70.8% of returns)
Here:
$22,146
State:
$31,190
(% of AGI for various income ranges: 107.3% for AGIs below $10k, 67.3% for AGIs $10k-25k, 63.1% for AGIs $25k-50k, 57.6% for AGIs $50k-75k, 75.6% for AGIs $75k-100k)
Taxable interest for individuals: $2,190 (reported on 59.0% of returns)
This zip code:
$2,190
Montana:
$1,879
(% of AGI for various income ranges: 15.3% for AGIs below $10k, 4.6% for AGIs $10k-25k, 5.0% for AGIs $25k-50k, 2.2% for AGIs $50k-75k, 3.6% for AGIs over 100k)
Taxable dividends: $3,702 (reported on 27.7% of returns)
Here:
$3,702
State:
$3,070
(% of AGI for various income ranges: 3.6% for AGIs below $10k, 1.5% for AGIs $10k-25k, 1.2% for AGIs $25k-50k, 0.2% for AGIs $50k-75k, 9.0% for AGIs over 100k)
Net capital gain/loss: +$16,589 (reported on 33.0% of returns)
Here:
+$16,589
State:
+$10,237
(% of AGI for various income ranges: 29.8% for AGIs below $10k, 3.2% for AGIs $10k-25k, 6.5% for AGIs $25k-50k, 21.1% for AGIs $50k-75k, 36.1% for AGIs over 100k)
Profit/loss from business: +$9,333 (reported on 26.5% of returns)
Here:
+$9,333
State:
+$8,849
(% of AGI for various income ranges: 32.0% for AGIs below $10k, 11.2% for AGIs $10k-25k, 8.8% for AGIs $25k-50k, 13.8% for AGIs $50k-75k)
IRA payment deduction: $2,600 (reported on 2.9% of returns)
59086:
$2,600
Montana:
$2,958
Total itemized deductions: $17,119 (26% of AGI, reported on 24.8% of returns)
Here:
$17,119
State:
$17,258
Here:
26.2% of AGI
State:
23.1% of AGI
(% of AGI for various income ranges: 46.5% for AGIs below $10k, 14.7% for AGIs $10k-25k, 14.4% for AGIs $25k-50k, 14.7% for AGIs $50k-75k, 9.8% for AGIs over 100k)
Charity contributions deductions: $2,203 (3% of AGI, reported on 18.9% of returns)
Here:
$2,203
State:
$2,921
Here:
2.9% of AGI
State:
3.7% of AGI
(% of AGI for various income ranges: 1.0% for AGIs $10k-25k, 2.1% for AGIs $25k-50k, 1.2% for AGIs $50k-75k, 1.0% for AGIs over 100k)
Total tax: $3,996 (reported on 76.1% of returns)
59086:
$3,996
State:
$5,485
(% of AGI for various income ranges: 9.1% for AGIs below $10k, 5.8% for AGIs $10k-25k, 6.5% for AGIs $25k-50k, 8.8% for AGIs $50k-75k, 9.4% for AGIs $75k-100k, 14.5% for AGIs over 100k)
Earned income credit: $1,574 (reported on 13.9% of returns)
Here:
$1,574
State:
$1,604
Percentage of individuals using paid preparers for their 2004 taxes: 74.9%
Here:
75%
State:
63%
(% for various income ranges: 80.0% for AGIs below $10k, 70.8% for AGIs $10k-25k, 70.3% for AGIs $25k-50k, 97.1% for AGIs $50k-75k, 100.0% for AGIs over 100k)
Notable locations in zip code 59086: Miller Ranch (A), McClung Ranch (B), Brown Ranch (C), Carroll Ranch (D), Bennett Creek Guard Station (E), Chose Ranch (F), De Atley Ranch (G), Porcupine Guard Station (H), Fisher Ranch (I), Four Corners (J), Rock Creek Camp Ground (K), Gjerde Ranch (L), Holliday Ranch (M), Hunter Ranch (N), Julian Ranch (O), Kensfather Ranch (P), Keys Ranch (Q), Lovely Ranch (R), Cox Ranch (S), Footer Ranch (T). Display/hide their locations on the map
Churches in zip code 59086 include: Wilsall Community Church (A), Shields River Lutheran Church (B), Wilsall United Methodist Church (C). Display/hide their locations on the map
Lakes and reservoirs: Campfire Lake (A), Diamond Lake (B), Dead Horse Lakes (C), Smeller Lake (D), Cottonwood Lake (E), Lone Lake (F), Twin Lakes (G), Druckmiller Lake (H). Display/hide their locations on the map
Rivers and creeks: Honey Run Creek (A), Basin Creek (B), Bennett Creek (C), Cache Creek (D), Carrol Creek (E), Clear Creek (F), Comanche Creek (G), Scofield Creek (H), Serrett Creek (I). Display/hide their locations on the map
Size of family households: 177 2-persons, 11 3-persons, 47 4-persons, 8 5-persons
Size of nonfamily households: 132 1-person, 13 2-persons, 22 3-persons
118 married couples with children.
0 single-parent households ().
100.4% of residents of 59086 zip code speak English at home.
0.5% of residents speak other Indo-European language at home (100% very well).
Foreign born population: 7 (0.9%) (53.3% of them are naturalized citizens)
This zip code:
0.9%
Whole state:
2.3%
57%Netherlands
29%Malaysia
17%Norwegian
9%German
8%English
8%Italian
7%European
6%Irish
4%American
Year of entry for the foreign-born population
32010 or later
32000 to 2009
01990 to 1999
0Before 1990
Facilities with environmental interests located in this zip code:
ABC GRAVEL (PO BOX 1502 in RED LODGE, MT)
AIR MINOR (AIRS/AFS)
HARLOW TOOL & DIE (21 PINTO RANCH LN in WILSALL, MT)
ENFORCEMENT/COMPLIANCE ACTIVITY (Integrated Compliance Information System)
HOGENSON CONSTRUCTION (416 ELLIOT STREET, NORTH in WILSALL, MT)
ENFORCEMENT/COMPLIANCE ACTIVITY (Integrated Compliance Information System)
Housing units lacking complete plumbing facilities: 9.8% Housing units lacking complete kitchen facilities: 7.3%
52.4%Bottled, tank, or LP gas
26.2%Wood
20.2%Electricity
1.0%Utility gas
0.8%Fuel oil, kerosene, etc.
Population in 1990: 1,293.
Place of birth for U.S.-born residents:
This state: 428
Northeast: 86
Midwest: 118
South: 69
West: 132
59% of the 59086 zip code residents lived in the same house 5 years ago. Out of people who lived in different houses, 28% lived in this county. Out of people who lived in different counties, 50% lived in Montana.
98% of the 59086 zip code residents lived in the same house 1 year ago. Out of people who lived in different houses, 27% moved from this county. Out of people who lived in different houses, 127% moved from different state.
Private vs. public school enrollment:
Students in private schools in grades 1 to 8 (elementary and middle school):
Here:
0.0%
Montana:
15.3%
Students in private schools in grades 9 to 12 (high school): 27
Here:
90.4%
Montana:
12.2%
Students in private undergraduate colleges:
Here:
0.0%
Montana:
15.0%
Occupation by median earnings in the past 12 months ($)
93,209Health diagnosing and treating practitioners and other technical occupations
61,121Construction and extraction occupations
56,536Office and administrative support occupations
44,599Installation, maintenance, and repair occupations
41,284Farming, fishing, and forestry occupations
36,721Sales and related occupations
Top industries in this zip code by the number of employees in 2005:
Construction: New Single-Family Housing Construction (except Operative Builders) (5-9 employees: 3 establishments, 1-4 employees: 1 establishment)
Wholesale Trade: Grain and Field Bean Merchant Wholesalers (10-19: 1)
Accommodation and Food Services: Drinking Places (Alcoholic Beverages) (1-4: 2)
Health Care and Social Assistance: Offices of Dentists (1-4: 1)
Construction: Site Preparation Contractors (1-4: 1)
Construction: Electrical Contractors (1-4: 1)
Administrative and Support and Waste Management and Remediation Services: Employment Placement Agencies (1-4: 1)
Construction: Commercial and Institutional Building Construction (1-4: 1)
People in group quarters in 2000:
32 people in other workers' dormitories
Fatal accident statistics in 2012:
Fatal accident count: 1
Vehicles involved in fatal accidents: 5
Fatal accidents caused by drunken drivers: 4
Fatalities: 2
Persons involved in fatal accidents: 8
Pedestrians involved in fatal accidents: 0
2002 - 2018 National Fire Incident Reporting System (NFIRS) incidents
According to the data from the years 2002 - 2018 the average number of fire incidents per year is 8. The highest number of reported fires - 22 took place in 2004, and the least - 0 in 2016. The data has a growing trend.
When looking into fire subcategories, the most reports belonged to: Outside Fires (76.0%), and Structure Fires (17.1%).
Fire incident types reported to NFIRS in Zip Code 59086


 Nearest zip codes: 59018, 59642, 59053, 59715, 59085, 59082.


 According to the data from the years 2002 - 2018 the average number of fire incidents per year is 8. The highest number of reported fires - 22 took place in 2004, and the least - 0 in 2016. The data has a growing trend.
 When looking into fire subcategories, the most reports belonged to: Outside Fires (76.0%), and Structure Fires (17.1%).