Estimated zip code population in 2022: 4,239 Zip code population in 2010: 4,349 Zip code population in 2000: 4,452
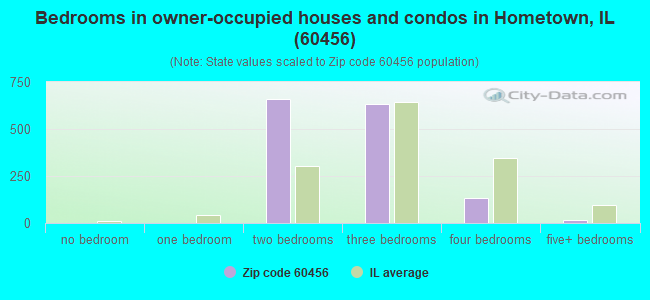
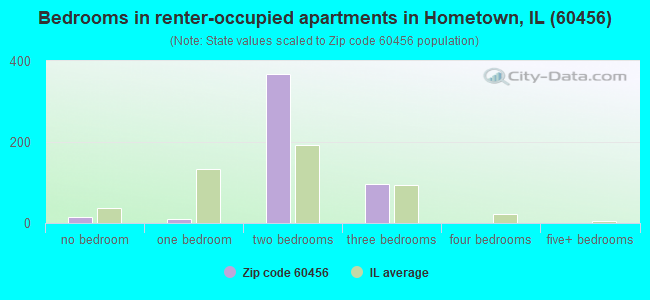
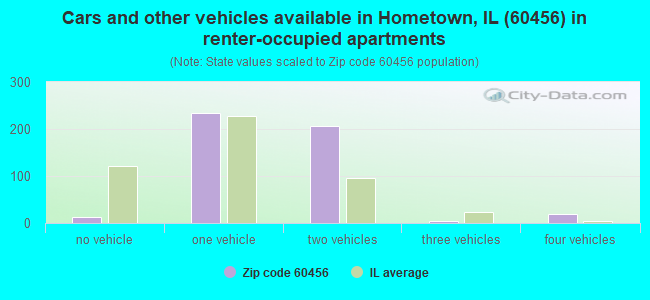
Houses and condos: 1,949 Renter-occupied apartments: 488
% of renters here:
25%
State:
33%
March 2022 cost of living index in zip code 60456: 97.5 (near average, U.S. average is 100)
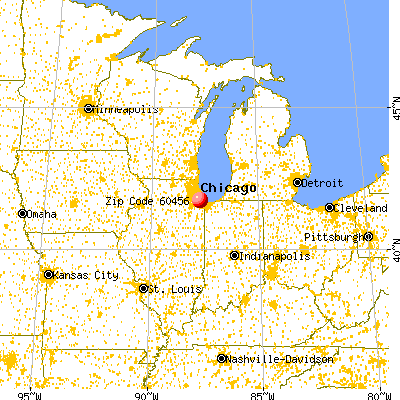
Land area: 0.5 sq. mi. Water area: 0.0 sq. mi.
Population density: 8,852 people per square mile
(high).
OSM Map
General Map
Google Map
MSN Map
OSM Map
General Map
Google Map
MSN Map
OSM Map
General Map
Google Map
MSN Map
OSM Map
General Map
Google Map
MSN Map
Please wait while loading the map...
Real estate property taxes paid for housing units in 2022:
This zip code:
2.1% ($3,329)
Illinois:
2.0% ($4,912)
Median real estate property taxes paid for housing units with mortgages in 2022: $3,418 (2.0%) Median real estate property taxes paid for housing units with no mortgage in 2022: $2,847 (2.0%)
Business Search- 14 Million verified businesses
Males: 2,098
(49.5%)
Females: 2,141
(50.5%)
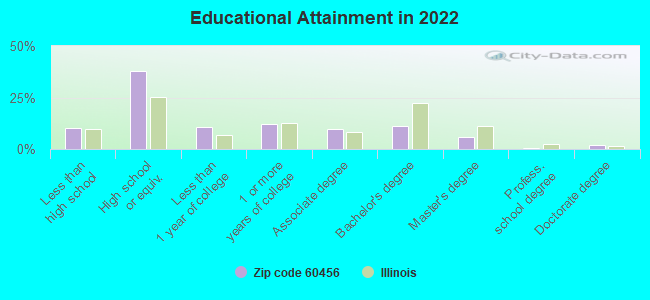
For population 25 years and over in 60456:
High school or higher: 88.5%
Bachelor's degree or higher: 18.9%
Graduate or professional degree: 8.0%
Unemployed: 5.3%
Mean travel time to work (commute): 32.8 minutes
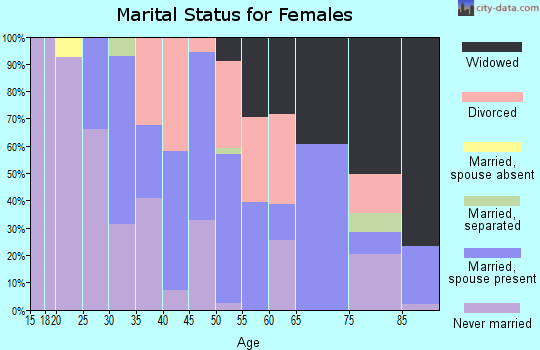
For population 15 years and over in 60456:
Never married: 38.2%
Now married: 37.7%
Separated: 0.5%
Widowed: 9.7%
Divorced: 13.8%
Zip code 60456 compared to state average:
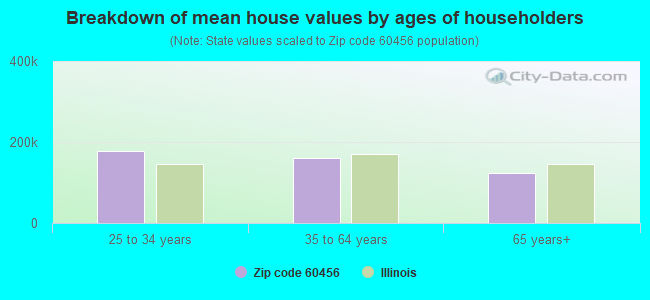
Median house value below state average.
Black race population percentage significantly below state average.
Hispanic race population percentage above state average.
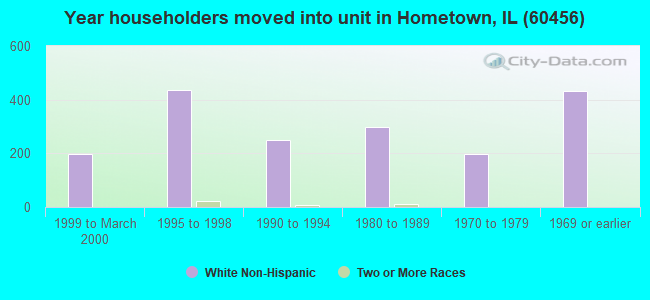
Length of stay since moving in significantly above state average.
Percentage of population with a bachelor's degree or higher below state average.
Estimated median house/condo value in 2022: $159,315
60456:
$159,315
Illinois:
$251,600
According to our research of Illinois and other state lists, there were 4 registered sex offenders living in 60456 zip code as of June 16, 2024. The ratio of all residents to sex offenders in zip code 60456 is 1,101 to 1. The ratio of registered sex offenders to all residents in this zip code is lower than the state average.
Median resident age:
This zip code:
40.1 years
Illinois median age:
39.1 years
Average household size:
This zip code:
2.2 people
Illinois:
2.4 people
Averages for the 2020 tax year for zip code 60456, filed in 2021:
Average Adjusted Gross Income (AGI) in 2020: $46,674 (Individual Income Tax Returns)
Here:
$46,674
State:
$82,626
Salary/wage: $42,932 (reported on 82.0% of returns)
Here:
$42,932
State:
$66,640
(% of AGI for various income ranges: 955.9% for AGIs below $25k, 3230.5% for AGIs $25k-50k, 5702.6% for AGIs $50k-75k, 8825.9% for AGIs $75k-100k, 16650.0% for AGIs $100k-200k)
Taxable interest for individuals: $605 (reported on 18.9% of returns)
This zip code:
$605
Illinois:
$2,376
(% of AGI for various income ranges: 18.5% for AGIs below $25k, 8.9% for AGIs $25k-50k, 8.9% for AGIs $50k-75k, 25.3% for AGIs $75k-100k, 21.7% for AGIs $100k-200k)
Ordinary dividends: $2,119 (reported on 11.6% of returns)
Here:
$2,119
State:
$9,061
(% of AGI for various income ranges: 19.7% for AGIs below $25k, 27.4% for AGIs $25k-50k, 26.8% for AGIs $50k-75k, 34.1% for AGIs $75k-100k, 107.5% for AGIs $100k-200k)
Net capital gain/loss in AGI: +$1,971 (reported on 9.0% of returns)
Here:
+$1,971
State:
+$31,684
(% of AGI for various income ranges: 1.9% for AGIs below $25k, 23.3% for AGIs $25k-50k, 14.2% for AGIs $50k-75k, 49.4% for AGIs $75k-100k, 102.5% for AGIs $100k-200k)
Profit/loss from business: +$6,926 (reported on 9.9% of returns)
Here:
+$6,926
State:
+$12,175
(% of AGI for various income ranges: 103.9% for AGIs below $25k, 97.4% for AGIs $25k-50k, 35.0% for AGIs $50k-75k, 99.4% for AGIs $75k-100k, 70.0% for AGIs $100k-200k)
Taxable individual retirement arrangement distribution: $15,658 (reported on 8.2% of returns)
60456:
$15,658
Illinois:
$21,613
(% of AGI for various income ranges: 74.4% for AGIs below $25k, 95.4% for AGIs $25k-50k, 123.9% for AGIs $50k-75k, 217.1% for AGIs $75k-100k, 928.3% for AGIs $100k-200k)
Total itemized deductions: $21,500 (reported on 4.7% of returns)
Here:
$21,500
State:
$34,948
(% of AGI for various income ranges: 106.1% for AGIs below $25k, 226.8% for AGIs $50k-75k, 515.9% for AGIs $75k-100k)
Charity contributions: $3,800 (reported on 3.0% of returns)
Here:
$3,800
State:
$13,122
(% of AGI for various income ranges: 43.7% for AGIs $50k-75k, 58.8% for AGIs $75k-100k)
Taxes paid: $6,191 (reported on 4.7% of returns)
60456:
$6,191
State:
$8,563
(% of AGI for various income ranges: 22.5% for AGIs below $25k, 65.3% for AGIs $50k-75k, 176.5% for AGIs $75k-100k)
Earned income credit: $2,009 (reported on 14.6% of returns)
Here:
$2,009
State:
$2,311
(% of AGI for various income ranges: 65.9% for AGIs below $25k, 48.2% for AGIs $25k-50k)
Percentage of individuals using paid preparers for their 2020 taxes: 91.8%
Here:
92%
State:
93%
(% for various income ranges: 90.5% for AGIs below $25k, 93.1% for AGIs $25k-50k, 91.1% for AGIs $50k-75k, 91.3% for AGIs $75k-100k, 94.7% for AGIs $100k-200k)
Averages for the 2012 tax year for zip code 60456, filed in 2013:
Average Adjusted Gross Income (AGI) in 2012: $40,520 (Individual Income Tax Returns)
Here:
$40,520
State:
$68,058
Salary/wage: $38,777 (reported on 83.1% of returns)
Here:
$38,777
State:
$55,396
(% of AGI for various income ranges: 68.0% for AGIs below $25k, 80.4% for AGIs $25k-50k, 79.6% for AGIs $50k-75k, 83.9% for AGIs $75k-100k, 81.1% for AGIs $100k-200k)
Taxable interest for individuals: $634 (reported on 29.2% of returns)
This zip code:
$634
Illinois:
$1,969
(% of AGI for various income ranges: 1.2% for AGIs below $25k, 0.6% for AGIs $25k-50k, 0.5% for AGIs $50k-75k, 0.1% for AGIs $75k-100k, 0.1% for AGIs $100k-200k)
Ordinary dividends: $1,691 (reported on 15.1% of returns)
Here:
$1,691
State:
$7,786
(% of AGI for various income ranges: 1.8% for AGIs below $25k, 0.7% for AGIs $25k-50k, 0.4% for AGIs $50k-75k, 0.6% for AGIs $75k-100k, 0.1% for AGIs $100k-200k)
Profit/loss from business: +$4,819 (reported on 7.3% of returns)
Here:
+$4,819
State:
+$12,903
(% of AGI for various income ranges: 3.6% for AGIs below $25k, 0.5% for AGIs $25k-50k, 1.3% for AGIs $50k-75k)
Taxable individual retirement arrangement distribution: $9,574 (reported on 10.5% of returns)
60456:
$9,574
Illinois:
$17,929
(% of AGI for various income ranges: 5.6% for AGIs below $25k, 2.3% for AGIs $25k-50k, 2.3% for AGIs $50k-75k, 3.6% for AGIs $75k-100k)
Total itemized deductions: $14,929 (24% of AGI, reported on 32.9% of returns)
Here:
$14,929
State:
$26,433
Here:
24.4% of AGI
State:
19.2% of AGI
(% of AGI for various income ranges: 11.4% for AGIs below $25k, 10.7% for AGIs $25k-50k, 13.9% for AGIs $50k-75k, 12.2% for AGIs $75k-100k, 11.8% for AGIs $100k-200k)
Charity contributions: $1,552 (reported on 26.5% of returns)
Here:
$1,552
State:
$4,525
(% of AGI for various income ranges: 1.1% for AGIs below $25k, 0.8% for AGIs $25k-50k, 1.0% for AGIs $50k-75k, 1.0% for AGIs $75k-100k, 1.3% for AGIs $100k-200k)
Taxes paid: $5,808 (reported on 32.4% of returns)
60456:
$5,808
State:
$11,968
(% of AGI for various income ranges: 2.7% for AGIs below $25k, 4.5% for AGIs $25k-50k, 5.0% for AGIs $50k-75k, 5.1% for AGIs $75k-100k, 5.2% for AGIs $100k-200k)
Earned income credit: $1,731 (reported on 16.4% of returns)
Here:
$1,731
State:
$2,349
(% of AGI for various income ranges: 4.4% for AGIs below $25k, 0.8% for AGIs $25k-50k)
Percentage of individuals using paid preparers for their 2012 taxes: 52.1%
Here:
52%
State:
57%
(% for various income ranges: 48.8% for AGIs below $25k, 50.8% for AGIs $25k-50k, 56.4% for AGIs $50k-75k, 61.1% for AGIs $75k-100k, 53.8% for AGIs $100k-200k)
Averages for the 2004 tax year for zip code 60456, filed in 2005:
Average Adjusted Gross Income (AGI) in 2004: $35,613 (Individual Income Tax Returns)
Here:
$35,613
State:
$54,625
Salary/wage: $34,525 (reported on 83.6% of returns)
Here:
$34,525
State:
$46,811
(% of AGI for various income ranges: 72.9% for AGIs below $10k, 68.3% for AGIs $10k-25k, 83.9% for AGIs $25k-50k, 82.9% for AGIs $50k-75k, 88.1% for AGIs $75k-100k, 73.5% for AGIs over 100k)
Taxable interest for individuals: $877 (reported on 45.3% of returns)
This zip code:
$877
Illinois:
$2,101
(% of AGI for various income ranges: 4.3% for AGIs below $10k, 2.7% for AGIs $10k-25k, 0.9% for AGIs $25k-50k, 0.5% for AGIs $50k-75k, 0.5% for AGIs $75k-100k, 1.6% for AGIs over 100k)
Taxable dividends: $1,056 (reported on 20.1% of returns)
Here:
$1,056
State:
$4,306
(% of AGI for various income ranges: 2.4% for AGIs below $10k, 1.8% for AGIs $10k-25k, 0.5% for AGIs $25k-50k, 0.3% for AGIs $50k-75k, 0.2% for AGIs $75k-100k, 0.4% for AGIs over 100k)
Net capital gain/loss: +$1,423 (reported on 13.2% of returns)
Here:
+$1,423
State:
+$17,321
(% of AGI for various income ranges: -0.8% for AGIs below $10k, 0.1% for AGIs $10k-25k, 0.0% for AGIs $25k-50k, 0.7% for AGIs $50k-75k, 0.3% for AGIs $75k-100k, 2.7% for AGIs over 100k)
Profit/loss from business: +$5,949 (reported on 7.1% of returns)
Here:
+$5,949
State:
+$11,771
(% of AGI for various income ranges: 3.4% for AGIs below $10k, 4.1% for AGIs $10k-25k, 0.6% for AGIs $25k-50k, 1.2% for AGIs $50k-75k, 0.5% for AGIs $75k-100k)
IRA payment deduction: $2,439 (reported on 1.8% of returns)
60456:
$2,439
Illinois:
$3,087
Total itemized deductions: $12,520 (24% of AGI, reported on 34.0% of returns)
Here:
$12,520
State:
$20,239
Here:
23.8% of AGI
State:
19.5% of AGI
(% of AGI for various income ranges: 6.2% for AGIs below $10k, 9.9% for AGIs $10k-25k, 12.7% for AGIs $25k-50k, 13.0% for AGIs $50k-75k, 12.2% for AGIs $75k-100k, 9.8% for AGIs over 100k)
Charity contributions deductions: $1,545 (3% of AGI, reported on 30.3% of returns)
Here:
$1,545
State:
$3,719
Here:
2.8% of AGI
State:
3.4% of AGI
(% of AGI for various income ranges: 0.8% for AGIs $10k-25k, 1.2% for AGIs $25k-50k, 1.5% for AGIs $50k-75k, 1.6% for AGIs $75k-100k, 1.6% for AGIs over 100k)
Total tax: $3,984 (reported on 77.3% of returns)
60456:
$3,984
State:
$9,882
(% of AGI for various income ranges: 1.4% for AGIs below $10k, 4.5% for AGIs $10k-25k, 7.3% for AGIs $25k-50k, 9.4% for AGIs $50k-75k, 10.5% for AGIs $75k-100k, 15.5% for AGIs over 100k)
Earned income credit: $1,635 (reported on 11.0% of returns)
Here:
$1,635
State:
$1,788
Percentage of individuals using paid preparers for their 2004 taxes: 54.5%
Here:
55%
State:
61%
(% for various income ranges: 42.9% for AGIs below $10k, 57.1% for AGIs $10k-25k, 56.3% for AGIs $25k-50k, 58.9% for AGIs $50k-75k, 53.2% for AGIs $75k-100k, 61.3% for AGIs over 100k)
Household received Food Stamps/SNAP in the past 12 months: 334 Household did not receive Food Stamps/SNAP in the past 12 months: 1,613
Women who had a birth in the past 12 months: 24 (12 now married, 11 unmarried) Women who did not have a birth in the past 12 months: 915 (377 now married, 538 unmarried)
Housing units in zip code 60456 with a mortgage: 952 (117 second mortgage, 49 both second mortgage and home equity loan) Houses without a mortgage: 22
Median monthly owner costs for units with a mortgage: $1,222 Median monthly owner costs for units without a mortgage: $554
Residents with income below the poverty level in 2022:
This zip code:
5.5%
Whole state:
11.9%
Residents with income below 50% of the poverty level in 2022:
This zip code:
3.4%
Whole state:
5.7%
Median number of rooms in houses and condos:
Here:
5.1
State:
6.4
Median number of rooms in apartments:
Here:
4.2
State:
4.1
Notable locations in this zip code not listed on our city pages
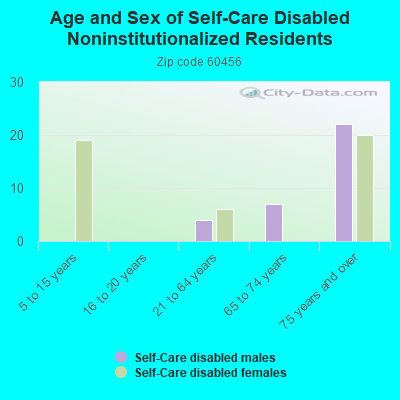
In group quarters: 3 (-1 institutionalized population)
Size of family households: 337 2-persons, 272 3-persons, 207 4-persons, 122 5-persons, 8 6-persons, 7 7-or-more-persons
Size of nonfamily households: 844 1-person, 146 2-persons
658 married couples with children.
122 single-parent households (67 men, 55 women).
76.6% of residents of 60456 zip code speak English at home.
21.7% of residents speak Spanish at home (59% very well, 27% well, 13% not well, 1% not at all).
1.1% of residents speak other Indo-European language at home (67% very well, 33% not well).
0.3% of residents speak Asian or Pacific Island language at home (100% very well).
Foreign born population: 451 (10.7%) (35.4% of them are naturalized citizens)
This zip code:
10.7%
Whole state:
14.4%
69%Honduras
10%Guyana
6%North Macedonia (Macedonia)
3%Bulgaria
2%Romania
2%Malaysia
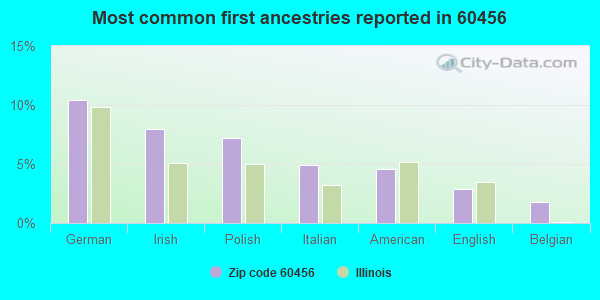
10%German
8%Irish
7%Polish
5%Italian
5%American
3%English
2%Belgian
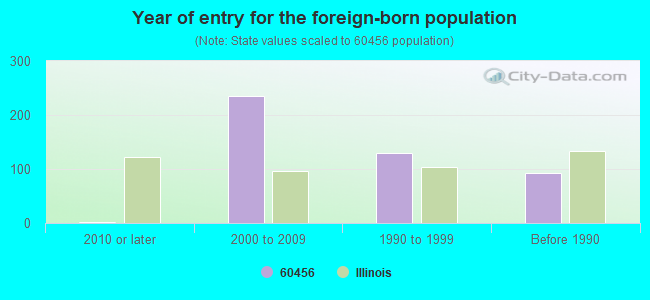
Year of entry for the foreign-born population
12010 or later
2352000 to 2009
1291990 to 1999
92Before 1990
Facilities with environmental interests located in this zip code:
MOBIL OIL CORP - 05AY3 (87TH STREET & SW HWY. in HOMETOWN, IL)
STATE MASTER (Illinois EPA Project) - AIR PROGRAM AIR MINOR (AIRS/AFS) CRITERIA AND HAZARDOUS AIR POLLUTANT INVENTORY (Inventory of air pollution sources) Business SIC classification: GASOLINE SERVICE STATIONS Alternative names: MOBIL OIL CORPORATION
MOBIL OIL (4000 SOUTHWEST HWY in HOMETOWN, IL)
STATE MASTER (Illinois EPA Project) - HAZARDOUS WASTE PROGRAM Small Quantity Generators, between 100 kg and 1000 kg of hazardous waste/month (Resource Conservation and Recovery Act (tracking hazardous waste)) - notification Organizations: MOBIL OIL CORPORATION (CONTACT/OWNER)
Alternative names: MOBIL OIL CORP SS AY3
AMOCO 18504 (4721 W 87TH AND KILPATRICK in HOMETOWN, IL)
Small Quantity Generators, between 100 kg and 1000 kg of hazardous waste/month (Resource Conservation and Recovery Act (tracking hazardous waste)) - notification Organizations: AMOCO OIL CO (CONTACT/OWNER)
Housing units lacking complete plumbing facilities: 1.4% Housing units lacking complete kitchen facilities: 2.4%
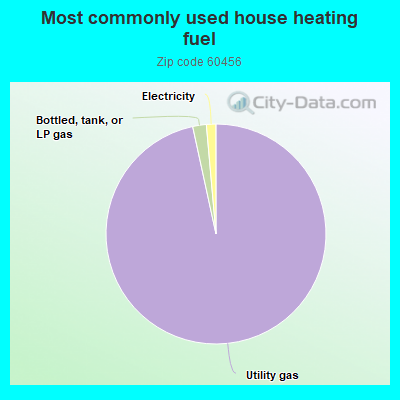
96.7%Utility gas
2.0%Bottled, tank, or LP gas
1.4%Electricity
Population in 1990: 4,769.
Place of birth for U.S.-born residents:
This state: 3,493
Northeast: 48
Midwest: 93
South: 87
West: 11
73% of the 60456 zip code residents lived in the same house 5 years ago. Out of people who lived in different houses, 93% lived in this county. Out of people who lived in different counties, 50% lived in Illinois.
92% of the 60456 zip code residents lived in the same house 1 year ago. Out of people who lived in different houses, 72% moved from this county. Out of people who lived in different houses, 20% moved from different county within same state. Out of people who lived in different houses, 4% moved from different state.
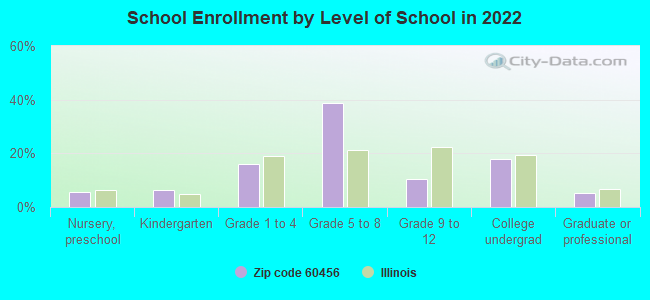
Private vs. public school enrollment:
Students in private schools in grades 1 to 8 (elementary and middle school):
Here:
0.0%
Illinois:
13.3%
Students in private schools in grades 9 to 12 (high school): 9
Here:
9.6%
Illinois:
9.9%
Students in private undergraduate colleges: 40
Here:
23.6%
Illinois:
27.4%
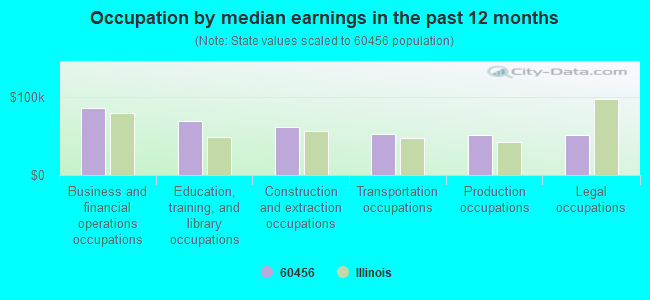
Occupation by median earnings in the past 12 months ($)
85,242Business and financial operations occupations
68,890Education, training, and library occupations
61,431Construction and extraction occupations
52,617Transportation occupations
51,024Production occupations
50,807Legal occupations
Top industries in this zip code by the number of employees in 2005:
Accommodation and Food Services: Snack and Nonalcoholic Beverage Bars (20-49 employees: 1 establishment)
Educational Services: Elementary and Secondary Schools (20-49: 1)
Health Care and Social Assistance: Offices of Physicians (except Mental Health Specialists) (20-49: 1)
Health Care and Social Assistance: Offices of Dentists (10-19: 1, 1-4: 1)
Accommodation and Food Services: Full-Service Restaurants (10-19: 1, 1-4: 1)
Health Care and Social Assistance: Offices of Physical, Occupational and Speech Therapists, and Audiologists (10-19: 1)
Finance and Insurance: All Other Nondepository Credit Intermediation (10-19: 1)
Finance and Insurance: Commercial Banking (5-9: 2)
People in group quarters in 2010:
4 people in other noninstitutional facilities
Home Mortgage Disclosure Act Aggregated Statistics For Year 2009 (Based on 2 full and 2 partial tracts)
A) FHA, FSA/RHS & VA Home Purchase Loans
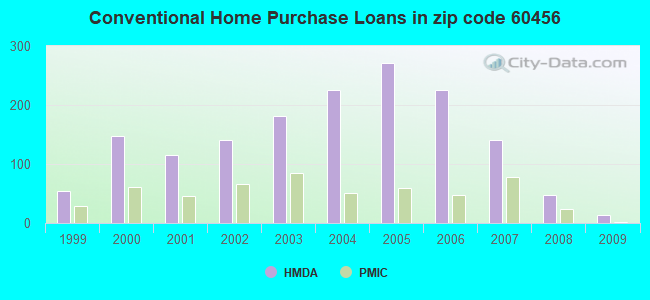
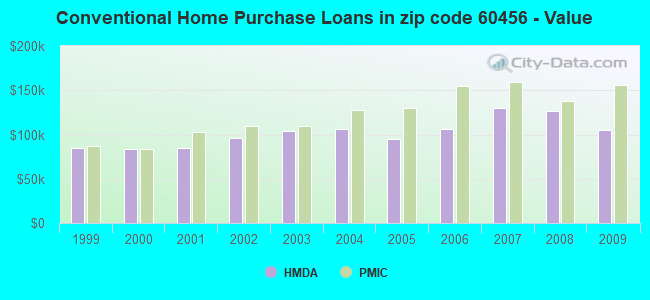
B) Conventional Home Purchase Loans
C) Refinancings
D) Home Improvement Loans
F) Non-occupant Loans on < 5 Family Dwellings (A B C & D)
Number
Average Value
Number
Average Value
Number
Average Value
Number
Average Value
Number
Average Value
LOANS ORIGINATED
33
$149,460
14
$104,731
203
$129,986
4
$48,405
12
$81,849
APPLICATIONS APPROVED, NOT ACCEPTED
0
$0
2
$105,080
20
$133,859
4
$57,602
0
$0
APPLICATIONS DENIED
8
$134,931
5
$126,284
72
$142,272
13
$21,149
2
$101,650
APPLICATIONS WITHDRAWN
0
$0
0
$0
26
$137,354
2
$14,520
0
$0
FILES CLOSED FOR INCOMPLETENESS
2
$133,600
0
$0
21
$151,855
2
$155,865
0
$0
Aggregated Statistics For Year 2008 (Based on 2 full and 2 partial tracts)
A) FHA, FSA/RHS & VA Home Purchase Loans
B) Conventional Home Purchase Loans
C) Refinancings
D) Home Improvement Loans
F) Non-occupant Loans on < 5 Family Dwellings (A B C & D)
Number
Average Value
Number
Average Value
Number
Average Value
Number
Average Value
Number
Average Value
LOANS ORIGINATED
35
$157,803
47
$126,450
184
$125,717
37
$78,250
20
$114,338
APPLICATIONS APPROVED, NOT ACCEPTED
2
$153,930
5
$190,542
26
$111,674
4
$15,490
0
$0
APPLICATIONS DENIED
9
$170,553
7
$128,614
138
$138,149
35
$45,854
0
$0
APPLICATIONS WITHDRAWN
0
$0
4
$237,278
30
$144,113
9
$56,754
2
$120,045
FILES CLOSED FOR INCOMPLETENESS
2
$152,960
0
$0
11
$147,514
4
$68,735
0
$0
Aggregated Statistics For Year 2007 (Based on 2 full and 2 partial tracts)
A) FHA, FSA/RHS & VA Home Purchase Loans
B) Conventional Home Purchase Loans
C) Refinancings
D) Home Improvement Loans
F) Non-occupant Loans on < 5 Family Dwellings (A B C & D)
G) Loans On Manufactured Home Dwelling (A B C & D)
Number
Average Value
Number
Average Value
Number
Average Value
Number
Average Value
Number
Average Value
Number
Average Value
LOANS ORIGINATED
14
$137,332
140
$129,594
288
$117,650
64
$42,728
18
$107,404
0
$0
APPLICATIONS APPROVED, NOT ACCEPTED
0
$0
14
$141,253
32
$118,411
8
$28,761
0
$0
0
$0
APPLICATIONS DENIED
4
$165,150
39
$145,779
158
$141,622
38
$47,703
4
$267,792
4
$88,895
APPLICATIONS WITHDRAWN
0
$0
12
$129,167
57
$132,897
16
$55,342
0
$0
0
$0
FILES CLOSED FOR INCOMPLETENESS
0
$0
12
$107,438
26
$130,318
2
$147,150
2
$91,970
0
$0
Aggregated Statistics For Year 2006 (Based on 2 full and 2 partial tracts)
A) FHA, FSA/RHS & VA Home Purchase Loans
B) Conventional Home Purchase Loans
C) Refinancings
D) Home Improvement Loans
F) Non-occupant Loans on < 5 Family Dwellings (A B C & D)
G) Loans On Manufactured Home Dwelling (A B C & D)
Number
Average Value
Number
Average Value
Number
Average Value
Number
Average Value
Number
Average Value
Number
Average Value
LOANS ORIGINATED
14
$148,891
225
$106,743
356
$113,747
53
$43,848
33
$94,784
0
$0
APPLICATIONS APPROVED, NOT ACCEPTED
0
$0
20
$128,870
67
$100,501
2
$169,815
2
$145,090
0
$0
APPLICATIONS DENIED
0
$0
55
$120,993
227
$116,217
54
$53,987
6
$149,510
2
$116,825
APPLICATIONS WITHDRAWN
0
$0
35
$110,389
102
$125,280
8
$59,296
10
$136,210
0
$0
FILES CLOSED FOR INCOMPLETENESS
2
$151,990
4
$140,458
37
$128,581
0
$0
2
$131,660
0
$0
Aggregated Statistics For Year 2005 (Based on 2 full and 2 partial tracts)
A) FHA, FSA/RHS & VA Home Purchase Loans
B) Conventional Home Purchase Loans
C) Refinancings
D) Home Improvement Loans
F) Non-occupant Loans on < 5 Family Dwellings (A B C & D)
G) Loans On Manufactured Home Dwelling (A B C & D)
Number
Average Value
Number
Average Value
Number
Average Value
Number
Average Value
Number
Average Value
Number
Average Value
LOANS ORIGINATED
22
$134,912
271
$95,346
354
$115,408
34
$38,651
43
$92,428
0
$0
APPLICATIONS APPROVED, NOT ACCEPTED
0
$0
22
$104,855
52
$105,107
14
$30,564
8
$86,161
0
$0
APPLICATIONS DENIED
4
$139,408
59
$90,811
195
$122,736
66
$45,001
29
$77,691
1
$10,400
APPLICATIONS WITHDRAWN
2
$159,780
29
$105,938
127
$132,710
10
$98,591
14
$82,314
2
$81,320
FILES CLOSED FOR INCOMPLETENESS
0
$0
12
$96,003
50
$117,851
2
$14,520
4
$102,135
0
$0
Aggregated Statistics For Year 2004 (Based on 2 full and 2 partial tracts)
A) FHA, FSA/RHS & VA Home Purchase Loans
B) Conventional Home Purchase Loans
C) Refinancings
D) Home Improvement Loans
E) Loans on Dwellings For 5+ Families
F) Non-occupant Loans on < 5 Family Dwellings (A B C & D)
Number
Average Value
Number
Average Value
Number
Average Value
Number
Average Value
Number
Average Value
Number
Average Value
LOANS ORIGINATED
46
$125,303
225
$106,512
386
$101,266
20
$65,766
1
$421,660
41
$98,446
APPLICATIONS APPROVED, NOT ACCEPTED
4
$126,338
32
$98,252
74
$104,301
2
$14,845
0
$0
10
$75,520
APPLICATIONS DENIED
2
$120,045
30
$89,645
164
$115,378
42
$59,889
0
$0
8
$125,399
APPLICATIONS WITHDRAWN
4
$125,852
11
$89,931
132
$106,978
2
$35,245
0
$0
10
$92,163
FILES CLOSED FOR INCOMPLETENESS
0
$0
12
$85,999
32
$117,212
2
$38,590
0
$0
2
$95,840
Aggregated Statistics For Year 2003 (Based on 2 full and 2 partial tracts)
A) FHA, FSA/RHS & VA Home Purchase Loans
B) Conventional Home Purchase Loans
C) Refinancings
D) Home Improvement Loans
E) Loans on Dwellings For 5+ Families
F) Non-occupant Loans on < 5 Family Dwellings (A B C & D)
Number
Average Value
Number
Average Value
Number
Average Value
Number
Average Value
Number
Average Value
Number
Average Value
LOANS ORIGINATED
57
$123,529
182
$104,248
594
$94,574
24
$42,397
1
$379,080
31
$93,607
APPLICATIONS APPROVED, NOT ACCEPTED
4
$130,972
26
$95,125
79
$96,038
6
$16,993
0
$0
6
$79,112
APPLICATIONS DENIED
6
$111,008
22
$115,534
221
$100,633
26
$20,542
0
$0
4
$60,308
APPLICATIONS WITHDRAWN
2
$127,790
6
$116,075
219
$102,544
10
$26,456
0
$0
6
$96,058
FILES CLOSED FOR INCOMPLETENESS
4
$130,218
4
$110,065
12
$116,163
4
$15,815
0
$0
0
$0
Aggregated Statistics For Year 2002 (Based on 2 full and 2 partial tracts)
A) FHA, FSA/RHS & VA Home Purchase Loans
B) Conventional Home Purchase Loans
C) Refinancings
D) Home Improvement Loans
F) Non-occupant Loans on < 5 Family Dwellings (A B C & D)
Number
Average Value
Number
Average Value
Number
Average Value
Number
Average Value
Number
Average Value
LOANS ORIGINATED
61
$102,717
140
$96,184
347
$91,409
19
$29,091
28
$83,931
APPLICATIONS APPROVED, NOT ACCEPTED
6
$94,023
5
$128,202
53
$94,948
6
$10,957
0
$0
APPLICATIONS DENIED
8
$121,680
25
$86,211
174
$90,288
20
$25,347
7
$123,816
APPLICATIONS WITHDRAWN
6
$112,167
11
$131,506
90
$101,975
2
$57,120
4
$86,002
FILES CLOSED FOR INCOMPLETENESS
0
$0
6
$105,595
28
$94,198
0
$0
4
$74,060
Aggregated Statistics For Year 2001 (Based on 2 full and 2 partial tracts)
A) FHA, FSA/RHS & VA Home Purchase Loans
B) Conventional Home Purchase Loans
C) Refinancings
D) Home Improvement Loans
E) Loans on Dwellings For 5+ Families
F) Non-occupant Loans on < 5 Family Dwellings (A B C & D)
Number
Average Value
Number
Average Value
Number
Average Value
Number
Average Value
Number
Average Value
Number
Average Value
LOANS ORIGINATED
111
$103,228
116
$84,614
343
$83,246
40
$36,495
2
$259,450
22
$70,355
APPLICATIONS APPROVED, NOT ACCEPTED
4
$111,205
11
$92,891
41
$67,830
4
$7,260
0
$0
6
$52,945
APPLICATIONS DENIED
6
$101,113
22
$79,295
129
$80,523
51
$16,793
0
$0
8
$70,956
APPLICATIONS WITHDRAWN
4
$85,678
13
$72,109
60
$89,940
16
$8,474
0
$0
4
$104,422
FILES CLOSED FOR INCOMPLETENESS
0
$0
4
$208,792
16
$98,548
6
$33,238
0
$0
0
$0
Aggregated Statistics For Year 2000 (Based on 2 full and 2 partial tracts)
A) FHA, FSA/RHS & VA Home Purchase Loans
B) Conventional Home Purchase Loans
C) Refinancings
D) Home Improvement Loans
F) Non-occupant Loans on < 5 Family Dwellings (A B C & D)
Number
Average Value
Number
Average Value
Number
Average Value
Number
Average Value
Number
Average Value
LOANS ORIGINATED
68
$88,976
148
$83,316
117
$66,800
39
$14,963
17
$71,760
APPLICATIONS APPROVED, NOT ACCEPTED
4
$82,288
15
$65,589
24
$58,949
18
$25,779
8
$30,315
APPLICATIONS DENIED
10
$104,635
30
$79,337
122
$61,860
48
$21,863
4
$66,592
APPLICATIONS WITHDRAWN
4
$85,190
14
$74,675
40
$68,704
14
$17,426
2
$25,170
FILES CLOSED FOR INCOMPLETENESS
0
$0
1
$158,710
26
$91,709
0
$0
0
$0
Aggregated Statistics For Year 1999 (Based on 1 full and 1 partial tracts)
A) FHA, FSA/RHS & VA Home Purchase Loans
B) Conventional Home Purchase Loans
C) Refinancings
D) Home Improvement Loans
F) Non-occupant Loans on < 5 Family Dwellings (A B C & D)
Detailed PMIC statistics for the following Tracts:8220.00
, 8221.02
2002 - 2018 National Fire Incident Reporting System (NFIRS) incidents
Based on the data from the years 2002 - 2018 the average number of fires per year is 22. The highest number of reported fire incidents - 43 took place in 2016, and the least - 12 in 2005. The data has a declining trend.
When looking into fire subcategories, the most reports belonged to: Structure Fires (70.5%), and Outside Fires (16.1%).
Fire incident types reported to NFIRS in Zip Code 60456


 Nearest zip codes: 60652, 60453, 60805, 60459, 60655, 60629.
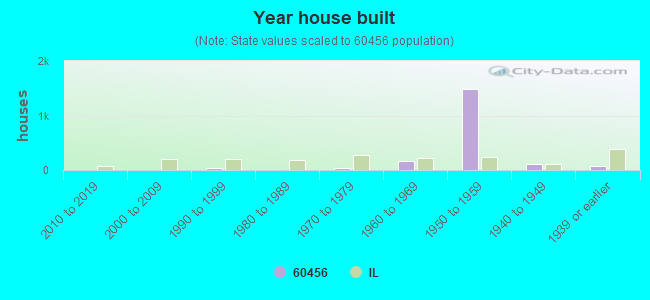


 Based on the data from the years 2002 - 2018 the average number of fires per year is 22. The highest number of reported fire incidents - 43 took place in 2016, and the least - 12 in 2005. The data has a declining trend.
 When looking into fire subcategories, the most reports belonged to: Structure Fires (70.5%), and Outside Fires (16.1%).