Estimated zip code population in 2022: 1,098 Zip code population in 2010: 1,141 Zip code population in 2000: 1,334
Houses and condos: 514 Renter-occupied apartments: 117
% of renters here:
26%
State:
33%
March 2022 cost of living index in zip code 61933: 82.2 (low, U.S. average is 100)
Land area: 59.9 sq. mi. Water area: 0.0 sq. mi.
Population density: 18 people per square mile
(very low).
OSM Map
General Map
Google Map
MSN Map
OSM Map
General Map
Google Map
MSN Map
OSM Map
General Map
Google Map
MSN Map
OSM Map
General Map
Google Map
MSN Map
Please wait while loading the map...
Real estate property taxes paid for housing units in 2022:
This zip code:
1.3% ($1,058)
Illinois:
2.0% ($4,912)
Median real estate property taxes paid for housing units with mortgages in 2022: $1,329 (1.6%) Median real estate property taxes paid for housing units with no mortgage in 2022: $889 (1.3%)
Estimated median house/condo value in 2022: $79,237
61933:
$79,237
Illinois:
$251,600
According to our research of Illinois and other state lists, there was 1 registered sex offender living in 61933 zip code as of June 16, 2024. The ratio of all residents to sex offenders in zip code 61933 is 954 to 1. The ratio of registered sex offenders to all residents in this zip code is lower than the state average.
Median resident age:
This zip code:
45.1 years
Illinois median age:
39.1 years
Average household size:
This zip code:
2.5 people
Illinois:
2.4 people
Averages for the 2020 tax year for zip code 61933, filed in 2021:
Average Adjusted Gross Income (AGI) in 2020: $53,896 (Individual Income Tax Returns)
Here:
$53,896
State:
$82,626
Salary/wage: $34,932 (reported on 83.3% of returns)
Here:
$34,932
State:
$66,640
(% of AGI for various income ranges: 1109.2% for AGIs below $25k, 3389.1% for AGIs $25k-50k, 5196.0% for AGIs $50k-75k, 9140.0% for AGIs $75k-100k, 17315.0% for AGIs $100k-200k)
Taxable interest for individuals: $756 (reported on 33.3% of returns)
This zip code:
$756
Illinois:
$2,376
(% of AGI for various income ranges: 7.7% for AGIs below $25k, 13.6% for AGIs $25k-50k, 34.0% for AGIs $50k-75k, 93.3% for AGIs $75k-100k, 255.0% for AGIs $100k-200k)
Ordinary dividends: $1,686 (reported on 14.6% of returns)
Here:
$1,686
State:
$9,061
(% of AGI for various income ranges: 90.0% for AGIs $50k-75k, 365.0% for AGIs $100k-200k)
Net capital gain/loss in AGI: +$5,260 (reported on 10.4% of returns)
Here:
+$5,260
State:
+$31,684
(% of AGI for various income ranges: 6.4% for AGIs $25k-50k, 853.3% for AGIs $75k-100k)
Profit/loss from business: +$8,717 (reported on 12.5% of returns)
Here:
+$8,717
State:
+$12,175
(% of AGI for various income ranges: 186.4% for AGIs $25k-50k, 1060.0% for AGIs $75k-100k)
Taxable individual retirement arrangement distribution: $9,525 (reported on 8.3% of returns)
61933:
$9,525
Illinois:
$21,613
(% of AGI for various income ranges: 762.0% for AGIs $50k-75k)
Earned income credit: $2,420 (reported on 20.8% of returns)
Here:
$2,420
State:
$2,311
(% of AGI for various income ranges: 112.3% for AGIs below $25k, 87.3% for AGIs $25k-50k)
Percentage of individuals using paid preparers for their 2020 taxes: 95.8%
Here:
96%
State:
93%
(% for various income ranges: 94.1% for AGIs below $25k, 100.0% for AGIs $25k-50k, 100.0% for AGIs $50k-75k, 83.3% for AGIs $75k-100k, 100.0% for AGIs $100k-200k)
Averages for the 2012 tax year for zip code 61933, filed in 2013:
Average Adjusted Gross Income (AGI) in 2012: $49,327 (Individual Income Tax Returns)
Here:
$49,327
State:
$68,058
Salary/wage: $32,483 (reported on 85.7% of returns)
Here:
$32,483
State:
$55,396
(% of AGI for various income ranges: 76.9% for AGIs below $25k, 82.5% for AGIs $25k-50k, 67.4% for AGIs $50k-75k, 68.4% for AGIs $75k-100k, 23.7% for AGIs $100k-200k)
Taxable interest for individuals: $806 (reported on 36.7% of returns)
This zip code:
$806
Illinois:
$1,969
(% of AGI for various income ranges: 0.7% for AGIs below $25k, 0.5% for AGIs $25k-50k, 0.5% for AGIs $50k-75k, 0.3% for AGIs $75k-100k, 0.8% for AGIs $100k-200k)
Ordinary dividends: $2,175 (reported on 16.3% of returns)
Here:
$2,175
State:
$7,786
Net capital gain/loss in AGI: +$1,083 (reported on 12.2% of returns)
Here:
+$1,083
State:
+$22,183
Profit/loss from business: +$10,250 (reported on 12.2% of returns)
Here:
+$10,250
State:
+$12,903
Taxable individual retirement arrangement distribution: $6,250 (reported on 8.2% of returns)
61933:
$6,250
Illinois:
$17,929
Total itemized deductions: $18,283 (15% of AGI, reported on 12.2% of returns)
Here:
$18,283
State:
$26,433
Here:
14.6% of AGI
State:
19.2% of AGI
(% of AGI for various income ranges: 14.6% for AGIs below $25k, 6.1% for AGIs $50k-75k, 5.3% for AGIs $100k-200k)
Charity contributions: $5,525 (reported on 8.2% of returns)
Here:
$5,525
State:
$4,525
(% of AGI for various income ranges: 2.0% for AGIs $25k-50k, 3.7% for AGIs $75k-100k)
Taxes paid: $7,233 (reported on 12.2% of returns)
61933:
$7,233
State:
$11,968
(% of AGI for various income ranges: 2.5% for AGIs below $25k, 1.9% for AGIs $50k-75k, 3.3% for AGIs $100k-200k)
Earned income credit: $2,070 (reported on 20.4% of returns)
Here:
$2,070
State:
$2,349
(% of AGI for various income ranges: 6.2% for AGIs below $25k, 1.6% for AGIs $25k-50k)
Percentage of individuals using paid preparers for their 2012 taxes: 63.3%
Here:
63%
State:
57%
(% for various income ranges: 57.9% for AGIs below $25k, 61.5% for AGIs $25k-50k, 66.7% for AGIs $50k-75k, 50.0% for AGIs $75k-100k, 100.0% for AGIs $100k-200k)
Averages for the 2004 tax year for zip code 61933, filed in 2005:
Average Adjusted Gross Income (AGI) in 2004: $34,049 (Individual Income Tax Returns)
Here:
$34,049
State:
$54,625
Salary/wage: $27,681 (reported on 84.5% of returns)
Here:
$27,681
State:
$46,811
(% of AGI for various income ranges: 183.5% for AGIs below $10k, 73.7% for AGIs $10k-25k, 75.6% for AGIs $25k-50k, 73.9% for AGIs $50k-75k, 69.0% for AGIs $75k-100k, 24.5% for AGIs over 100k)
Taxable interest for individuals: $1,045 (reported on 49.5% of returns)
This zip code:
$1,045
Illinois:
$2,101
(% of AGI for various income ranges: 10.1% for AGIs below $10k, 2.0% for AGIs $10k-25k, 1.0% for AGIs $25k-50k, 0.9% for AGIs $50k-75k, 4.4% for AGIs $75k-100k)
Taxable dividends: $967 (reported on 17.0% of returns)
Here:
$967
State:
$4,306
(% of AGI for various income ranges: 1.0% for AGIs below $10k, 1.1% for AGIs $10k-25k, 0.4% for AGIs $25k-50k, 0.3% for AGIs $50k-75k, 0.9% for AGIs $75k-100k)
Net capital gain/loss: +$1,091 (reported on 12.3% of returns)
Here:
+$1,091
State:
+$17,321
(% of AGI for various income ranges: -2.4% for AGIs below $10k, 0.1% for AGIs $10k-25k, 0.3% for AGIs $25k-50k, 0.2% for AGIs $50k-75k, 2.0% for AGIs $75k-100k)
Profit/loss from business: +$5,329 (reported on 13.1% of returns)
Here:
+$5,329
State:
+$11,771
(% of AGI for various income ranges: 8.4% for AGIs below $10k, 3.5% for AGIs $10k-25k, 3.1% for AGIs $25k-50k, 1.9% for AGIs $50k-75k)
Profit/loss from farming: +$16,192 (reported on 9.7% of returns)
Here:
+$16,192
State:
+$2,327
IRA payment deduction: $2,714 (reported on 2.6% of returns)
61933:
$2,714
Illinois:
$3,087
Total itemized deductions: $14,203 (21% of AGI, reported on 12.0% of returns)
Here:
$14,203
State:
$20,239
Here:
21.4% of AGI
State:
19.5% of AGI
Charity contributions deductions: $4,578 (8% of AGI, reported on 8.4% of returns)
Here:
$4,578
State:
$3,719
Here:
7.5% of AGI
State:
3.4% of AGI
Total tax: $4,657 (reported on 72.0% of returns)
61933:
$4,657
State:
$9,882
(% of AGI for various income ranges: 6.1% for AGIs below $10k, 4.0% for AGIs $10k-25k, 7.6% for AGIs $25k-50k, 9.2% for AGIs $50k-75k, 11.2% for AGIs $75k-100k, 20.2% for AGIs over 100k)
Earned income credit: $1,818 (reported on 16.4% of returns)
Here:
$1,818
State:
$1,788
Percentage of individuals using paid preparers for their 2004 taxes: 61.5%
Here:
61%
State:
61%
(% for various income ranges: 55.5% for AGIs below $10k, 58.5% for AGIs $10k-25k, 62.8% for AGIs $25k-50k, 65.5% for AGIs $50k-75k, 110.7% for AGIs $75k-100k)
Household received Food Stamps/SNAP in the past 12 months: 142 Household did not receive Food Stamps/SNAP in the past 12 months: 312
Women who had a birth in the past 12 months: 1 (1 now married, 0 unmarried) Women who did not have a birth in the past 12 months: 255 (129 now married, 125 unmarried)
Housing units in zip code 61933 with a mortgage: 181 (30 second mortgage, 9 home equity loan, 19 both second mortgage and home equity loan) Median monthly owner costs for units with a mortgage: $977 Median monthly owner costs for units without a mortgage: $387
Residents with income below the poverty level in 2022:
This zip code:
13.7%
Whole state:
11.9%
Residents with income below 50% of the poverty level in 2022:
This zip code:
8.7%
Whole state:
5.7%
Median number of rooms in houses and condos:
Here:
7.0
State:
6.4
Median number of rooms in apartments:
Here:
4.7
State:
4.1
Notable locations in this zip code not listed on our city pages
Churches in zip code 61933 include: Pleasant Hill Church (A), Richwood Church (B), Harmony Church (C), Kansas Christian Church (D). Display/hide their locations on the map
Cemeteries: Waite Cemetery (1), Wilhoit Cemetery (2), Pleasant Hill Cemetery (3), Harmony Cemetery (4), Poulter Cemetery (5), Conrad Baptist Cemetery (6), Fairview Cemetery (7). Display/hide their locations on the map
Size of family households: 85 2-persons, 61 3-persons, 46 4-persons, 3 5-persons, 67 6-persons, 1 7-or-more-persons
Size of nonfamily households: 145 1-person, 27 2-persons, 8 3-persons
161 married couples with children.
38 single-parent households (4 men, 34 women).
96.1% of residents of 61933 zip code speak English at home.
3.1% of residents speak other Indo-European language at home (100% very well).
0.1% of residents speak Asian or Pacific Island language at home (100% very well).
Foreign born population: 3 (0.3%) (100.0% of them are naturalized citizens)
This zip code:
0.3%
Whole state:
14.4%
100%Poland
25%American
21%English
14%German
11%Irish
2%European
1%Italian
1%Scottish
Year of entry for the foreign-born population
02010 or later
02000 to 2009
01990 to 1999
2Before 1990
Facilities with environmental interests located in this zip code:
LANMAN OIL CO (WEST BUENA VISTA ST in KANSAS, IL)
STATE MASTER (Illinois EPA Project) - AIR PROGRAM AIR MINOR (AIRS/AFS) CRITERIA AND HAZARDOUS AIR POLLUTANT INVENTORY (Inventory of air pollution sources) Business SIC classification: PETROLEUM BULK STATIONS AND TERMINALS
ICM GRAIN CO KANSAS ELEVATOR (STATE HIGHWAY #16 in KANSAS, IL)
STATE MASTER (Illinois EPA Project) - AIR PROGRAM AIR MINOR (AIRS/AFS) Business SIC classification: GRAIN AND FIELD BEANS
KANSAS WTP (115 CHERRY AVENUE in KANSAS, IL)
STATE MASTER (Illinois EPA Project) - National Pollutant Discharge Elimination System Permit National Pollutant Discharge Elimination System NON-MAJOR (Tracking pollutant discharge elimination systems) - permit Business SIC classification: WATER SUPPLY Alternative names: KANSAS WTP, VILLAGE OF
MEEKER GRAIN CO (RTE 16 W in KANSAS, IL)
STATE MASTER (Illinois EPA Project) - AIR PROGRAM AIR MINOR (AIRS/AFS) Business SIC classification: GRAIN AND FIELD BEANS
CHRISTENSEN FARM MIDWEST LLC (1915-2497 N 460TH ST in KANSAS, IL)
STATE MASTER (Illinois EPA Project) - AIR PROGRAM AIR MINOR (AIRS/AFS) Business SIC classification: HOGS Alternative names: HEARTLAND PORK
KANSAS HIGH SCHOOL (P O BOX 350 in KANSAS, IL)
(Geographic Names Information System) (National Center for Education Statistics) - STATE ID-1102300300001 Organizations: KANSAS COMM UNIT SCHOOL DIST 3 (SCHOOL DISTRICT)
KANSAS ELEM SCHOOL (P O BOX 350 in KANSAS, IL)
(National Center for Education Statistics) - STATE ID-1102300302002 Organizations: KANSAS COMM UNIT SCHOOL DIST 3 (SCHOOL DISTRICT)
AMOCO FERTILIZER PLANT (RTE 16 W in KANSAS, IL)
(Resource Conservation and Recovery Act (tracking hazardous waste))
MELTON TRUCKING?JAMES (PO BOX 446 in KANSAS, IL)
National Pollutant Discharge Elimination System NON-MAJOR (Tracking pollutant discharge elimination systems) - permit Alternative names: MELTON, JAMES TRUCKING
AT AND T (3 MI E ON ILL RT 6 in KANSAS, IL)
Conditionally Exempt Small Quantity Generators, less than 100 kg/month of hazardous waste (Resource Conservation and Recovery Act (tracking hazardous waste)) - notification Organizations: AT AND T PROMILA LAL (CONTACT/OWNER)
KANSAS COMMUNITY UNIT SCH DIST 1 (FRONT STREET BOX 350 in KANSAS, IL)
COMPLIANCE ACTIVITY (Tracking inspections of insecticide, fungicide, and rodenticide, and toxic substances)
ROYSTER CLARK (P.O. BOX 291 in KANSAS, IL)
ENFORCEMENT/COMPLIANCE ACTIVITY (Integrated Compliance Information System)
Housing units lacking complete plumbing facilities: 2.9% Housing units lacking complete kitchen facilities: 3.5%
49.3%Utility gas
28.4%Electricity
22.0%Bottled, tank, or LP gas
0.7%Other fuel
Population in 1990: 1,114. Population change in the 1990s: +220 (+19.7%).
Place of birth for U.S.-born residents:
This state: 918
Northeast: 2
Midwest: 131
South: 35
West: 4
61% of the 61933 zip code residents lived in the same house 5 years ago. Out of people who lived in different houses, 52% lived in this county. Out of people who lived in different counties, 50% lived in Illinois.
94% of the 61933 zip code residents lived in the same house 1 year ago. Out of people who lived in different houses, 51% moved from this county. Out of people who lived in different houses, 23% moved from different county within same state. Out of people who lived in different houses, 23% moved from different state.
Private vs. public school enrollment:
Students in private schools in grades 1 to 8 (elementary and middle school):
Here:
0.0%
Illinois:
13.3%
Students in private schools in grades 9 to 12 (high school): 1
Here:
2.6%
Illinois:
9.9%
Students in private undergraduate colleges:
Here:
4.1%
Illinois:
27.4%
Occupation by median earnings in the past 12 months ($)
84,585Transportation occupations
73,411Management occupations
61,843Installation, maintenance, and repair occupations
59,740Health diagnosing and treating practitioners and other technical occupations
57,066Health technologists and technicians
49,712Education, training, and library occupations
Top industries in this zip code by the number of employees in 2005:
Construction: Other Heavy and Civil Engineering Construction (5-9 employees: 1 establishment, 1-4 employees: 1 establishment)
Health Care and Social Assistance: Other Individual and Family Services (5-9: 1)
Wholesale Trade: Grain and Field Bean Merchant Wholesalers (5-9: 1)
Construction: New Single-Family Housing Construction (except Operative Builders) (1-4: 2)
Fatal accident statistics in 2013:
Fatal accident count: 1
Vehicles involved in fatal accidents: 1
Fatal accidents caused by drunken drivers: 1
Fatalities: 1
Persons involved in fatal accidents: 1
Pedestrians involved in fatal accidents: 0
2002 - 2016 National Fire Incident Reporting System (NFIRS) incidents
Based on the data from the years 2002 - 2016 the average number of fires per year is 10. The highest number of reported fire incidents - 26 took place in 2009, and the least - 0 in 2012. The data has a dropping trend.
When looking into fire subcategories, the most reports belonged to: Outside Fires (44.1%), and Structure Fires (32.2%).
Fire incident types reported to NFIRS in Zip Code 61933

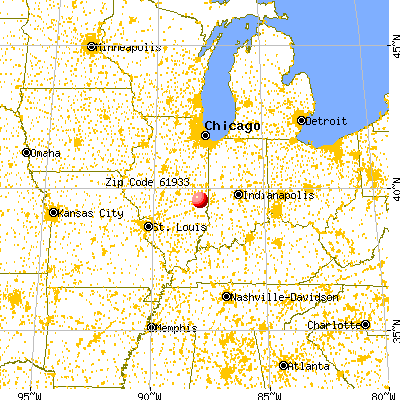


 Nearest zip codes: 61949, 61912, 62474, 61943, 61917, 61920.


 Based on the data from the years 2002 - 2016 the average number of fires per year is 10. The highest number of reported fire incidents - 26 took place in 2009, and the least - 0 in 2012. The data has a dropping trend.
 When looking into fire subcategories, the most reports belonged to: Outside Fires (44.1%), and Structure Fires (32.2%).