Estimated zip code population in 2022: 3,470 Zip code population in 2010: 3,816 Zip code population in 2000: 4,001
Houses and condos: 1,728 Renter-occupied apartments: 459
% of renters here:
31%
State:
33%
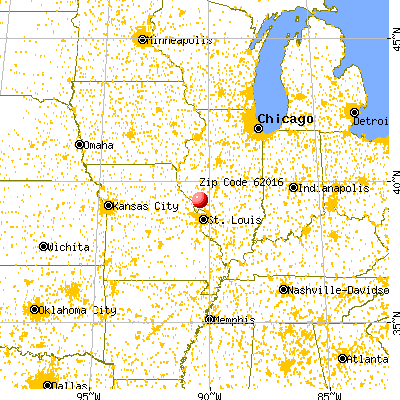
March 2022 cost of living index in zip code 62016: 84.5 (less than average, U.S. average is 100)
Land area: 132.7 sq. mi. Water area: 0.1 sq. mi.
Population density: 26 people per square mile
(very low).
OSM Map
General Map
Google Map
MSN Map
OSM Map
General Map
Google Map
MSN Map
OSM Map
General Map
Google Map
MSN Map
OSM Map
General Map
Google Map
MSN Map
Please wait while loading the map...
Real estate property taxes paid for housing units in 2022:
This zip code:
1.4% ($1,715)
Illinois:
2.0% ($4,912)
Median real estate property taxes paid for housing units with mortgages in 2022: $2,098 (1.7%) Median real estate property taxes paid for housing units with no mortgage in 2022: $1,528 (1.3%)
Business Search- 14 Million verified businesses
Males: 1,881
(54.2%)
Females: 1,589
(45.8%)
For population 25 years and over in 62016:
High school or higher: 91.5%
Bachelor's degree or higher: 21.1%
Graduate or professional degree: 5.8%
Unemployed: 2.3%
Mean travel time to work (commute): 25.3 minutes
For population 15 years and over in 62016:
Never married: 30.5%
Now married: 49.3%
Separated: 1.4%
Widowed: 8.8%
Divorced: 9.9%
Zip code 62016 compared to state average:
Median house value below state average.
Unemployed percentage below state average.
Black race population percentage significantly below state average.
Hispanic race population percentage significantly below state average.
Median age above state average.
Foreign-born population percentage significantly below state average.
Length of stay since moving in significantly above state average.
Number of college students below state average.
Percentage of population with a bachelor's degree or higher below state average.
Averages for the 2020 tax year for zip code 62016, filed in 2021:
Average Adjusted Gross Income (AGI) in 2020: $60,045 (Individual Income Tax Returns)
Here:
$60,045
State:
$82,626
Salary/wage: $50,675 (reported on 80.2% of returns)
Here:
$50,675
State:
$66,640
(% of AGI for various income ranges: 1219.2% for AGIs below $25k, 3385.8% for AGIs $25k-50k, 5947.4% for AGIs $50k-75k, 9985.4% for AGIs $75k-100k, 13910.6% for AGIs $100k-200k)
Taxable interest for individuals: $1,013 (reported on 42.9% of returns)
This zip code:
$1,013
Illinois:
$2,376
(% of AGI for various income ranges: 31.2% for AGIs below $25k, 30.9% for AGIs $25k-50k, 69.5% for AGIs $50k-75k, 91.5% for AGIs $75k-100k, 146.5% for AGIs $100k-200k)
Ordinary dividends: $2,165 (reported on 20.9% of returns)
Here:
$2,165
State:
$9,061
(% of AGI for various income ranges: 16.2% for AGIs below $25k, 28.2% for AGIs $25k-50k, 73.7% for AGIs $50k-75k, 95.4% for AGIs $75k-100k, 187.6% for AGIs $100k-200k)
Net capital gain/loss in AGI: +$8,648 (reported on 17.5% of returns)
Here:
+$8,648
State:
+$31,684
(% of AGI for various income ranges: 11.2% for AGIs below $25k, 44.5% for AGIs $25k-50k, 107.4% for AGIs $50k-75k, 90.0% for AGIs $75k-100k, 655.3% for AGIs $100k-200k)
Profit/loss from business: +$6,854 (reported on 14.7% of returns)
Here:
+$6,854
State:
+$12,175
(% of AGI for various income ranges: 141.8% for AGIs below $25k, 40.6% for AGIs $25k-50k, 177.9% for AGIs $50k-75k, 221.5% for AGIs $75k-100k, 267.6% for AGIs $100k-200k)
Taxable individual retirement arrangement distribution: $13,017 (reported on 10.2% of returns)
62016:
$13,017
Illinois:
$21,613
(% of AGI for various income ranges: 40.5% for AGIs below $25k, 90.0% for AGIs $25k-50k, 126.8% for AGIs $50k-75k, 256.9% for AGIs $75k-100k, 770.0% for AGIs $100k-200k)
Total itemized deductions: $31,875 (reported on 2.3% of returns)
Here:
$31,875
State:
$34,948
(% of AGI for various income ranges: 154.2% for AGIs below $25k, 387.1% for AGIs $100k-200k)
Charity contributions: $8,133 (reported on 1.7% of returns)
Here:
$8,133
State:
$13,122
(% of AGI for various income ranges: 187.7% for AGIs $75k-100k)
Taxes paid: $6,200 (reported on 2.3% of returns)
62016:
$6,200
State:
$8,563
(% of AGI for various income ranges: 145.9% for AGIs $100k-200k)
Earned income credit: $2,100 (reported on 14.7% of returns)
Here:
$2,100
State:
$2,311
(% of AGI for various income ranges: 79.8% for AGIs below $25k, 68.8% for AGIs $25k-50k)
Percentage of individuals using paid preparers for their 2020 taxes: 94.4%
Here:
94%
State:
93%
(% for various income ranges: 90.0% for AGIs below $25k, 95.2% for AGIs $25k-50k, 96.0% for AGIs $50k-75k, 100.0% for AGIs $75k-100k, 96.2% for AGIs $100k-200k, 100.0% for AGIs over 200k)
Averages for the 2012 tax year for zip code 62016, filed in 2013:
Average Adjusted Gross Income (AGI) in 2012: $48,020 (Individual Income Tax Returns)
Here:
$48,020
State:
$68,058
Salary/wage: $39,544 (reported on 78.8% of returns)
Here:
$39,544
State:
$55,396
(% of AGI for various income ranges: 67.1% for AGIs below $25k, 73.1% for AGIs $25k-50k, 74.0% for AGIs $50k-75k, 70.5% for AGIs $75k-100k, 63.8% for AGIs $100k-200k, 28.8% for AGIs over 200k)
Taxable interest for individuals: $1,154 (reported on 48.6% of returns)
This zip code:
$1,154
Illinois:
$1,969
(% of AGI for various income ranges: 3.0% for AGIs below $25k, 1.2% for AGIs $25k-50k, 0.9% for AGIs $50k-75k, 0.8% for AGIs $75k-100k, 1.3% for AGIs $100k-200k, 0.5% for AGIs over 200k)
Ordinary dividends: $1,677 (reported on 21.8% of returns)
Here:
$1,677
State:
$7,786
(% of AGI for various income ranges: 0.8% for AGIs below $25k, 0.9% for AGIs $25k-50k, 0.7% for AGIs $50k-75k, 1.0% for AGIs $75k-100k, 0.9% for AGIs $100k-200k)
Net capital gain/loss in AGI: +$7,989 (reported on 15.1% of returns)
Here:
+$7,989
State:
+$22,183
(% of AGI for various income ranges: 0.2% for AGIs below $25k, 0.6% for AGIs $25k-50k, 0.8% for AGIs $50k-75k, 0.5% for AGIs $75k-100k, 9.8% for AGIs $100k-200k)
Profit/loss from business: +$8,652 (reported on 14.0% of returns)
Here:
+$8,652
State:
+$12,903
(% of AGI for various income ranges: 4.2% for AGIs below $25k, 2.2% for AGIs $25k-50k, 2.6% for AGIs $50k-75k, 3.2% for AGIs $75k-100k, 2.7% for AGIs $100k-200k)
Taxable individual retirement arrangement distribution: $9,152 (reported on 11.7% of returns)
62016:
$9,152
Illinois:
$17,929
(% of AGI for various income ranges: 2.9% for AGIs below $25k, 2.5% for AGIs $25k-50k, 1.9% for AGIs $50k-75k, 2.4% for AGIs $75k-100k, 3.0% for AGIs $100k-200k)
Total itemized deductions: $17,487 (18% of AGI, reported on 17.3% of returns)
Here:
$17,487
State:
$26,433
Here:
17.7% of AGI
State:
19.2% of AGI
(% of AGI for various income ranges: 3.6% for AGIs below $25k, 6.4% for AGIs $25k-50k, 4.8% for AGIs $50k-75k, 8.0% for AGIs $75k-100k, 7.0% for AGIs $100k-200k, 6.7% for AGIs over 200k)
Charity contributions: $3,790 (reported on 11.2% of returns)
Here:
$3,790
State:
$4,525
(% of AGI for various income ranges: 0.5% for AGIs $25k-50k, 0.7% for AGIs $50k-75k, 1.2% for AGIs $75k-100k, 1.0% for AGIs $100k-200k, 1.6% for AGIs over 200k)
Taxes paid: $6,694 (reported on 17.3% of returns)
62016:
$6,694
State:
$11,968
(% of AGI for various income ranges: 0.5% for AGIs below $25k, 1.4% for AGIs $25k-50k, 1.7% for AGIs $50k-75k, 2.9% for AGIs $75k-100k, 3.4% for AGIs $100k-200k, 4.1% for AGIs over 200k)
Earned income credit: $2,167 (reported on 15.1% of returns)
Here:
$2,167
State:
$2,349
(% of AGI for various income ranges: 5.2% for AGIs below $25k, 0.9% for AGIs $25k-50k)
Percentage of individuals using paid preparers for their 2012 taxes: 68.7%
Here:
69%
State:
57%
(% for various income ranges: 63.0% for AGIs below $25k, 68.3% for AGIs $25k-50k, 70.4% for AGIs $50k-75k, 80.0% for AGIs $75k-100k, 73.3% for AGIs $100k-200k, 100.0% for AGIs over 200k)
Averages for the 2004 tax year for zip code 62016, filed in 2005:
Average Adjusted Gross Income (AGI) in 2004: $34,813 (Individual Income Tax Returns)
Here:
$34,813
State:
$54,625
Salary/wage: $31,237 (reported on 81.6% of returns)
Here:
$31,237
State:
$46,811
(% of AGI for various income ranges: 90.6% for AGIs below $10k, 66.2% for AGIs $10k-25k, 74.8% for AGIs $25k-50k, 79.0% for AGIs $50k-75k, 76.4% for AGIs $75k-100k, 58.7% for AGIs over 100k)
Taxable interest for individuals: $1,765 (reported on 50.0% of returns)
This zip code:
$1,765
Illinois:
$2,101
(% of AGI for various income ranges: 8.9% for AGIs below $10k, 5.1% for AGIs $10k-25k, 2.6% for AGIs $25k-50k, 1.5% for AGIs $50k-75k, 1.3% for AGIs $75k-100k, 2.4% for AGIs over 100k)
Taxable dividends: $2,317 (reported on 25.0% of returns)
Here:
$2,317
State:
$4,306
(% of AGI for various income ranges: 3.8% for AGIs below $10k, 1.5% for AGIs $10k-25k, 0.4% for AGIs $25k-50k, 1.3% for AGIs $50k-75k, 1.6% for AGIs $75k-100k, 4.5% for AGIs over 100k)
Net capital gain/loss: +$1,963 (reported on 17.7% of returns)
Here:
+$1,963
State:
+$17,321
(% of AGI for various income ranges: -2.4% for AGIs below $10k, 0.4% for AGIs $10k-25k, 1.1% for AGIs $25k-50k, 1.0% for AGIs $50k-75k, 0.6% for AGIs $75k-100k, 2.5% for AGIs over 100k)
Profit/loss from business: +$6,081 (reported on 14.6% of returns)
Here:
+$6,081
State:
+$11,771
(% of AGI for various income ranges: 6.4% for AGIs below $10k, 4.1% for AGIs $10k-25k, 1.4% for AGIs $25k-50k, 1.6% for AGIs $50k-75k, 1.6% for AGIs $75k-100k, 5.5% for AGIs over 100k)
Profit/loss from farming: +$5,736 (reported on 8.8% of returns)
Here:
+$5,736
State:
+$2,327
(% of AGI for various income ranges: 2.6% for AGIs below $10k, 1.6% for AGIs $10k-25k, 1.4% for AGIs $25k-50k, 3.0% for AGIs $50k-75k, 0.1% for AGIs $75k-100k)
IRA payment deduction: $2,429 (reported on 2.3% of returns)
62016:
$2,429
Illinois:
$3,087
Total itemized deductions: $13,955 (21% of AGI, reported on 13.3% of returns)
Here:
$13,955
State:
$20,239
Here:
21.4% of AGI
State:
19.5% of AGI
(% of AGI for various income ranges: 5.6% for AGIs below $10k, 4.8% for AGIs $10k-25k, 4.3% for AGIs $25k-50k, 4.4% for AGIs $50k-75k, 7.0% for AGIs $75k-100k, 7.3% for AGIs over 100k)
Charity contributions deductions: $2,768 (4% of AGI, reported on 10.5% of returns)
Here:
$2,768
State:
$3,719
Here:
4.1% of AGI
State:
3.4% of AGI
(% of AGI for various income ranges: 0.7% for AGIs $10k-25k, 0.6% for AGIs $25k-50k, 0.5% for AGIs $50k-75k, 1.0% for AGIs $75k-100k, 1.8% for AGIs over 100k)
Total tax: $4,147 (reported on 75.3% of returns)
62016:
$4,147
State:
$9,882
(% of AGI for various income ranges: 4.7% for AGIs below $10k, 4.2% for AGIs $10k-25k, 7.0% for AGIs $25k-50k, 8.6% for AGIs $50k-75k, 10.2% for AGIs $75k-100k, 16.4% for AGIs over 100k)
Earned income credit: $1,711 (reported on 14.6% of returns)
Here:
$1,711
State:
$1,788
Percentage of individuals using paid preparers for their 2004 taxes: 67.8%
Here:
68%
State:
61%
(% for various income ranges: 61.1% for AGIs below $10k, 64.9% for AGIs $10k-25k, 72.8% for AGIs $25k-50k, 68.2% for AGIs $50k-75k, 76.3% for AGIs $75k-100k, 79.7% for AGIs over 100k)
Likely homosexual households (counted as self-reported same-sex unmarried-partner households)
Lesbian couples: 0.0% of all households
Gay men: 0.3% of all households
Household received Food Stamps/SNAP in the past 12 months: 183 Household did not receive Food Stamps/SNAP in the past 12 months: 1,316
Women who had a birth in the past 12 months: 30 (0 now married, 31 unmarried) Women who did not have a birth in the past 12 months: 593 (278 now married, 313 unmarried)
Housing units in zip code 62016 with a mortgage: 407 (17 second mortgage, 17 both second mortgage and home equity loan) Median monthly owner costs for units with a mortgage: $1,081 Median monthly owner costs for units without a mortgage: $543
Residents with income below the poverty level in 2022:
This zip code:
8.6%
Whole state:
11.9%
Residents with income below 50% of the poverty level in 2022:
This zip code:
4.6%
Whole state:
5.7%
Median number of rooms in houses and condos:
Here:
6.3
State:
6.4
Median number of rooms in apartments:
Here:
5.0
State:
4.1
Notable locations in this zip code not listed on our city pages
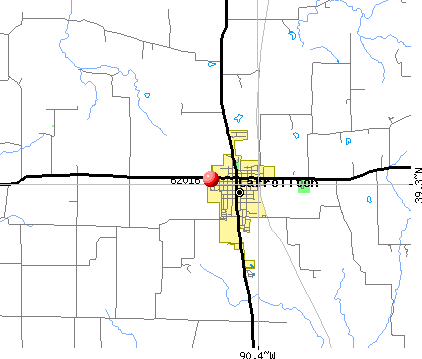
Notable locations in zip code 62016: Carrollton Volunteer Fire Protection District (A), Greene County Courthouse (B). Display/hide their locations on the map
Cemeteries: Cannedy Cemetery (1), Carter Cemetery (2), Eldred Memorial Gardens (3), Elm Dale Cemetery (4), Erwin Cemetery (5), Hardcastle Cemetery (6), Hopewell Cemetery (7). Display/hide their locations on the map
Streams, rivers, and creeks: Boyer Creek (A), Bear Creek (B), Whitaker Creek (C), Sand Creek (D), Dry Branch (E), Sand Branch (F), Drapper Branch (G), Little Bear Rough (H), Link Branch (I). Display/hide their locations on the map
In group quarters: 37 (-1 institutionalized population)
Size of family households: 515 2-persons, 140 3-persons, 132 4-persons, 69 5-persons, 2 6-persons, 13 7-or-more-persons
Size of nonfamily households: 555 1-person, 79 2-persons
406 married couples with children.
221 single-parent households (56 men, 165 women).
98.5% of residents of 62016 zip code speak English at home.
1.1% of residents speak Spanish at home (97% very well, 3% not at all).
0.2% of residents speak other Indo-European language at home (100% very well).
Foreign born population: 11 (0.3%) (0.0% of them are naturalized citizens)
:
0.3%
Whole state:
14.4%
92%France
37%German
17%English
15%American
13%Irish
3%European
2%Scottish
1%French
Year of entry for the foreign-born population
02010 or later
02000 to 2009
01990 to 1999
41Before 1990
Facilities with environmental interests located in this zip code:
ILLINOIS VALLEY SUPPLY CO (E. N MAIN ST in CARROLLTON, IL)
STATE MASTER (Illinois EPA Project) - AIR PROGRAM AIR MINOR (AIRS/AFS) CRITERIA AND HAZARDOUS AIR POLLUTANT INVENTORY (Inventory of air pollution sources) Business SIC classification: FARM SUPPLIES
GREENE COUNTY SERVICE CO CARROLLTON PLAN (MAIN ST in CARROLLTON, IL)
STATE MASTER (Illinois EPA Project) - AIR PROGRAM AIR MINOR (AIRS/AFS) Business SIC classification: FERTILIZERS, MIXING ONLY
HOWARD AND BOENTE (STATE HIGHWAY 108 in CARROLLTON, IL)
STATE MASTER (Illinois EPA Project) - AIR PROGRAM AIR MINOR (AIRS/AFS) Business SIC classification: PETROLEUM BULK STATIONS AND TERMINALS
ILLINOIS DEPT OF TRANSPORTATION (RR3 in CARROLLTON, IL)
STATE MASTER (Illinois EPA Project) - AIR PROGRAM AIR MINOR (AIRS/AFS) Business SIC classification: NONCLASSIFIABLE ESTABLISHMENTS
IL AG CLEAN SWEEP GRECALJERSEY (RTE 108E in CARROLLTON, IL)
STATE MASTER (Illinois EPA Project) - SOLID WASTE PROGRAM, HAZARDOUS WASTE PROGRAM Small Quantity Generators, between 100 kg and 1000 kg of hazardous waste/month (Resource Conservation and Recovery Act (tracking hazardous waste)) - notification Organizations: ILLINOIS DEPT OF AGRICULTURE (CONTACT/OWNER)
ILDOT (ILL 108 W OF CARROLLTON in CARROLLTON, IL)
Conditionally Exempt Small Quantity Generators, less than 100 kg/month of hazardous waste (Resource Conservation and Recovery Act (tracking hazardous waste)) - notification Organizations: ILL DEPT OF TRANSPORATION (CONTACT/OWNER)
ILDOT BRG 031 0022 (IL RTE 267 OVER MACOUPIN in CARROLLTON, IL)
Small Quantity Generators, between 100 kg and 1000 kg of hazardous waste/month (Resource Conservation and Recovery Act (tracking hazardous waste)) - notification
ILDOT BRG 042 0017 (US 67 OVER MACOUPIN CREEK in CARROLLTON, IL)
Small Quantity Generators, between 100 kg and 1000 kg of hazardous waste/month (Resource Conservation and Recovery Act (tracking hazardous waste)) - notification Organizations: IL DOT (CONTACT/OWNER)
ILLINOIS VALLEY SUPPLY L L C (80 N. MAIN in CARROLLTON, IL)
ENFORCEMENT/COMPLIANCE ACTIVITY (Integrated Compliance Information System)
Housing units lacking complete plumbing facilities: 5.2% Housing units lacking complete kitchen facilities: 3.9%
42.2%Utility gas
28.6%Electricity
25.9%Bottled, tank, or LP gas
1.9%Other fuel
1.2%Wood
Population in 1990: 3,079. Population change in the 1990s: +922 (+29.9%).
Place of birth for U.S.-born residents:
This state: 2,919
Northeast: 6
Midwest: 276
South: 100
West: 111
62% of the 62016 zip code residents lived in the same house 5 years ago. Out of people who lived in different houses, 60% lived in this county. Out of people who lived in different counties, 50% lived in Illinois.
90% of the 62016 zip code residents lived in the same house 1 year ago. Out of people who lived in different houses, 49% moved from this county. Out of people who lived in different houses, 30% moved from different county within same state. Out of people who lived in different houses, 19% moved from different state. Out of people who lived in different houses, 3% moved from abroad.
Private vs. public school enrollment:
Students in private schools in grades 1 to 8 (elementary and middle school): 108
Here:
43.7%
Illinois:
13.3%
Students in private schools in grades 9 to 12 (high school):
Here:
0.0%
Illinois:
9.9%
Students in private undergraduate colleges: 16
Here:
26.1%
Illinois:
27.4%
Occupation by median earnings in the past 12 months ($)
174,167Legal occupations
90,286Installation, maintenance, and repair occupations
85,889Sales and related occupations
83,755Business and financial operations occupations
80,277Health diagnosing and treating practitioners and other technical occupations
59,519Transportation occupations
Top industries in this zip code by the number of employees in 2005:
Health Care and Social Assistance: General Medical and Surgical Hospitals (100-249 employees: 1 establishment)
Accommodation and Food Services: Full-Service Restaurants (20-49: 2, 10-19: 2)
Accommodation and Food Services: Limited-Service Restaurants (20-49: 2, 10-19: 1)
Finance and Insurance: Commercial Banking (20-49: 1, 10-19: 1)
Wholesale Trade: Other Grocery and Related Products Merchant Wholesalers (10-19: 2, 1-4: 3)
Other Services (except Public Administration): Religious Organizations (10-19: 1, 5-9: 1, 1-4: 4)
People in group quarters in 2010:
10 people in local jails and other municipal confinement facilities
4 people in nursing facilities/skilled-nursing facilities
People in group quarters in 2000:
62 people in nursing homes
4 people in local jails and other confinement facilities (including police lockups)
Fatal accident statistics in 2014:
Fatal accident count: 1
Vehicles involved in fatal accidents: 1
Fatal accidents caused by drunken drivers: 1
Fatalities: 1
Persons involved in fatal accidents: 1
Pedestrians involved in fatal accidents: 0
Fatal accident statistics in 2013:
Fatal accident count: 1
Vehicles involved in fatal accidents: 1
Fatal accidents caused by drunken drivers: 1
Fatalities: 1
Persons involved in fatal accidents: 2
Pedestrians involved in fatal accidents: 0
2002 - 2018 National Fire Incident Reporting System (NFIRS) incidents
Based on the data from the years 2002 - 2018 the average number of fires per year is 12. The highest number of reported fire incidents - 21 took place in 2007, and the least - 4 in 2005. The data has a decreasing trend.
When looking into fire subcategories, the most incidents belonged to: Outside Fires (39.6%), and Structure Fires (33.0%).
Fire incident types reported to NFIRS in Zip Code 62016


 Nearest zip codes: 62092, 62054, 62027, 62098, 62050, 62078.


 Based on the data from the years 2002 - 2018 the average number of fires per year is 12. The highest number of reported fire incidents - 21 took place in 2007, and the least - 4 in 2005. The data has a decreasing trend.
 When looking into fire subcategories, the most incidents belonged to: Outside Fires (39.6%), and Structure Fires (33.0%).