Estimated zip code population in 2022: 802 Zip code population in 2010: 896 Zip code population in 2000: 967
Houses and condos: 418 Renter-occupied apartments: 48
% of renters here:
14%
State:
33%
March 2022 cost of living index in zip code 62378: 83.8 (less than average, U.S. average is 100)
Land area: 67.1 sq. mi. Water area: 1.4 sq. mi.
Population density: 12 people per square mile
(very low).
OSM Map
General Map
Google Map
MSN Map
OSM Map
General Map
Google Map
MSN Map
OSM Map
General Map
Google Map
MSN Map
OSM Map
General Map
Google Map
MSN Map
Please wait while loading the map...
Real estate property taxes paid for housing units in 2022:
This zip code:
1.4% ($1,909)
Illinois:
2.0% ($4,912)
Median real estate property taxes paid for housing units with mortgages in 2022: $2,375 (1.7%) Median real estate property taxes paid for housing units with no mortgage in 2022: $1,544 (1.6%)
Business Search- 14 Million verified businesses
Males: 294
(36.6%)
Females: 508
(63.4%)
For population 25 years and over in 62378:
High school or higher: 95.3%
Bachelor's degree or higher: 13.0%
Graduate or professional degree: 0.8%
Unemployed: 2.9%
Mean travel time to work (commute): 22.6 minutes
For population 15 years and over in 62378:
Never married: 18.7%
Now married: 60.7%
Separated: 0.0%
Widowed: 13.0%
Divorced: 7.6%
Zip code 62378 compared to state average:
Median house value below state average.
Black race population percentage significantly below state average.
Hispanic race population percentage significantly below state average.
Foreign-born population percentage significantly below state average.
Renting percentage significantly below state average.
Length of stay since moving in significantly above state average.
Number of college students below state average.
Percentage of population with a bachelor's degree or higher significantly below state average.
Estimated median house/condo value in 2022: $135,428
62378:
$135,428
Illinois:
$251,600
Median resident age:
This zip code:
39.2 years
Illinois median age:
39.1 years
Average household size:
This zip code:
2.4 people
Illinois:
2.4 people
Averages for the 2020 tax year for zip code 62378, filed in 2021:
Average Adjusted Gross Income (AGI) in 2020: $52,367 (Individual Income Tax Returns)
Here:
$52,367
State:
$82,626
Salary/wage: $44,140 (reported on 76.9% of returns)
Here:
$44,140
State:
$66,640
(% of AGI for various income ranges: 1167.1% for AGIs below $25k, 3434.3% for AGIs $25k-50k, 5580.0% for AGIs $50k-75k, 8776.7% for AGIs $75k-100k, 15326.7% for AGIs $100k-200k)
Taxable interest for individuals: $394 (reported on 41.0% of returns)
This zip code:
$394
Illinois:
$2,376
(% of AGI for various income ranges: 11.4% for AGIs below $25k, 18.6% for AGIs $25k-50k, 36.0% for AGIs $50k-75k, 20.0% for AGIs $75k-100k, 60.0% for AGIs $100k-200k)
Ordinary dividends: $780 (reported on 12.8% of returns)
Here:
$780
State:
$9,061
(% of AGI for various income ranges: 41.4% for AGIs below $25k, 33.3% for AGIs $75k-100k)
Net capital gain/loss in AGI: +$6,150 (reported on 10.3% of returns)
Here:
+$6,150
State:
+$31,684
(% of AGI for various income ranges: 35.7% for AGIs below $25k, 736.7% for AGIs $75k-100k)
Profit/loss from business: +$6,400 (reported on 10.3% of returns)
Here:
+$6,400
State:
+$12,175
(% of AGI for various income ranges: 365.7% for AGIs $25k-50k)
Taxable individual retirement arrangement distribution: $8,525 (reported on 10.3% of returns)
62378:
$8,525
Illinois:
$21,613
(% of AGI for various income ranges: 682.0% for AGIs $50k-75k)
Earned income credit: $1,960 (reported on 12.8% of returns)
Here:
$1,960
State:
$2,311
(% of AGI for various income ranges: 64.3% for AGIs below $25k, 75.7% for AGIs $25k-50k)
Percentage of individuals using paid preparers for their 2020 taxes: 94.9%
Here:
95%
State:
93%
(% for various income ranges: 91.7% for AGIs below $25k, 100.0% for AGIs $25k-50k, 100.0% for AGIs $50k-75k, 80.0% for AGIs $75k-100k, 100.0% for AGIs $100k-200k)
Averages for the 2012 tax year for zip code 62378, filed in 2013:
Average Adjusted Gross Income (AGI) in 2012: $47,030 (Individual Income Tax Returns)
Here:
$47,030
State:
$68,058
Salary/wage: $42,860 (reported on 79.5% of returns)
Here:
$42,860
State:
$55,396
(% of AGI for various income ranges: 69.9% for AGIs below $25k, 75.1% for AGIs $25k-50k, 83.0% for AGIs $50k-75k, 77.2% for AGIs $75k-100k, 60.6% for AGIs $100k-200k)
Taxable interest for individuals: $600 (reported on 38.6% of returns)
This zip code:
$600
Illinois:
$1,969
(% of AGI for various income ranges: 1.5% for AGIs below $25k, 0.6% for AGIs $25k-50k, 0.2% for AGIs $50k-75k, 0.3% for AGIs $75k-100k, 0.3% for AGIs $100k-200k)
Ordinary dividends: $375 (reported on 9.1% of returns)
Here:
$375
State:
$7,786
Net capital gain/loss in AGI: +$133 (reported on 6.8% of returns)
Here:
+$133
State:
+$22,183
Profit/loss from business: +$3,660 (reported on 11.4% of returns)
Here:
+$3,660
State:
+$12,903
Taxable individual retirement arrangement distribution: $7,800 (reported on 11.4% of returns)
62378:
$7,800
Illinois:
$17,929
Total itemized deductions: $17,700 (18% of AGI, reported on 18.2% of returns)
Here:
$17,700
State:
$26,433
Here:
18.3% of AGI
State:
19.2% of AGI
(% of AGI for various income ranges: 12.6% for AGIs below $25k, 9.2% for AGIs $50k-75k, 17.9% for AGIs $75k-100k)
Charity contributions: $2,080 (reported on 11.4% of returns)
Here:
$2,080
State:
$4,525
Taxes paid: $6,000 (reported on 18.2% of returns)
62378:
$6,000
State:
$11,968
(% of AGI for various income ranges: 2.5% for AGIs below $25k, 2.7% for AGIs $50k-75k, 7.4% for AGIs $75k-100k)
Earned income credit: $2,450 (reported on 13.6% of returns)
Here:
$2,450
State:
$2,349
(% of AGI for various income ranges: 4.8% for AGIs below $25k, 1.0% for AGIs $25k-50k)
Percentage of individuals using paid preparers for their 2012 taxes: 72.7%
Here:
73%
State:
57%
(% for various income ranges: 64.7% for AGIs below $25k, 75.0% for AGIs $25k-50k, 71.4% for AGIs $50k-75k, 80.0% for AGIs $75k-100k, 100.0% for AGIs $100k-200k)
Averages for the 2004 tax year for zip code 62378, filed in 2005:
Average Adjusted Gross Income (AGI) in 2004: $35,497 (Individual Income Tax Returns)
Here:
$35,497
State:
$54,625
Salary/wage: $32,270 (reported on 82.9% of returns)
Here:
$32,270
State:
$46,811
(% of AGI for various income ranges: 100.6% for AGIs below $10k, 70.9% for AGIs $10k-25k, 76.7% for AGIs $25k-50k, 80.5% for AGIs $50k-75k, 78.4% for AGIs $75k-100k, 54.1% for AGIs over 100k)
Taxable interest for individuals: $1,129 (reported on 46.7% of returns)
This zip code:
$1,129
Illinois:
$2,101
(% of AGI for various income ranges: 3.0% for AGIs below $10k, 4.2% for AGIs $10k-25k, 0.9% for AGIs $25k-50k, 1.0% for AGIs $50k-75k, 0.2% for AGIs $75k-100k, 2.9% for AGIs over 100k)
Taxable dividends: $441 (reported on 13.6% of returns)
Here:
$441
State:
$4,306
(% of AGI for various income ranges: 0.2% for AGIs $10k-25k, 0.3% for AGIs $25k-50k, 0.2% for AGIs $50k-75k, 0.1% for AGIs $75k-100k)
Net capital gain/loss: +$4,846 (reported on 9.0% of returns)
Here:
+$4,846
State:
+$17,321
Profit/loss from business: +$2,229 (reported on 11.1% of returns)
Here:
+$2,229
State:
+$11,771
(% of AGI for various income ranges: 7.6% for AGIs below $10k, 0.9% for AGIs $10k-25k, 1.3% for AGIs $50k-75k)
Total itemized deductions: $13,685 (23% of AGI, reported on 12.5% of returns)
Here:
$13,685
State:
$20,239
Here:
23.2% of AGI
State:
19.5% of AGI
Charity contributions deductions: $1,758 (3% of AGI, reported on 7.6% of returns)
Here:
$1,758
State:
$3,719
Here:
3.2% of AGI
State:
3.4% of AGI
Total tax: $4,373 (reported on 72.5% of returns)
62378:
$4,373
State:
$9,882
(% of AGI for various income ranges: 3.6% for AGIs below $10k, 3.5% for AGIs $10k-25k, 6.7% for AGIs $25k-50k, 9.4% for AGIs $50k-75k, 10.8% for AGIs $75k-100k, 15.6% for AGIs over 100k)
Earned income credit: $1,456 (reported on 13.2% of returns)
Here:
$1,456
State:
$1,788
Percentage of individuals using paid preparers for their 2004 taxes: 75.8%
Here:
76%
State:
61%
(% for various income ranges: 61.3% for AGIs below $10k, 79.8% for AGIs $10k-25k, 73.7% for AGIs $25k-50k, 83.3% for AGIs $50k-75k, 93.5% for AGIs $75k-100k, 85.7% for AGIs over 100k)
Likely homosexual households (counted as self-reported same-sex unmarried-partner households)
Lesbian couples: 5.5% of all households
Gay men: 0.0% of all households
Household received Food Stamps/SNAP in the past 12 months: 60 Household did not receive Food Stamps/SNAP in the past 12 months: 273
Women who had a birth in the past 12 months: 1 (0 now married, 1 unmarried) Women who did not have a birth in the past 12 months: 243 (143 now married, 98 unmarried)
Housing units in zip code 62378 with a mortgage: 177 (7 second mortgage, 5 both second mortgage and home equity loan) Median monthly owner costs for units with a mortgage: $1,062 Median monthly owner costs for units without a mortgage: $508
Residents with income below the poverty level in 2022:
This zip code:
11.9%
Whole state:
11.9%
Residents with income below 50% of the poverty level in 2022:
This zip code:
10.0%
Whole state:
5.7%
Median number of rooms in houses and condos:
Here:
6.5
State:
6.4
Median number of rooms in apartments:
Here:
4.7
State:
4.1
Notable locations in this zip code not listed on our city pages
Notable locations in zip code 62378: Perry Springs Station (A), Reich Landing (B), Versailles Fire Protection District (C). Display/hide their locations on the map
Cemeteries: Casteen Cemetery (1), Elias Clark Cemetery (2), Hall Cemetery (3), Hambaugh Cemetery (4), Hebron Cemetery (5), Hulett Cemetery (6), Logsdon Number 2 Cemetery (7). Display/hide their locations on the map
Lakes and reservoirs: Big Lake (A), La Grange Pool (B), Hambaugh-Martin Number 3 Reservoir (C), Hambaugh-Martin Number 1 Reservoir (D), Dixon Pond (E), Alsup Farm Pond (F), Hambaugh-Martin Number Two Reservoir (G), Hambaugh-Martin Number Five Reservoir (H). Display/hide their locations on the map
Streams, rivers, and creeks: Camp Creek (A), Baehr Branch (B), Avery Branch (C), Martin Branch (D), Russett Branch (E), Little Creek (F), Leineke Branch (G), La Moine River (H). Display/hide their locations on the map
Size of family households: 118 2-persons, 34 3-persons, 25 4-persons, 20 6-persons, 5 7-or-more-persons
Size of nonfamily households: 100 1-person, 30 2-persons
211 married couples with children.
8 single-parent households (8 women).
95.9% of residents of 62378 zip code speak English at home.
1.9% of residents speak Spanish at home (100% very well).
1.4% of residents speak other Indo-European language at home (100% very well).
Foreign born population: 4 (0.5%) (100.0% of them are naturalized citizens)
This zip code:
0.5%
Whole state:
14.4%
49%German
18%American
8%English
2%Ghanaian
2%British
1%Albanian
1%European
Year of entry for the foreign-born population
02010 or later
02000 to 2009
31990 to 1999
0Before 1990
Facilities with environmental interests located in this zip code:
JOSEPH W REICH (RR # 1 in VERSAILLES, IL)
STATE MASTER (Illinois EPA Project) - National Pollutant Discharge Elimination System Permit National Pollutant Discharge Elimination System NON-MAJOR (Tracking pollutant discharge elimination systems) - permit Organizations: REICH TRUCKING, INC.?JOHN (CONTACT/OWNER)
Alternative names: REICH, JOSEPH W., REICH?JOSEPH W.
JUDYS DINNER (RTE 99 in VERSAILLES, IL)
Small Quantity Generators, between 100 kg and 1000 kg of hazardous waste/month (Resource Conservation and Recovery Act (tracking hazardous waste)) - notification Organizations: NAPP MICHAEL C (CONTACT/OWNER)
Housing units lacking complete plumbing facilities: 2.7% Housing units lacking complete kitchen facilities: 1.6%
41.5%Utility gas
31.4%Electricity
24.6%Bottled, tank, or LP gas
3.1%Other fuel
Population in 1990: 1,136.
Place of birth for U.S.-born residents:
This state: 650
Midwest: 56
South: 23
West: 66
67% of the 62378 zip code residents lived in the same house 5 years ago. Out of people who lived in different houses, 55% lived in this county. Out of people who lived in different counties, 50% lived in Illinois.
98% of the 62378 zip code residents lived in the same house 1 year ago. Out of people who lived in different houses, 92% moved from this county.
Private vs. public school enrollment:
Students in private schools in grades 1 to 8 (elementary and middle school): 56
Here:
48.0%
Illinois:
13.3%
Students in private schools in grades 9 to 12 (high school):
Here:
0.0%
Illinois:
9.9%
Students in private undergraduate colleges: 17
Here:
100.0%
Illinois:
27.4%
Occupation by median earnings in the past 12 months ($)
156,476Management occupations
97,319Installation, maintenance, and repair occupations
75,798Construction and extraction occupations
55,175Production occupations
54,916Material moving occupations
52,665Personal care and service occupations
Top industries in this zip code by the number of employees in 2005:
Other Services (except Public Administration): Automotive Body, Paint, and Interior Repair and Maintenance (1-4 employees: 1 establishment)
Finance and Insurance: Insurance Agencies and Brokerages (1-4: 1)
Other Services (except Public Administration): Religious Organizations (1-4: 1)
Professional, Scientific, and Technical Services: Photography Studios, Portrait (1-4: 1)
Finance and Insurance: Commercial Banking (1-4: 1)
Fatal accident statistics in 2013:
Fatal accident count: 1
Vehicles involved in fatal accidents: 1
Fatal accidents caused by drunken drivers: 0
Fatalities: 1
Persons involved in fatal accidents: 1
Pedestrians involved in fatal accidents: 0
2002 - 2018 National Fire Incident Reporting System (NFIRS) incidents
According to the data from the years 2002 - 2018 the average number of fires per year is 6. The highest number of reported fire incidents - 14 took place in 2009, and the least - 1 in 2004. The data has a dropping trend.
When looking into fire subcategories, the most incidents belonged to: Outside Fires (54.6%), and Structure Fires (22.2%).
Fire incident types reported to NFIRS in Zip Code 62378

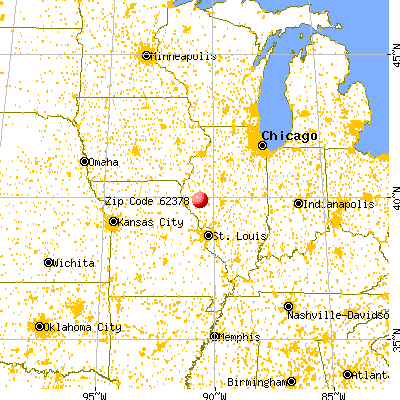


 Nearest zip codes: 62323, 62353, 62665, 62362, 62340, 62639.


 According to the data from the years 2002 - 2018 the average number of fires per year is 6. The highest number of reported fire incidents - 14 took place in 2009, and the least - 1 in 2004. The data has a dropping trend.
 When looking into fire subcategories, the most incidents belonged to: Outside Fires (54.6%), and Structure Fires (22.2%).