Estimated zip code population in 2022: 1,621 Zip code population in 2010: 1,886 Zip code population in 2000: 1,639
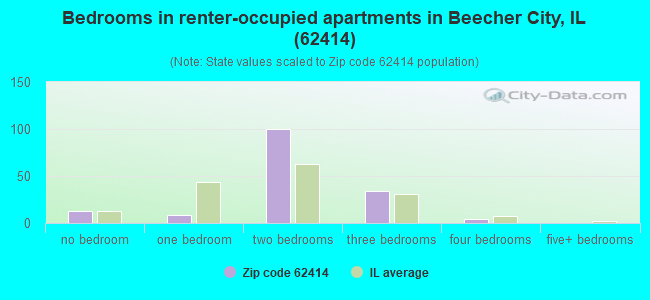
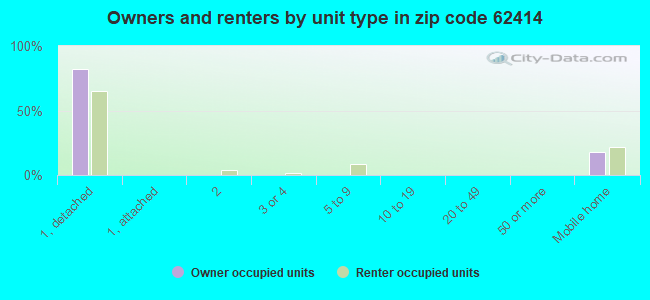
Houses and condos: 781 Renter-occupied apartments: 159
% of renters here:
22%
State:
33%
March 2022 cost of living index in zip code 62414: 84.4 (less than average, U.S. average is 100)
Land area: 73.9 sq. mi. Water area: 0.0 sq. mi.
Population density: 22 people per square mile
(very low).
OSM Map
General Map
Google Map
MSN Map
OSM Map
General Map
Google Map
MSN Map
OSM Map
General Map
Google Map
MSN Map
OSM Map
General Map
Google Map
MSN Map
Please wait while loading the map...
Real estate property taxes paid for housing units in 2022:
This zip code:
1.4% ($1,728)
Illinois:
2.0% ($4,912)
Median real estate property taxes paid for housing units with mortgages in 2022: $1,462 (1.3%) Median real estate property taxes paid for housing units with no mortgage in 2022: $2,024 (1.4%)
Averages for the 2020 tax year for zip code 62414, filed in 2021:
Average Adjusted Gross Income (AGI) in 2020: $51,986 (Individual Income Tax Returns)
Here:
$51,986
State:
$82,626
Salary/wage: $44,361 (reported on 80.5% of returns)
Here:
$44,361
State:
$66,640
(% of AGI for various income ranges: 1280.0% for AGIs below $25k, 3581.6% for AGIs $25k-50k, 7138.9% for AGIs $50k-75k, 9748.3% for AGIs $75k-100k, 16116.7% for AGIs $100k-200k)
Taxable interest for individuals: $811 (reported on 42.5% of returns)
This zip code:
$811
Illinois:
$2,376
(% of AGI for various income ranges: 35.0% for AGIs below $25k, 52.1% for AGIs $25k-50k, 45.6% for AGIs $50k-75k, 55.0% for AGIs $75k-100k, 106.7% for AGIs $100k-200k)
Ordinary dividends: $2,350 (reported on 13.8% of returns)
Here:
$2,350
State:
$9,061
(% of AGI for various income ranges: 20.0% for AGIs below $25k, 46.8% for AGIs $25k-50k, 82.2% for AGIs $50k-75k, 138.3% for AGIs $100k-200k)
Net capital gain/loss in AGI: +$4,143 (reported on 16.1% of returns)
Here:
+$4,143
State:
+$31,684
(% of AGI for various income ranges: 1.7% for AGIs below $25k, 84.7% for AGIs $25k-50k, 151.7% for AGIs $75k-100k, 541.7% for AGIs $100k-200k)
Profit/loss from business: +$5,438 (reported on 14.9% of returns)
Here:
+$5,438
State:
+$12,175
(% of AGI for various income ranges: 144.4% for AGIs below $25k, 38.4% for AGIs $25k-50k, 61.1% for AGIs $50k-75k, 531.7% for AGIs $100k-200k)
Taxable individual retirement arrangement distribution: $12,371 (reported on 8.0% of returns)
62414:
$12,371
Illinois:
$21,613
(% of AGI for various income ranges: 212.1% for AGIs $25k-50k, 771.7% for AGIs $75k-100k)
Total itemized deductions: $45,700 (reported on 2.3% of returns)
Here:
$45,700
State:
$34,948
(% of AGI for various income ranges: 481.1% for AGIs $25k-50k)
Taxes paid: $7,100 (reported on 2.3% of returns)
62414:
$7,100
State:
$8,563
(% of AGI for various income ranges: 74.7% for AGIs $25k-50k)
Earned income credit: $2,043 (reported on 16.1% of returns)
Here:
$2,043
State:
$2,311
(% of AGI for various income ranges: 90.0% for AGIs below $25k, 65.3% for AGIs $25k-50k)
Percentage of individuals using paid preparers for their 2020 taxes: 95.4%
Here:
95%
State:
93%
(% for various income ranges: 92.9% for AGIs below $25k, 96.2% for AGIs $25k-50k, 100.0% for AGIs $50k-75k, 100.0% for AGIs $75k-100k, 90.9% for AGIs $100k-200k)
Averages for the 2012 tax year for zip code 62414, filed in 2013:
Average Adjusted Gross Income (AGI) in 2012: $40,780 (Individual Income Tax Returns)
Here:
$40,780
State:
$68,058
Salary/wage: $33,526 (reported on 81.8% of returns)
Here:
$33,526
State:
$55,396
(% of AGI for various income ranges: 76.5% for AGIs below $25k, 75.5% for AGIs $25k-50k, 76.7% for AGIs $50k-75k, 72.3% for AGIs $75k-100k, 41.9% for AGIs $100k-200k)
Taxable interest for individuals: $992 (reported on 44.3% of returns)
This zip code:
$992
Illinois:
$1,969
(% of AGI for various income ranges: 1.7% for AGIs below $25k, 1.2% for AGIs $25k-50k, 0.6% for AGIs $50k-75k, 1.6% for AGIs $75k-100k, 0.7% for AGIs $100k-200k)
Ordinary dividends: $1,108 (reported on 13.6% of returns)
Here:
$1,108
State:
$7,786
(% of AGI for various income ranges: 0.4% for AGIs below $25k, 0.4% for AGIs $25k-50k, 0.6% for AGIs $50k-75k, 0.4% for AGIs $100k-200k)
Net capital gain/loss in AGI: +$9,556 (reported on 10.2% of returns)
Here:
+$9,556
State:
+$22,183
(% of AGI for various income ranges: 0.4% for AGIs $25k-50k, 5.4% for AGIs $75k-100k, 5.6% for AGIs $100k-200k)
Profit/loss from business: +$4,769 (reported on 14.8% of returns)
Here:
+$4,769
State:
+$12,903
(% of AGI for various income ranges: 5.0% for AGIs below $25k, 2.4% for AGIs $25k-50k, 1.7% for AGIs $50k-75k, 0.8% for AGIs $75k-100k)
Taxable individual retirement arrangement distribution: $6,143 (reported on 8.0% of returns)
62414:
$6,143
Illinois:
$17,929
Total itemized deductions: $17,473 (20% of AGI, reported on 17.0% of returns)
Here:
$17,473
State:
$26,433
Here:
20.4% of AGI
State:
19.2% of AGI
(% of AGI for various income ranges: 7.3% for AGIs below $25k, 4.4% for AGIs $25k-50k, 6.5% for AGIs $50k-75k, 9.7% for AGIs $75k-100k, 9.0% for AGIs $100k-200k)
Charity contributions: $3,500 (reported on 10.2% of returns)
Here:
$3,500
State:
$4,525
(% of AGI for various income ranges: 1.2% for AGIs $25k-50k, 1.2% for AGIs $75k-100k, 1.6% for AGIs $100k-200k)
Taxes paid: $5,867 (reported on 17.0% of returns)
62414:
$5,867
State:
$11,968
(% of AGI for various income ranges: 0.7% for AGIs below $25k, 1.2% for AGIs $25k-50k, 2.0% for AGIs $50k-75k, 3.1% for AGIs $75k-100k, 4.6% for AGIs $100k-200k)
Earned income credit: $2,128 (reported on 20.5% of returns)
Here:
$2,128
State:
$2,349
(% of AGI for various income ranges: 5.9% for AGIs below $25k, 1.2% for AGIs $25k-50k)
Percentage of individuals using paid preparers for their 2012 taxes: 73.9%
Here:
74%
State:
57%
(% for various income ranges: 66.7% for AGIs below $25k, 78.3% for AGIs $25k-50k, 76.9% for AGIs $50k-75k, 85.7% for AGIs $75k-100k, 83.3% for AGIs $100k-200k)
Averages for the 2004 tax year for zip code 62414, filed in 2005:
Average Adjusted Gross Income (AGI) in 2004: $29,660 (Individual Income Tax Returns)
Here:
$29,660
State:
$54,625
Salary/wage: $27,045 (reported on 84.1% of returns)
Here:
$27,045
State:
$46,811
(% of AGI for various income ranges: 92.7% for AGIs below $10k, 76.2% for AGIs $10k-25k, 82.5% for AGIs $25k-50k, 81.1% for AGIs $50k-75k, 75.1% for AGIs $75k-100k, 37.5% for AGIs over 100k)
Taxable interest for individuals: $1,035 (reported on 46.6% of returns)
This zip code:
$1,035
Illinois:
$2,101
(% of AGI for various income ranges: 8.7% for AGIs below $10k, 2.9% for AGIs $10k-25k, 0.9% for AGIs $25k-50k, 1.5% for AGIs $50k-75k, 0.5% for AGIs $75k-100k, 0.9% for AGIs over 100k)
Taxable dividends: $911 (reported on 14.3% of returns)
Here:
$911
State:
$4,306
(% of AGI for various income ranges: 1.1% for AGIs below $10k, 0.8% for AGIs $10k-25k, 0.2% for AGIs $25k-50k, 0.5% for AGIs $50k-75k, 0.5% for AGIs $75k-100k)
Net capital gain/loss: +$817 (reported on 12.0% of returns)
Here:
+$817
State:
+$17,321
(% of AGI for various income ranges: 0.6% for AGIs below $10k, 0.4% for AGIs $10k-25k, -0.2% for AGIs $25k-50k, 0.7% for AGIs $50k-75k, 1.0% for AGIs $75k-100k)
Profit/loss from business: +$4,259 (reported on 16.5% of returns)
Here:
+$4,259
State:
+$11,771
(% of AGI for various income ranges: 10.9% for AGIs below $10k, 1.6% for AGIs $10k-25k, 3.2% for AGIs $25k-50k, 1.3% for AGIs $50k-75k, 3.1% for AGIs $75k-100k)
IRA payment deduction: $2,000 (reported on 1.2% of returns)
62414:
$2,000
Illinois:
$3,087
Total itemized deductions: $14,303 (25% of AGI, reported on 11.4% of returns)
Here:
$14,303
State:
$20,239
Here:
24.5% of AGI
State:
19.5% of AGI
(% of AGI for various income ranges: 3.3% for AGIs $10k-25k, 5.5% for AGIs $25k-50k, 6.7% for AGIs $50k-75k, 11.1% for AGIs $75k-100k)
Charity contributions deductions: $2,772 (4% of AGI, reported on 6.6% of returns)
Here:
$2,772
State:
$3,719
Here:
4.4% of AGI
State:
3.4% of AGI
Total tax: $3,314 (reported on 68.4% of returns)
62414:
$3,314
State:
$9,882
(% of AGI for various income ranges: 3.3% for AGIs below $10k, 3.8% for AGIs $10k-25k, 5.2% for AGIs $25k-50k, 8.0% for AGIs $50k-75k, 11.3% for AGIs $75k-100k, 18.6% for AGIs over 100k)
Earned income credit: $1,617 (reported on 18.7% of returns)
Here:
$1,617
State:
$1,788
Percentage of individuals using paid preparers for their 2004 taxes: 75.5%
Here:
76%
State:
61%
(% for various income ranges: 70.0% for AGIs below $10k, 73.9% for AGIs $10k-25k, 75.6% for AGIs $25k-50k, 83.6% for AGIs $50k-75k, 83.8% for AGIs $75k-100k, 100.0% for AGIs over 100k)
Household received Food Stamps/SNAP in the past 12 months: 82 Household did not receive Food Stamps/SNAP in the past 12 months: 632
Women who had a birth in the past 12 months: 5 (2 now married, 2 unmarried) Women who did not have a birth in the past 12 months: 366 (135 now married, 231 unmarried)
Housing units in zip code 62414 with a mortgage: 221 (7 second mortgage, 4 both second mortgage and home equity loan) Median monthly owner costs for units with a mortgage: $1,056 Median monthly owner costs for units without a mortgage: $542
Residents with income below the poverty level in 2022:
This zip code:
11.5%
Whole state:
11.9%
Residents with income below 50% of the poverty level in 2022:
This zip code:
10.0%
Whole state:
5.7%
Median number of rooms in houses and condos:
Here:
6.3
State:
6.4
Median number of rooms in apartments:
Here:
4.9
State:
4.1
Notable locations in this zip code not listed on our city pages
Notable locations in zip code 62414: Carter Camp (A), Loudon Townhall (B), Tri - County Fire Station of Beecher City (C). Display/hide their locations on the map
Cemeteries: Spring Hill Cemetery (1), Rogers Cemetery (2), Rhodes Family Cemetery (3), Ranson Cemetery (4), Beecher Cemetery (5), Dial Cemetery (6), Hubbartt Cemetery (7). Display/hide their locations on the map
Streams, rivers, and creeks: Moccasin Creek (A), Cedar Creek (B), Cary Branch (C), Brush Creek (D), Bacon Branch (E), Riley Run (F), Richland Creek (G), Corwin Branch (H), Hog Creek (I). Display/hide their locations on the map
Size of family households: 186 2-persons, 103 3-persons, 81 4-persons, 35 5-persons, 8 6-persons
Size of nonfamily households: 260 1-person, 42 2-persons
234 married couples with children.
86 single-parent households (29 men, 57 women).
96.9% of residents of 62414 zip code speak English at home.
1.7% of residents speak Spanish at home (33% very well, 67% not well).
0.6% of residents speak other Indo-European language at home (44% very well, 56% not at all).
0.5% of residents speak other language at home (100% very well).
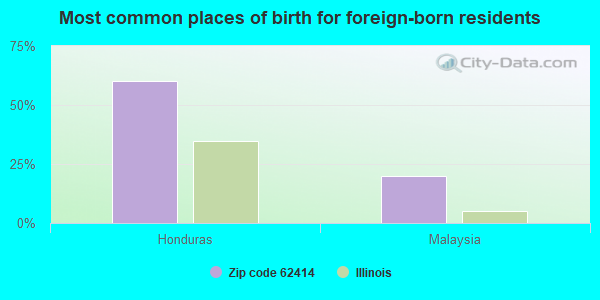
Foreign born population: 10 (0.6%) (70.2% of them are naturalized citizens)
This zip code:
0.6%
Whole state:
14.4%
60%Honduras
20%Malaysia
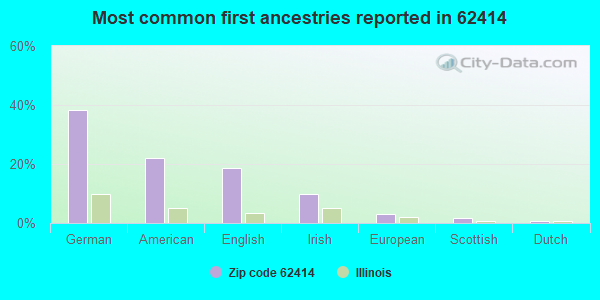
38%German
22%American
18%English
10%Irish
3%European
2%Scottish
1%Dutch
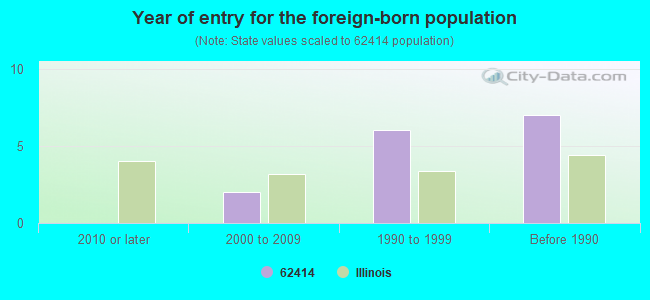
Year of entry for the foreign-born population
02010 or later
22000 to 2009
61990 to 1999
7Before 1990
Facilities with environmental interests located in this zip code:
OGLE GRAIN COMPANY INC (CORNER OF COMMERCIAL & MAIN ST in BEECHER CITY, IL)
STATE MASTER (Illinois EPA Project) - National Pollutant Discharge Elimination System Permit National Pollutant Discharge Elimination System NON-MAJOR (Tracking pollutant discharge elimination systems) - permit Organizations: OGLE GRAIN COMPANY, INC. (CONTACT/OWNER)
KAISER AGRICULTURAL CHEMICALS (N SIDE OF BEECHER CITY in BEECHER CITY, IL)
(Resource Conservation and Recovery Act (tracking hazardous waste))
CLOUGH OIL FIELD CONTRACTING S (RR #2 - 5 MI. SW OF BEECHER in BEECHER CITY, IL)
National Pollutant Discharge Elimination System NON-MAJOR (Tracking pollutant discharge elimination systems) - permit
GREENLAND BAPTIST ACADEMY (RR 2 in BEECHER CITY, IL)
COMPLIANCE ACTIVITY (Tracking inspections of insecticide, fungicide, and rodenticide, and toxic substances)
MILLER AG SUPPLY (307 NORTH CHARLES ST in BEECHER CITY, IL)
ENFORCEMENT/COMPLIANCE ACTIVITY (Integrated Compliance Information System) Alternative names: MILLER FERTILIZER & FEED
Housing units lacking complete plumbing facilities: 3.5% Housing units lacking complete kitchen facilities: 3.1%
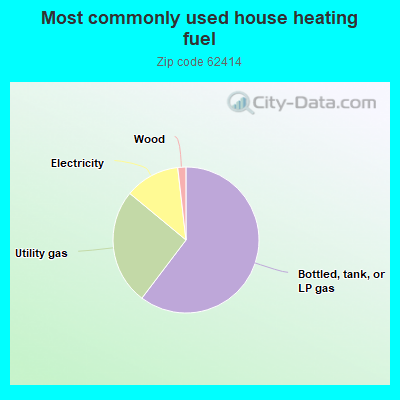
60.4%Bottled, tank, or LP gas
25.7%Utility gas
12.2%Electricity
1.8%Wood
Population in 1990: 1,968.
Place of birth for U.S.-born residents:
This state: 1,377
Northeast: 44
Midwest: 106
South: 56
West: 12
75% of the 62414 zip code residents lived in the same house 5 years ago. Out of people who lived in different houses, 36% lived in this county. Out of people who lived in different counties, 50% lived in Illinois.
94% of the 62414 zip code residents lived in the same house 1 year ago. Out of people who lived in different houses, 33% moved from this county. Out of people who lived in different houses, 64% moved from different county within same state. Out of people who lived in different houses, 6% moved from different state.
Private vs. public school enrollment:
Students in private schools in grades 1 to 8 (elementary and middle school): 12
Here:
7.5%
Illinois:
13.3%
Students in private schools in grades 9 to 12 (high school): 5
Here:
6.2%
Illinois:
9.9%
Students in private undergraduate colleges: 7
Here:
18.5%
Illinois:
27.4%
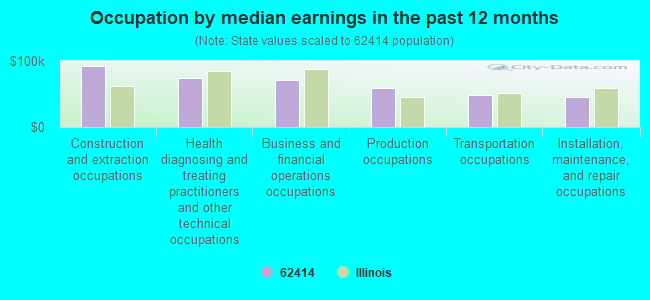
Occupation by median earnings in the past 12 months ($)
92,247Construction and extraction occupations
74,126Health diagnosing and treating practitioners and other technical occupations
70,814Business and financial operations occupations
58,362Production occupations
48,243Transportation occupations
46,205Installation, maintenance, and repair occupations
Top industries in this zip code by the number of employees in 2005:
Accommodation and Food Services: Limited-Service Restaurants (50-99 employees: 1 establishment)
Construction: All Other Specialty Trade Contractors (10-19: 1, 1-4: 1)
Administrative and Support and Waste Management and Remediation Services: Solid Waste Collection (10-19: 1)
Finance and Insurance: Commercial Banking (10-19: 1)
Health Care and Social Assistance: Child Day Care Services (5-9: 1)
Construction: Residential Remodelers (5-9: 1)
Other Services (except Public Administration): General Automotive Repair (1-4: 2)
Fatal accident statistics in 2014:
Fatal accident count: 1
Vehicles involved in fatal accidents: 2
Fatal accidents caused by drunken drivers: 0
Fatalities: 1
Persons involved in fatal accidents: 2
Pedestrians involved in fatal accidents: 0
Fatal accident statistics in 2013:
Fatal accident count: 1
Vehicles involved in fatal accidents: 2
Fatal accidents caused by drunken drivers: 0
Fatalities: 1
Persons involved in fatal accidents: 2
Pedestrians involved in fatal accidents: 0
2003 - 2018 National Fire Incident Reporting System (NFIRS) incidents
According to the data from the years 2003 - 2018 the average number of fires per year is 20. The highest number of reported fire incidents - 35 took place in 2010, and the least - 6 in 2005. The data has a growing trend.
When looking into fire subcategories, the most incidents belonged to: Outside Fires (53.1%), and Structure Fires (30.9%).
Fire incident types reported to NFIRS in Zip Code 62414


 Nearest zip codes: 62422, 62444, 62411, 62461, 62458, 62438.


 According to the data from the years 2003 - 2018 the average number of fires per year is 20. The highest number of reported fire incidents - 35 took place in 2010, and the least - 6 in 2005. The data has a growing trend.
 When looking into fire subcategories, the most incidents belonged to: Outside Fires (53.1%), and Structure Fires (30.9%).