Estimated zip code population in 2022: 1,134 Zip code population in 2010: 907 Zip code population in 2000: 1,127
Houses and condos: 423 Renter-occupied apartments: 28
% of renters here:
7%
State:
33%
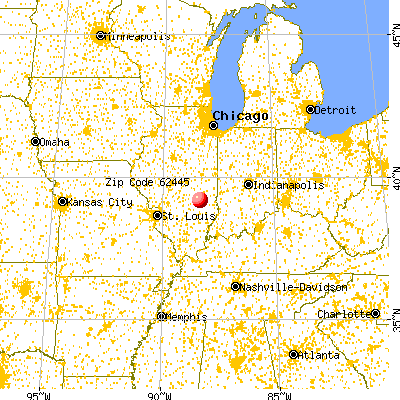
March 2022 cost of living index in zip code 62445: 83.4 (less than average, U.S. average is 100)
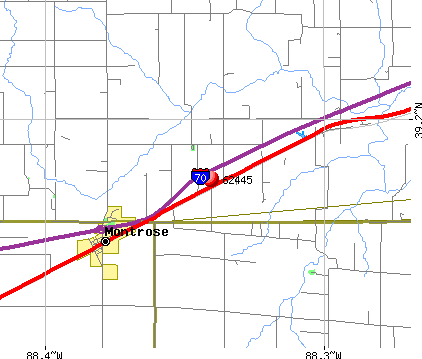
Land area: 47.1 sq. mi. Water area: 0.0 sq. mi.
Population density: 24 people per square mile
(very low).
OSM Map
General Map
Google Map
MSN Map
OSM Map
General Map
Google Map
MSN Map
OSM Map
General Map
Google Map
MSN Map
OSM Map
General Map
Google Map
MSN Map
Please wait while loading the map...
Real estate property taxes paid for housing units in 2022:
This zip code:
1.3% ($2,358)
Illinois:
2.0% ($4,912)
Median real estate property taxes paid for housing units with mortgages in 2022: $3,336 (1.2%) Median real estate property taxes paid for housing units with no mortgage in 2022: $1,906 (1.9%)
Business Search- 14 Million verified businesses
Males: 667
(58.9%)
Females: 466
(41.1%)
For population 25 years and over in 62445:
High school or higher: 94.5%
Bachelor's degree or higher: 11.8%
Graduate or professional degree: 1.5%
Unemployed: 0.4%
Mean travel time to work (commute): 35.9 minutes
For population 15 years and over in 62445:
Never married: 33.1%
Now married: 54.3%
Separated: 3.8%
Widowed: 4.2%
Divorced: 4.6%
Zip code 62445 compared to state average:
Unemployed percentage significantly below state average.
Black race population percentage significantly below state average.
Hispanic race population percentage significantly below state average.
Foreign-born population percentage significantly below state average.
Renting percentage significantly below state average.
Length of stay since moving in significantly above state average.
Percentage of population with a bachelor's degree or higher significantly below state average.
Averages for the 2020 tax year for zip code 62445, filed in 2021:
Average Adjusted Gross Income (AGI) in 2020: $64,309 (Individual Income Tax Returns)
Here:
$64,309
State:
$82,626
Salary/wage: $47,757 (reported on 84.1% of returns)
Here:
$47,757
State:
$66,640
(% of AGI for various income ranges: 1430.0% for AGIs below $25k, 3961.2% for AGIs $25k-50k, 5892.0% for AGIs $50k-75k, 9762.5% for AGIs $75k-100k, 22163.3% for AGIs $100k-200k)
Taxable interest for individuals: $862 (reported on 59.1% of returns)
This zip code:
$862
Illinois:
$2,376
(% of AGI for various income ranges: 31.4% for AGIs below $25k, 15.0% for AGIs $25k-50k, 148.0% for AGIs $50k-75k, 140.0% for AGIs $75k-100k, 200.0% for AGIs $100k-200k)
Ordinary dividends: $1,200 (reported on 22.7% of returns)
Here:
$1,200
State:
$9,061
(% of AGI for various income ranges: 34.3% for AGIs below $25k, 90.0% for AGIs $50k-75k, 170.0% for AGIs $100k-200k)
Net capital gain/loss in AGI: +$2,689 (reported on 20.5% of returns)
Here:
+$2,689
State:
+$31,684
(% of AGI for various income ranges: 28.6% for AGIs below $25k, 94.0% for AGIs $50k-75k, 583.3% for AGIs $100k-200k)
Profit/loss from business: +$10,960 (reported on 11.4% of returns)
Here:
+$10,960
State:
+$12,175
(% of AGI for various income ranges: 201.4% for AGIs below $25k, 814.0% for AGIs $50k-75k)
Taxable individual retirement arrangement distribution: $12,750 (reported on 9.1% of returns)
62445:
$12,750
Illinois:
$21,613
(% of AGI for various income ranges: 1020.0% for AGIs $50k-75k)
Earned income credit: $2,025 (reported on 9.1% of returns)
Here:
$2,025
State:
$2,311
(% of AGI for various income ranges: 115.7% for AGIs below $25k)
Percentage of individuals using paid preparers for their 2020 taxes: 97.7%
Here:
98%
State:
93%
(% for various income ranges: 100.0% for AGIs below $25k, 90.9% for AGIs $25k-50k, 100.0% for AGIs $50k-75k, 100.0% for AGIs $75k-100k, 100.0% for AGIs $100k-200k)
Averages for the 2012 tax year for zip code 62445, filed in 2013:
Average Adjusted Gross Income (AGI) in 2012: $48,411 (Individual Income Tax Returns)
Here:
$48,411
State:
$68,058
Salary/wage: $37,262 (reported on 84.1% of returns)
Here:
$37,262
State:
$55,396
(% of AGI for various income ranges: 71.4% for AGIs below $25k, 77.1% for AGIs $25k-50k, 82.0% for AGIs $50k-75k, 60.8% for AGIs $75k-100k, 42.8% for AGIs $100k-200k)
Taxable interest for individuals: $827 (reported on 50.0% of returns)
This zip code:
$827
Illinois:
$1,969
(% of AGI for various income ranges: 2.1% for AGIs below $25k, 0.8% for AGIs $25k-50k, 0.8% for AGIs $50k-75k, 0.9% for AGIs $75k-100k, 0.5% for AGIs $100k-200k)
Ordinary dividends: $990 (reported on 22.7% of returns)
Here:
$990
State:
$7,786
(% of AGI for various income ranges: 1.9% for AGIs below $25k, 0.3% for AGIs $50k-75k, 1.2% for AGIs $75k-100k)
Net capital gain/loss in AGI: +$157 (reported on 15.9% of returns)
Here:
+$157
State:
+$22,183
Profit/loss from business: +$10,460 (reported on 11.4% of returns)
Here:
+$10,460
State:
+$12,903
Taxable individual retirement arrangement distribution: $6,025 (reported on 9.1% of returns)
62445:
$6,025
Illinois:
$17,929
Total itemized deductions: $15,088 (19% of AGI, reported on 18.2% of returns)
Here:
$15,088
State:
$26,433
Here:
18.7% of AGI
State:
19.2% of AGI
Charity contributions: $2,017 (reported on 13.6% of returns)
Here:
$2,017
State:
$4,525
Taxes paid: $5,138 (reported on 18.2% of returns)
62445:
$5,138
State:
$11,968
Earned income credit: $1,980 (reported on 11.4% of returns)
Here:
$1,980
State:
$2,349
(% of AGI for various income ranges: 2.6% for AGIs below $25k, 1.3% for AGIs $25k-50k)
Percentage of individuals using paid preparers for their 2012 taxes: 77.3%
Here:
77%
State:
57%
(% for various income ranges: 75.0% for AGIs below $25k, 80.0% for AGIs $25k-50k, 77.8% for AGIs $50k-75k, 80.0% for AGIs $75k-100k, 75.0% for AGIs $100k-200k)
Averages for the 2004 tax year for zip code 62445, filed in 2005:
Average Adjusted Gross Income (AGI) in 2004: $32,724 (Individual Income Tax Returns)
Here:
$32,724
State:
$54,625
Salary/wage: $27,618 (reported on 87.6% of returns)
Here:
$27,618
State:
$46,811
(% of AGI for various income ranges: 110.2% for AGIs below $10k, 81.9% for AGIs $10k-25k, 73.8% for AGIs $25k-50k, 81.4% for AGIs $50k-75k, 66.8% for AGIs $75k-100k, 43.8% for AGIs over 100k)
Taxable interest for individuals: $1,082 (reported on 52.3% of returns)
This zip code:
$1,082
Illinois:
$2,101
(% of AGI for various income ranges: 10.9% for AGIs below $10k, 3.8% for AGIs $10k-25k, 1.4% for AGIs $25k-50k, 0.4% for AGIs $50k-75k, 2.0% for AGIs $75k-100k, 1.1% for AGIs over 100k)
Taxable dividends: $1,933 (reported on 23.5% of returns)
Here:
$1,933
State:
$4,306
(% of AGI for various income ranges: 1.2% for AGIs below $10k, 2.0% for AGIs $10k-25k, 1.4% for AGIs $25k-50k, 1.6% for AGIs $50k-75k, 1.3% for AGIs $75k-100k)
Net capital gain/loss: +$2,491 (reported on 12.4% of returns)
Here:
+$2,491
State:
+$17,321
Profit/loss from business: +$3,627 (reported on 15.2% of returns)
Here:
+$3,627
State:
+$11,771
Profit/loss from farming: +$6,035 (reported on 12.9% of returns)
Here:
+$6,035
State:
+$2,327
IRA payment deduction: $2,400 (reported on 2.3% of returns)
62445:
$2,400
Illinois:
$3,087
Total itemized deductions: $12,298 (25% of AGI, reported on 12.9% of returns)
Here:
$12,298
State:
$20,239
Here:
24.5% of AGI
State:
19.5% of AGI
Charity contributions deductions: $1,400 (2% of AGI, reported on 9.0% of returns)
Here:
$1,400
State:
$3,719
Here:
2.4% of AGI
State:
3.4% of AGI
Total tax: $3,550 (reported on 74.4% of returns)
62445:
$3,550
State:
$9,882
(% of AGI for various income ranges: 3.2% for AGIs below $10k, 4.5% for AGIs $10k-25k, 6.5% for AGIs $25k-50k, 7.4% for AGIs $50k-75k, 11.4% for AGIs $75k-100k, 16.8% for AGIs over 100k)
Earned income credit: $1,526 (reported on 12.9% of returns)
Here:
$1,526
State:
$1,788
Percentage of individuals using paid preparers for their 2004 taxes: 76.0%
Here:
76%
State:
61%
(% for various income ranges: 62.1% for AGIs below $10k, 75.2% for AGIs $10k-25k, 82.3% for AGIs $25k-50k, 83.8% for AGIs $50k-75k, 135.3% for AGIs $75k-100k)
Household received Food Stamps/SNAP in the past 12 months: 40 Household did not receive Food Stamps/SNAP in the past 12 months: 367
Women who had a birth in the past 12 months: 22 (22 now married, 0 unmarried) Women who did not have a birth in the past 12 months: 204 (95 now married, 109 unmarried)
Housing units in zip code 62445 with a mortgage: 174 (3 second mortgage, 4 both second mortgage and home equity loan) Median monthly owner costs for units with a mortgage: $1,544 Median monthly owner costs for units without a mortgage: $619
Residents with income below the poverty level in 2022:
This zip code:
11.7%
Whole state:
11.9%
Residents with income below 50% of the poverty level in 2022:
This zip code:
7.5%
Whole state:
5.7%
Median number of rooms in houses and condos:
Here:
6.1
State:
6.4
Median number of rooms in apartments:
Here:
4.9
State:
4.1
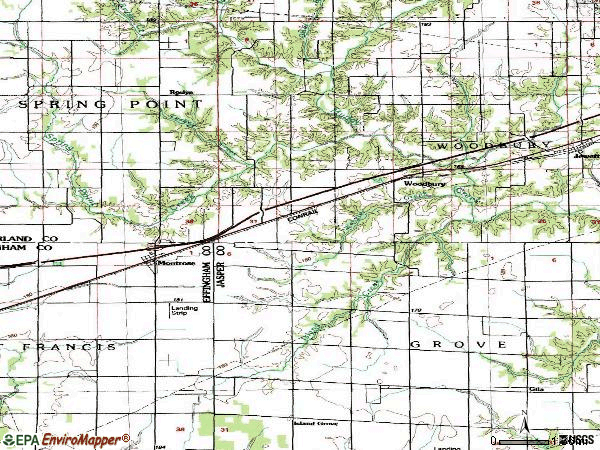
Notable locations in this zip code not listed on our city pages
Cemeteries: Island Creek Cemetery (1), Montrose Cemetery (2), Myer Cemetery (3), Mullen Cemetery (4), Kingery Cemetery (5), Faunce Cemetery (6), Saint Rose Cemetery (7). Display/hide their locations on the map
Size of family households: 93 2-persons, 73 3-persons, 56 4-persons, 38 5-persons, 15 7-or-more-persons
Size of nonfamily households: 116 1-person, 15 2-persons
217 married couples with children.
21 single-parent households (17 men, 4 women).
99.1% of residents of 62445 zip code speak English at home.
0.1% of residents speak other Indo-European language at home (100% well).
Foreign born population: 2 (0.2%) (50.2% of them are naturalized citizens)
This zip code:
0.2%
Whole state:
14.4%
50%France
53%German
25%American
3%English
2%Irish
1%Italian
1%Polish
Facilities with environmental interests located in this zip code:
MONTROSE STP (NORTH FA ROUTE 160 in MONTROSE, IL)
STATE MASTER (Illinois EPA Project) - National Pollutant Discharge Elimination System Permit National Pollutant Discharge Elimination System NON-MAJOR (Tracking pollutant discharge elimination systems) - permit National Pollutant Discharge Elimination System NON-MAJOR (Tracking pollutant discharge elimination systems) - permit Business SIC classification: SEWERAGE SYSTEMS Alternative names: MONTROSE STP, VILLAGE OF, MONTROSE, VILLAGE OF
GROVE ELEM SCHOOL (5251 E 1800TH AVE in MONTROSE, IL)
(National Center for Education Statistics) - STATE ID-1204000102005 Organizations: JASPER COUNTY COMM UNIT DIST 1 (SCHOOL DISTRICT)
ILDOT 018 0035 (TWP RD OVER I70 2MI E in MONTROSE, IL)
(Resource Conservation and Recovery Act (tracking hazardous waste))
MACKINNEY TRUCKING, INC. (BOX 96 in MONTROSE, IL)
National Pollutant Discharge Elimination System NON-MAJOR (Tracking pollutant discharge elimination systems) - permit Organizations: MCKINNEY TRUCKING, INC. (CONTACT/OWNER)
MONTROSE GRAIN & FEED (CORNER OF OLD RT. 40 & RT. 121 in MONTROSE, IL)
National Pollutant Discharge Elimination System NON-MAJOR (Tracking pollutant discharge elimination systems) - permit
GROVE CONSOLIDATED SCHOOL (RURAL ROUTE 1 in MONTROSE, IL)
National Pollutant Discharge Elimination System NON-MAJOR (Tracking pollutant discharge elimination systems) - permit Business SIC classification: ELEMENTARY AND SECONDARY SCHOOLS Alternative names: GROVE CONSOLIDATED SCHOOL STP
IDOT (BRIDGE 025-0016 in MONTROSE, IL)
Small Quantity Generators, between 100 kg and 1000 kg of hazardous waste/month (Resource Conservation and Recovery Act (tracking hazardous waste)) - notification
IDOT (BRIDGE 025-0017 in MONTROSE, IL)
Small Quantity Generators, between 100 kg and 1000 kg of hazardous waste/month (Resource Conservation and Recovery Act (tracking hazardous waste)) - notification
JOHNSON OIL CO #879 (309 N SPING CREEK RD in MONTROSE, IL)
Small Quantity Generators, between 100 kg and 1000 kg of hazardous waste/month (Resource Conservation and Recovery Act (tracking hazardous waste)) - notification Organizations: JOHNSON OIL COMPANY (CONTACT/OWNER)
Housing units lacking complete plumbing facilities: 1.7% Housing units lacking complete kitchen facilities: 0.2%
39.4%Bottled, tank, or LP gas
28.4%Electricity
19.7%Utility gas
8.0%Wood
2.5%Other fuel
2.2%Fuel oil, kerosene, etc.
Population in 1990: 1,611.
Place of birth for U.S.-born residents:
This state: 1,046
Northeast: 19
Midwest: 42
South: 8
West: 10
73% of the 62445 zip code residents lived in the same house 5 years ago. Out of people who lived in different houses, 33% lived in this county. Out of people who lived in different counties, 50% lived in Illinois.
92% of the 62445 zip code residents lived in the same house 1 year ago. Out of people who lived in different houses, 64% moved from this county. Out of people who lived in different houses, 32% moved from different county within same state.
Private vs. public school enrollment:
Students in private schools in grades 1 to 8 (elementary and middle school):
Here:
0.0%
Illinois:
13.3%
Students in private schools in grades 9 to 12 (high school):
Here:
0.0%
Illinois:
9.9%
Students in private undergraduate colleges: 55
Here:
59.8%
Illinois:
27.4%
Occupation by median earnings in the past 12 months ($)
88,745Construction and extraction occupations
88,674Installation, maintenance, and repair occupations
80,174Transportation occupations
70,268Architecture and engineering occupations
48,193Farming, fishing, and forestry occupations
44,583Health technologists and technicians
Top industries in this zip code by the number of employees in 2005:
Construction: Poured Concrete Foundation and Structure Contractors (10-19: 2)
Health Care and Social Assistance: Offices of Dentists (5-9: 1)
Other Services (except Public Administration): Religious Organizations (5-9: 1)
Administrative and Support and Waste Management and Remediation Services: Septic Tank and Related Services (1-4: 1)
Other Services (except Public Administration): Commercial and Industrial Machinery and Equipment (except Automotive and Electronic) Repair and Maintenance (1-4: 1)
Accommodation and Food Services: Hotels (except Casino Hotels) and Motels (1-4: 1)
Fatal accident statistics in 2013:
Fatal accident count: 1
Vehicles involved in fatal accidents: 2
Fatal accidents caused by drunken drivers: 1
Fatalities: 1
Persons involved in fatal accidents: 5
Pedestrians involved in fatal accidents: 0
Fatal accident statistics in 2012:
Fatal accident count: 1
Vehicles involved in fatal accidents: 1
Fatal accidents caused by drunken drivers: 0
Fatalities: 1
Persons involved in fatal accidents: 1
Pedestrians involved in fatal accidents: 1
2002 - 2018 National Fire Incident Reporting System (NFIRS) incidents
According to the data from the years 2002 - 2018 the average number of fires per year is 9. The highest number of reported fire incidents - 23 took place in 2018, and the least - 3 in 2003. The data has a growing trend.
When looking into fire subcategories, the most incidents belonged to: Outside Fires (31.2%), and Structure Fires (27.3%).
Fire incident types reported to NFIRS in Zip Code 62445


 Nearest zip codes: 62436, 62468, 62467, 62479, 62462, 62469.


 According to the data from the years 2002 - 2018 the average number of fires per year is 9. The highest number of reported fire incidents - 23 took place in 2018, and the least - 3 in 2003. The data has a growing trend.
 When looking into fire subcategories, the most incidents belonged to: Outside Fires (31.2%), and Structure Fires (27.3%).