Estimated zip code population in 2022: 1,577 Zip code population in 2010: 1,776 Zip code population in 2000: 1,714
Houses and condos: 731 Renter-occupied apartments: 116
% of renters here:
17%
State:
33%
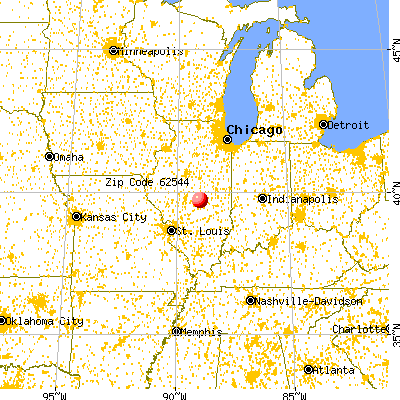
March 2022 cost of living index in zip code 62544: 84.5 (less than average, U.S. average is 100)
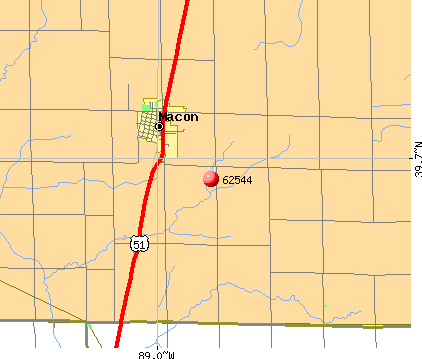
Land area: 68.3 sq. mi. Water area: 0.0 sq. mi.
Population density: 23 people per square mile
(very low).
OSM Map
General Map
Google Map
MSN Map
OSM Map
General Map
Google Map
MSN Map
OSM Map
General Map
Google Map
MSN Map
OSM Map
General Map
Google Map
MSN Map
Please wait while loading the map...
Real estate property taxes paid for housing units in 2022:
This zip code:
1.6% ($2,245)
Illinois:
2.0% ($4,912)
Median real estate property taxes paid for housing units with mortgages in 2022: $2,320 (1.7%) Median real estate property taxes paid for housing units with no mortgage in 2022: $2,144 (1.5%)
Business Search- 14 Million verified businesses
Males: 760
(48.2%)
Females: 817
(51.8%)
For population 25 years and over in 62544:
High school or higher: 93.8%
Bachelor's degree or higher: 18.8%
Graduate or professional degree: 3.7%
Unemployed: 1.4%
Mean travel time to work (commute): 22.3 minutes
For population 15 years and over in 62544:
Never married: 23.5%
Now married: 61.0%
Separated: 0.3%
Widowed: 9.1%
Divorced: 6.0%
Zip code 62544 compared to state average:
Median house value below state average.
Unemployed percentage significantly below state average.
Black race population percentage significantly below state average.
Hispanic race population percentage significantly below state average.
Median age above state average.
Foreign-born population percentage significantly below state average.
Renting percentage below state average.
Length of stay since moving in significantly above state average.
Percentage of population with a bachelor's degree or higher below state average.
Estimated median house/condo value in 2022: $138,585
62544:
$138,585
Illinois:
$251,600
According to our research of Illinois and other state lists, there were 2 registered sex offenders living in 62544 zip code as of June 16, 2024. The ratio of all residents to sex offenders in zip code 62544 is 918 to 1. The ratio of registered sex offenders to all residents in this zip code is near the state average.
Median resident age:
This zip code:
43.1 years
Illinois median age:
39.1 years
Average household size:
This zip code:
2.3 people
Illinois:
2.4 people
Averages for the 2020 tax year for zip code 62544, filed in 2021:
Average Adjusted Gross Income (AGI) in 2020: $66,988 (Individual Income Tax Returns)
Here:
$66,988
State:
$82,626
Salary/wage: $55,844 (reported on 81.0% of returns)
Here:
$55,844
State:
$66,640
(% of AGI for various income ranges: 1161.9% for AGIs below $25k, 3372.1% for AGIs $25k-50k, 5975.0% for AGIs $50k-75k, 7720.0% for AGIs $75k-100k, 14123.0% for AGIs $100k-200k)
Taxable interest for individuals: $615 (reported on 40.5% of returns)
This zip code:
$615
Illinois:
$2,376
(% of AGI for various income ranges: 19.4% for AGIs below $25k, 45.0% for AGIs $25k-50k, 25.8% for AGIs $50k-75k, 27.5% for AGIs $75k-100k, 54.0% for AGIs $100k-200k)
Ordinary dividends: $2,540 (reported on 17.9% of returns)
Here:
$2,540
State:
$9,061
(% of AGI for various income ranges: 35.0% for AGIs below $25k, 23.6% for AGIs $25k-50k, 94.2% for AGIs $50k-75k, 179.0% for AGIs $100k-200k)
Net capital gain/loss in AGI: +$5,500 (reported on 13.1% of returns)
Here:
+$5,500
State:
+$31,684
(% of AGI for various income ranges: 6.2% for AGIs below $25k, 131.7% for AGIs $50k-75k, 437.0% for AGIs $100k-200k)
Profit/loss from business: +$6,240 (reported on 11.9% of returns)
Here:
+$6,240
State:
+$12,175
(% of AGI for various income ranges: 155.6% for AGIs below $25k, 153.3% for AGIs $50k-75k, 191.0% for AGIs $100k-200k)
Taxable individual retirement arrangement distribution: $14,840 (reported on 11.9% of returns)
62544:
$14,840
Illinois:
$21,613
(% of AGI for various income ranges: 187.1% for AGIs $25k-50k, 337.5% for AGIs $50k-75k, 817.0% for AGIs $100k-200k)
Total itemized deductions: $26,933 (reported on 3.6% of returns)
Here:
$26,933
State:
$34,948
(% of AGI for various income ranges: 673.3% for AGIs $50k-75k)
Taxes paid: $6,667 (reported on 3.6% of returns)
62544:
$6,667
State:
$8,563
(% of AGI for various income ranges: 250.0% for AGIs $75k-100k)
Earned income credit: $2,410 (reported on 11.9% of returns)
Here:
$2,410
State:
$2,311
(% of AGI for various income ranges: 92.5% for AGIs below $25k, 66.4% for AGIs $25k-50k)
Percentage of individuals using paid preparers for their 2020 taxes: 95.2%
Here:
95%
State:
93%
(% for various income ranges: 95.7% for AGIs below $25k, 94.4% for AGIs $25k-50k, 93.3% for AGIs $50k-75k, 100.0% for AGIs $75k-100k, 93.3% for AGIs $100k-200k, 100.0% for AGIs over 200k)
Averages for the 2012 tax year for zip code 62544, filed in 2013:
Average Adjusted Gross Income (AGI) in 2012: $55,313 (Individual Income Tax Returns)
Here:
$55,313
State:
$68,058
Salary/wage: $44,525 (reported on 88.5% of returns)
Here:
$44,525
State:
$55,396
(% of AGI for various income ranges: 71.0% for AGIs below $25k, 85.5% for AGIs $25k-50k, 74.2% for AGIs $50k-75k, 75.7% for AGIs $75k-100k, 62.0% for AGIs $100k-200k)
Taxable interest for individuals: $794 (reported on 40.2% of returns)
This zip code:
$794
Illinois:
$1,969
(% of AGI for various income ranges: 1.0% for AGIs below $25k, 0.3% for AGIs $25k-50k, 0.9% for AGIs $50k-75k, 0.2% for AGIs $75k-100k, 0.7% for AGIs $100k-200k)
Ordinary dividends: $1,578 (reported on 20.7% of returns)
Here:
$1,578
State:
$7,786
(% of AGI for various income ranges: 1.0% for AGIs below $25k, 0.1% for AGIs $25k-50k, 0.9% for AGIs $50k-75k, 0.6% for AGIs $75k-100k, 0.5% for AGIs $100k-200k)
Net capital gain/loss in AGI: +$4,644 (reported on 10.3% of returns)
Here:
+$4,644
State:
+$22,183
Profit/loss from business: +$7,973 (reported on 12.6% of returns)
Here:
+$7,973
State:
+$12,903
(% of AGI for various income ranges: 4.6% for AGIs below $25k, 4.7% for AGIs $50k-75k, 1.6% for AGIs $100k-200k)
Taxable individual retirement arrangement distribution: $9,233 (reported on 10.3% of returns)
62544:
$9,233
Illinois:
$17,929
(% of AGI for various income ranges: 3.2% for AGIs below $25k, 4.7% for AGIs $25k-50k, 3.8% for AGIs $75k-100k)
Total itemized deductions: $17,691 (18% of AGI, reported on 25.3% of returns)
Here:
$17,691
State:
$26,433
Here:
18.2% of AGI
State:
19.2% of AGI
(% of AGI for various income ranges: 8.2% for AGIs $25k-50k, 7.1% for AGIs $50k-75k, 6.8% for AGIs $75k-100k, 10.8% for AGIs $100k-200k)
Charity contributions: $4,188 (reported on 18.4% of returns)
Here:
$4,188
State:
$4,525
(% of AGI for various income ranges: 2.2% for AGIs below $25k, 1.0% for AGIs $50k-75k, 0.9% for AGIs $75k-100k, 2.2% for AGIs $100k-200k)
Taxes paid: $7,214 (reported on 25.3% of returns)
62544:
$7,214
State:
$11,968
(% of AGI for various income ranges: 2.2% for AGIs $25k-50k, 2.6% for AGIs $50k-75k, 2.5% for AGIs $75k-100k, 5.1% for AGIs $100k-200k)
Earned income credit: $2,023 (reported on 14.9% of returns)
Here:
$2,023
State:
$2,349
(% of AGI for various income ranges: 4.7% for AGIs below $25k, 1.2% for AGIs $25k-50k)
Percentage of individuals using paid preparers for their 2012 taxes: 65.5%
Here:
66%
State:
57%
(% for various income ranges: 56.7% for AGIs below $25k, 65.0% for AGIs $25k-50k, 71.4% for AGIs $50k-75k, 63.6% for AGIs $75k-100k, 83.3% for AGIs $100k-200k)
Averages for the 2004 tax year for zip code 62544, filed in 2005:
Average Adjusted Gross Income (AGI) in 2004: $40,577 (Individual Income Tax Returns)
Here:
$40,577
State:
$54,625
Salary/wage: $37,068 (reported on 86.3% of returns)
Here:
$37,068
State:
$46,811
(% of AGI for various income ranges: 107.5% for AGIs below $10k, 66.0% for AGIs $10k-25k, 78.1% for AGIs $25k-50k, 85.4% for AGIs $50k-75k, 79.6% for AGIs $75k-100k, 69.9% for AGIs over 100k)
Taxable interest for individuals: $1,299 (reported on 48.6% of returns)
This zip code:
$1,299
Illinois:
$2,101
(% of AGI for various income ranges: 8.2% for AGIs below $10k, 5.9% for AGIs $10k-25k, 1.2% for AGIs $25k-50k, 0.9% for AGIs $50k-75k, 1.1% for AGIs $75k-100k, 0.9% for AGIs over 100k)
Taxable dividends: $1,260 (reported on 25.4% of returns)
Here:
$1,260
State:
$4,306
(% of AGI for various income ranges: 5.4% for AGIs below $10k, 1.7% for AGIs $10k-25k, 0.4% for AGIs $25k-50k, 0.7% for AGIs $50k-75k, 0.2% for AGIs $75k-100k, 1.1% for AGIs over 100k)
Net capital gain/loss: +$878 (reported on 16.4% of returns)
Here:
+$878
State:
+$17,321
(% of AGI for various income ranges: -3.8% for AGIs below $10k, 0.3% for AGIs $10k-25k, 0.2% for AGIs $25k-50k, 0.3% for AGIs $50k-75k, -0.1% for AGIs $75k-100k, 1.8% for AGIs over 100k)
Profit/loss from business: +$4,312 (reported on 14.7% of returns)
Here:
+$4,312
State:
+$11,771
(% of AGI for various income ranges: -2.6% for AGIs below $10k, 1.4% for AGIs $10k-25k, 3.1% for AGIs $25k-50k, 1.4% for AGIs $50k-75k, 1.7% for AGIs $75k-100k)
Profit/loss from farming: +$19,821 (reported on 6.6% of returns)
Here:
+$19,821
State:
+$2,327
IRA payment deduction: $2,158 (reported on 2.2% of returns)
62544:
$2,158
Illinois:
$3,087
Total itemized deductions: $14,938 (20% of AGI, reported on 19.1% of returns)
Here:
$14,938
State:
$20,239
Here:
20.5% of AGI
State:
19.5% of AGI
(% of AGI for various income ranges: 7.8% for AGIs $10k-25k, 6.2% for AGIs $25k-50k, 6.1% for AGIs $50k-75k, 8.0% for AGIs $75k-100k, 9.5% for AGIs over 100k)
Charity contributions deductions: $2,873 (4% of AGI, reported on 14.9% of returns)
Here:
$2,873
State:
$3,719
Here:
3.8% of AGI
State:
3.4% of AGI
(% of AGI for various income ranges: 0.8% for AGIs $10k-25k, 0.6% for AGIs $25k-50k, 0.7% for AGIs $50k-75k, 1.6% for AGIs $75k-100k, 2.1% for AGIs over 100k)
Total tax: $5,023 (reported on 77.7% of returns)
62544:
$5,023
State:
$9,882
(% of AGI for various income ranges: 2.3% for AGIs below $10k, 4.5% for AGIs $10k-25k, 7.8% for AGIs $25k-50k, 8.2% for AGIs $50k-75k, 11.7% for AGIs $75k-100k, 16.2% for AGIs over 100k)
Earned income credit: $1,659 (reported on 10.0% of returns)
Here:
$1,659
State:
$1,788
Percentage of individuals using paid preparers for their 2004 taxes: 69.3%
Here:
69%
State:
61%
(% for various income ranges: 67.8% for AGIs below $10k, 61.1% for AGIs $10k-25k, 70.8% for AGIs $25k-50k, 72.2% for AGIs $50k-75k, 80.3% for AGIs $75k-100k, 70.7% for AGIs over 100k)
Household received Food Stamps/SNAP in the past 12 months: 43 Household did not receive Food Stamps/SNAP in the past 12 months: 615
Women who had a birth in the past 12 months: 53 (53 now married, 0 unmarried) Women who did not have a birth in the past 12 months: 258 (125 now married, 132 unmarried)
Housing units in zip code 62544 with a mortgage: 324 (19 second mortgage, 2 home equity loan, 13 both second mortgage and home equity loan) Median monthly owner costs for units with a mortgage: $1,110 Median monthly owner costs for units without a mortgage: $490
Residents with income below the poverty level in 2022:
This zip code:
4.4%
Whole state:
11.9%
Residents with income below 50% of the poverty level in 2022:
This zip code:
1.9%
Whole state:
5.7%
Median number of rooms in houses and condos:
Here:
6.3
State:
6.4
Median number of rooms in apartments:
Here:
4.8
State:
4.1
Notable locations in this zip code not listed on our city pages
In group quarters: 24 (-1 institutionalized population)
Size of family households: 258 2-persons, 91 3-persons, 53 4-persons, 56 5-persons, 1 6-persons
Size of nonfamily households: 184 1-person, 15 2-persons, 1 4-persons
276 married couples with children.
26 single-parent households (26 women).
98.8% of residents of 62544 zip code speak English at home.
0.5% of residents speak Spanish at home (100% not well).
0.1% of residents speak other Indo-European language at home (100% very well).
0.3% of residents speak other language at home (100% very well).
Foreign born population: 7 (0.5%) (0.0% of them are naturalized citizens)
:
0.5%
Whole state:
14.4%
88%Honduras
28%German
22%American
17%English
12%Irish
3%Italian
2%French
2%Scotch-Irish
Year of entry for the foreign-born population
02010 or later
32000 to 2009
01990 to 1999
10Before 1990
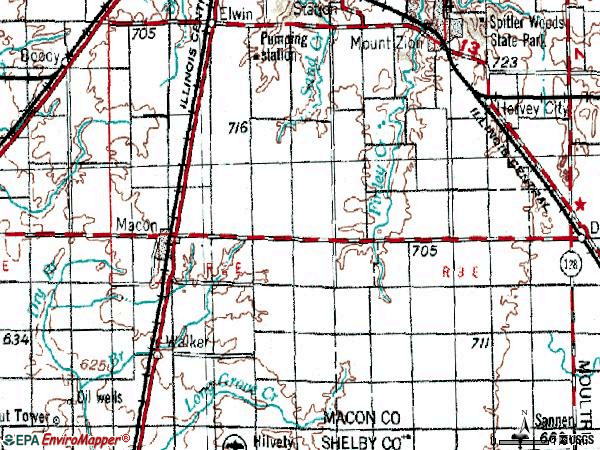
Major facilities with environmental interests located in this zip code:
LAIDLAW (115 S. WILES in MACON, IL)
STATE MASTER (Illinois EPA Project) - SOLID WASTE PROGRAM, HAZARDOUS WASTE PROGRAM, National Pollutant Discharge Elimination System Permit National Pollutant Discharge Elimination System NON-MAJOR (Tracking pollutant discharge elimination systems) - permit Conditionally Exempt Small Quantity Generators, less than 100 kg/month of hazardous waste (Resource Conservation and Recovery Act (tracking hazardous waste)) - notification Organizations: MAYFLOWER CONTRACT SERVICES (CONTACT/OWNER)
, GUINN KEITH (CONTACT/OWNER)
Alternative names: LAIDLAW MAYFLOWER, MAYFLOWER CTR.SERV.-MACON
ADM GRAIN CO (258 FRONT STREET in MACON, IL)
STATE MASTER (Illinois EPA Project) - AIR PROGRAM AIR MINOR (AIRS/AFS) CRITERIA AND HAZARDOUS AIR POLLUTANT INVENTORY (Inventory of air pollution sources) Business SIC classification: GRAIN AND FIELD BEANS Alternative names: TABOR GRAIN COMPANY
MACON, CITY OF (N WOODCOCK ST in MACON, IL)
STATE MASTER (Illinois EPA Project) - HAZARDOUS WASTE PROGRAM (Resource Conservation and Recovery Act (tracking hazardous waste)) Organizations: MACON CITY OF (CONTACT/OWNER)
CORN BELT FS INC (BOX 289 in MACON, IL)
STATE MASTER (Illinois EPA Project) - AIR PROGRAM AIR MINOR (AIRS/AFS) COMPLIANCE ACTIVITY (Tracking inspections of insecticide, fungicide, and rodenticide, and toxic substances) Business SIC classification: FERTILIZERS, MIXING ONLY Alternative names: CORN BELT F S INC
MACON SCHOOL DISTRICT (RT 51 in MACON, IL)
STATE MASTER (Illinois EPA Project) - AIR PROGRAM AIR MINOR (AIRS/AFS) Business SIC classification: ELEMENTARY AND SECONDARY SCHOOLS
MACON STP (10937 SOUTH ROUTE 51 in MACON, IL)
STATE MASTER (Illinois EPA Project) - National Pollutant Discharge Elimination System Permit National Pollutant Discharge Elimination System NON-MAJOR (Tracking pollutant discharge elimination systems) - permit Business SIC classification: SEWERAGE SYSTEMS Alternative names: MACON STP, CITY OF
MERIDIAN SENIOR HIGH SCHOOL (PO BOX 380 in MACON, IL)
(Geographic Names Information System) (National Center for Education Statistics) - STATE ID-3905501500001 Organizations: MERIDIAN COMM UNIT SCH DIST 15 (SCHOOL DISTRICT)
MERIDIAN PRIMARY SCHOOL (PO BOX 198 in MACON, IL)
(National Center for Education Statistics) - STATE ID-3905501502002 Organizations: MERIDIAN COMM UNIT SCH DIST 15 (SCHOOL DISTRICT)
MARATHON PIPELINE CO - MACON STATION (SEC 13 T14N R2E in MACON, IL)
AIR MINOR (AIRS/AFS) Conditionally Exempt Small Quantity Generators, less than 100 kg/month of hazardous waste (Resource Conservation and Recovery Act (tracking hazardous waste)) - notification Business SIC classification: REFINED PETROLEUM PIPELINES Organizations: MARATHON PIPELINE LLC (CONTACT/OPERATOR)
Alternative names: MARATHON ASHLAND PIPE LINE LLC
AT&T LONG LINES MACON (.5M S & 1.5M E OF MACON in MACON, IL)
(Resource Conservation and Recovery Act (tracking hazardous waste))
CORN BELT FS INC (2 BLKS N OF ANDREW ST in MACON, IL)
(Resource Conservation and Recovery Act (tracking hazardous waste))
DAVIS EMERY D (290 N MILLER in MACON, IL)
Small Quantity Generators, between 100 kg and 1000 kg of hazardous waste/month (Resource Conservation and Recovery Act (tracking hazardous waste)) - notification TRANSPORTER (Resource Conservation and Recovery Act (tracking hazardous waste)) - notification
MACON AG SERVICE INC (11185 UALMSLEY RD in MACON, IL)
COMPLIANCE ACTIVITY (Tracking inspections of insecticide, fungicide, and rodenticide, and toxic substances)
Housing units lacking complete plumbing facilities: 0.2% Housing units lacking complete kitchen facilities: 1.4%
66.1%Utility gas
17.8%Electricity
14.9%Bottled, tank, or LP gas
1.2%No fuel used
Population in 1990: 1,737.
Place of birth for U.S.-born residents:
This state: 1,398
Northeast: 3
Midwest: 73
South: 62
West: 17
68% of the 62544 zip code residents lived in the same house 5 years ago. Out of people who lived in different houses, 71% lived in this county. Out of people who lived in different counties, 50% lived in Illinois.
93% of the 62544 zip code residents lived in the same house 1 year ago. Out of people who lived in different houses, 52% moved from this county. Out of people who lived in different houses, 11% moved from different county within same state. Out of people who lived in different houses, 19% moved from different state. Out of people who lived in different houses, 19% moved from abroad.
Private vs. public school enrollment:
Students in private schools in grades 1 to 8 (elementary and middle school):
Here:
0.0%
Illinois:
13.3%
Students in private schools in grades 9 to 12 (high school): 3
Here:
4.6%
Illinois:
9.9%
Students in private undergraduate colleges:
Here:
0.0%
Illinois:
27.4%
Occupation by median earnings in the past 12 months ($)
91,174Farming, fishing, and forestry occupations
90,517Life, physical, and social science occupations
73,201Management occupations
62,284Health technologists and technicians
55,477Construction and extraction occupations
49,852Education, training, and library occupations
Top industries in this zip code by the number of employees in 2005:
Health Care and Social Assistance: Nursing Care Facilities (50-99 employees: 1 establishment)
Other Services (except Public Administration): Religious Organizations (5-9: 1, 1-4: 1)
Other Services (except Public Administration): Other Electronic and Precision Equipment Repair and Maintenance (5-9: 1, 1-4: 1)
Administrative and Support and Waste Management and Remediation Services: Janitorial Services (5-9: 1)
Administrative and Support and Waste Management and Remediation Services: Solid Waste Collection (5-9: 1)
Other Services (except Public Administration): Civic and Social Organizations (5-9: 1)
People in group quarters in 2010:
23 people in nursing facilities/skilled-nursing facilities
People in group quarters in 2000:
41 people in nursing homes
Home Mortgage Disclosure Act Aggregated Statistics For Year 2009 (Based on 6 partial tracts)
A) FHA, FSA/RHS & VA Home Purchase Loans
B) Conventional Home Purchase Loans
C) Refinancings
D) Home Improvement Loans
F) Non-occupant Loans on < 5 Family Dwellings (A B C & D)
Number
Average Value
Number
Average Value
Number
Average Value
Number
Average Value
Number
Average Value
LOANS ORIGINATED
26
$105,642
47
$132,207
196
$132,189
10
$50,322
6
$56,125
APPLICATIONS APPROVED, NOT ACCEPTED
3
$120,507
1
$199,670
5
$185,884
1
$32,930
0
$0
APPLICATIONS DENIED
4
$107,265
5
$127,796
24
$110,203
4
$35,858
0
$0
APPLICATIONS WITHDRAWN
1
$58,330
2
$100,030
28
$111,769
1
$73,640
0
$0
FILES CLOSED FOR INCOMPLETENESS
0
$0
1
$76,160
4
$122,922
0
$0
0
$0
Aggregated Statistics For Year 2008 (Based on 6 partial tracts)
A) FHA, FSA/RHS & VA Home Purchase Loans
B) Conventional Home Purchase Loans
C) Refinancings
D) Home Improvement Loans
E) Loans on Dwellings For 5+ Families
F) Non-occupant Loans on < 5 Family Dwellings (A B C & D)
Number
Average Value
Number
Average Value
Number
Average Value
Number
Average Value
Number
Average Value
Number
Average Value
LOANS ORIGINATED
42
$97,648
74
$116,275
106
$128,688
9
$57,240
2
$201,245
17
$59,827
APPLICATIONS APPROVED, NOT ACCEPTED
0
$0
5
$155,740
7
$140,207
1
$97,470
0
$0
0
$0
APPLICATIONS DENIED
1
$71,490
8
$99,582
52
$106,989
9
$62,718
0
$0
4
$62,075
APPLICATIONS WITHDRAWN
3
$93,450
2
$191,975
25
$112,294
3
$70,843
0
$0
0
$0
FILES CLOSED FOR INCOMPLETENESS
0
$0
0
$0
3
$104,657
1
$134,250
0
$0
0
$0
Aggregated Statistics For Year 2007 (Based on 6 partial tracts)
A) FHA, FSA/RHS & VA Home Purchase Loans
B) Conventional Home Purchase Loans
C) Refinancings
D) Home Improvement Loans
F) Non-occupant Loans on < 5 Family Dwellings (A B C & D)
G) Loans On Manufactured Home Dwelling (A B C & D)
Number
Average Value
Number
Average Value
Number
Average Value
Number
Average Value
Number
Average Value
Number
Average Value
LOANS ORIGINATED
10
$97,762
89
$107,458
72
$97,134
15
$44,671
11
$57,731
1
$41,430
APPLICATIONS APPROVED, NOT ACCEPTED
0
$0
4
$95,705
7
$81,519
4
$22,778
0
$0
0
$0
APPLICATIONS DENIED
1
$52,880
17
$96,430
58
$93,434
20
$62,864
1
$108,520
2
$78,620
APPLICATIONS WITHDRAWN
0
$0
4
$100,942
25
$81,831
5
$73,172
5
$31,348
0
$0
FILES CLOSED FOR INCOMPLETENESS
0
$0
1
$32,410
5
$109,342
2
$121,220
0
$0
0
$0
Aggregated Statistics For Year 2006 (Based on 6 partial tracts)
A) FHA, FSA/RHS & VA Home Purchase Loans
B) Conventional Home Purchase Loans
C) Refinancings
D) Home Improvement Loans
F) Non-occupant Loans on < 5 Family Dwellings (A B C & D)
G) Loans On Manufactured Home Dwelling (A B C & D)
Number
Average Value
Number
Average Value
Number
Average Value
Number
Average Value
Number
Average Value
Number
Average Value
LOANS ORIGINATED
14
$103,986
117
$102,469
83
$105,390
20
$49,126
10
$93,872
0
$0
APPLICATIONS APPROVED, NOT ACCEPTED
1
$92,340
4
$125,848
5
$116,612
1
$37,490
0
$0
0
$0
APPLICATIONS DENIED
0
$0
10
$79,600
56
$87,064
7
$42,490
0
$0
1
$24,390
APPLICATIONS WITHDRAWN
0
$0
5
$152,854
28
$102,699
8
$61,582
0
$0
0
$0
FILES CLOSED FOR INCOMPLETENESS
1
$106,160
2
$59,980
3
$130,717
0
$0
0
$0
0
$0
Aggregated Statistics For Year 2005 (Based on 6 partial tracts)
A) FHA, FSA/RHS & VA Home Purchase Loans
B) Conventional Home Purchase Loans
C) Refinancings
D) Home Improvement Loans
E) Loans on Dwellings For 5+ Families
F) Non-occupant Loans on < 5 Family Dwellings (A B C & D)
Number
Average Value
Number
Average Value
Number
Average Value
Number
Average Value
Number
Average Value
Number
Average Value
LOANS ORIGINATED
14
$93,102
109
$103,359
98
$101,673
11
$78,800
1
$177,570
13
$112,933
APPLICATIONS APPROVED, NOT ACCEPTED
0
$0
9
$134,559
15
$102,939
1
$28,230
0
$0
6
$99,403
APPLICATIONS DENIED
0
$0
13
$72,733
64
$95,164
16
$22,919
0
$0
2
$26,025
APPLICATIONS WITHDRAWN
0
$0
10
$146,330
28
$114,124
5
$133,556
0
$0
0
$0
FILES CLOSED FOR INCOMPLETENESS
0
$0
0
$0
5
$93,932
0
$0
0
$0
0
$0
Aggregated Statistics For Year 2004 (Based on 6 partial tracts)
A) FHA, FSA/RHS & VA Home Purchase Loans
B) Conventional Home Purchase Loans
C) Refinancings
D) Home Improvement Loans
F) Non-occupant Loans on < 5 Family Dwellings (A B C & D)
Number
Average Value
Number
Average Value
Number
Average Value
Number
Average Value
Number
Average Value
LOANS ORIGINATED
18
$77,002
114
$93,203
155
$99,994
14
$27,006
7
$72,584
APPLICATIONS APPROVED, NOT ACCEPTED
1
$138,900
7
$91,357
13
$69,913
3
$36,743
1
$57,380
APPLICATIONS DENIED
0
$0
22
$64,550
43
$69,688
4
$21,660
3
$51,587
APPLICATIONS WITHDRAWN
0
$0
4
$100,755
24
$96,722
4
$51,560
0
$0
FILES CLOSED FOR INCOMPLETENESS
0
$0
0
$0
3
$82,753
0
$0
0
$0
Aggregated Statistics For Year 2003 (Based on 6 partial tracts)
A) FHA, FSA/RHS & VA Home Purchase Loans
B) Conventional Home Purchase Loans
C) Refinancings
D) Home Improvement Loans
F) Non-occupant Loans on < 5 Family Dwellings (A B C & D)
Number
Average Value
Number
Average Value
Number
Average Value
Number
Average Value
Number
Average Value
LOANS ORIGINATED
29
$72,510
81
$91,855
439
$92,724
15
$18,583
12
$43,728
APPLICATIONS APPROVED, NOT ACCEPTED
1
$83,260
2
$59,780
20
$78,616
3
$26,183
0
$0
APPLICATIONS DENIED
0
$0
7
$65,959
46
$91,130
15
$17,463
1
$55,200
APPLICATIONS WITHDRAWN
0
$0
3
$61,203
35
$78,929
2
$17,960
0
$0
FILES CLOSED FOR INCOMPLETENESS
0
$0
0
$0
3
$91,463
1
$86,160
0
$0
Aggregated Statistics For Year 2002 (Based on 6 partial tracts)
A) FHA, FSA/RHS & VA Home Purchase Loans
B) Conventional Home Purchase Loans
C) Refinancings
D) Home Improvement Loans
F) Non-occupant Loans on < 5 Family Dwellings (A B C & D)
Number
Average Value
Number
Average Value
Number
Average Value
Number
Average Value
Number
Average Value
LOANS ORIGINATED
12
$76,958
71
$82,777
219
$92,760
14
$16,210
8
$97,314
APPLICATIONS APPROVED, NOT ACCEPTED
0
$0
2
$112,660
16
$90,631
1
$6,340
0
$0
APPLICATIONS DENIED
1
$93,680
3
$89,363
63
$91,077
6
$19,953
0
$0
APPLICATIONS WITHDRAWN
0
$0
2
$62,150
23
$77,055
0
$0
2
$58,310
FILES CLOSED FOR INCOMPLETENESS
0
$0
0
$0
2
$66,295
0
$0
0
$0
Aggregated Statistics For Year 2001 (Based on 6 partial tracts)
A) FHA, FSA/RHS & VA Home Purchase Loans
B) Conventional Home Purchase Loans
C) Refinancings
D) Home Improvement Loans
F) Non-occupant Loans on < 5 Family Dwellings (A B C & D)
Number
Average Value
Number
Average Value
Number
Average Value
Number
Average Value
Number
Average Value
LOANS ORIGINATED
21
$71,490
62
$85,849
194
$79,097
12
$23,695
4
$65,975
APPLICATIONS APPROVED, NOT ACCEPTED
1
$72,210
3
$36,073
15
$81,207
2
$49,775
0
$0
APPLICATIONS DENIED
0
$0
6
$60,610
36
$70,857
13
$15,973
0
$0
APPLICATIONS WITHDRAWN
0
$0
4
$115,890
23
$78,553
0
$0
0
$0
FILES CLOSED FOR INCOMPLETENESS
0
$0
0
$0
2
$46,280
1
$5,550
0
$0
Aggregated Statistics For Year 2000 (Based on 6 partial tracts)
A) FHA, FSA/RHS & VA Home Purchase Loans
B) Conventional Home Purchase Loans
C) Refinancings
D) Home Improvement Loans
F) Non-occupant Loans on < 5 Family Dwellings (A B C & D)
Number
Average Value
Number
Average Value
Number
Average Value
Number
Average Value
Number
Average Value
LOANS ORIGINATED
14
$69,905
73
$95,295
49
$59,772
19
$15,371
3
$59,320
APPLICATIONS APPROVED, NOT ACCEPTED
0
$0
0
$0
9
$51,330
5
$39,120
0
$0
APPLICATIONS DENIED
0
$0
6
$42,135
32
$61,927
7
$13,637
2
$41,895
APPLICATIONS WITHDRAWN
0
$0
5
$108,428
18
$50,625
3
$44,820
1
$117,970
FILES CLOSED FOR INCOMPLETENESS
0
$0
0
$0
4
$50,580
0
$0
0
$0
Aggregated Statistics For Year 1999 (Based on 3 partial tracts)
A) FHA, FSA/RHS & VA Home Purchase Loans
B) Conventional Home Purchase Loans
C) Refinancings
D) Home Improvement Loans
E) Loans on Dwellings For 5+ Families
F) Non-occupant Loans on < 5 Family Dwellings (A B C & D)
2002 - 2018 National Fire Incident Reporting System (NFIRS) incidents
According to the data from the years 2002 - 2018 the average number of fire incidents per year is 16. The highest number of fire incidents - 38 took place in 2003, and the least - 6 in 2009. The data has a dropping trend.
When looking into fire subcategories, the most reports belonged to: Structure Fires (42.1%), and Outside Fires (36.6%).
Fire incident types reported to NFIRS in Zip Code 62544


 Nearest zip codes: 62532, 62550, 62514, 62521, 62549, 61925.


 According to the data from the years 2002 - 2018 the average number of fire incidents per year is 16. The highest number of fire incidents - 38 took place in 2003, and the least - 6 in 2009. The data has a dropping trend.
 When looking into fire subcategories, the most reports belonged to: Structure Fires (42.1%), and Outside Fires (36.6%).