Estimated zip code population in 2022: 2,120 Zip code population in 2010: 2,865 Zip code population in 2000: 2,725
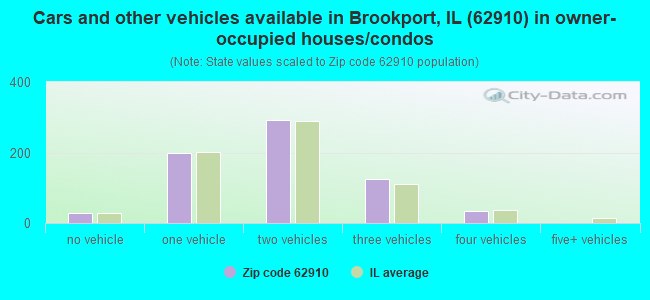
Houses and condos: 1,067 Renter-occupied apartments: 124
% of renters here:
15%
State:
33%
March 2022 cost of living index in zip code 62910: 84.0 (less than average, U.S. average is 100)
Land area: 103.7 sq. mi. Water area: 2.7 sq. mi.
Population density: 20 people per square mile
(very low).
OSM Map
General Map
Google Map
MSN Map
OSM Map
General Map
Google Map
MSN Map
OSM Map
General Map
Google Map
MSN Map
OSM Map
General Map
Google Map
MSN Map
Please wait while loading the map...
Real estate property taxes paid for housing units in 2022:
This zip code:
1.3% ($1,090)
Illinois:
2.0% ($4,912)
Median real estate property taxes paid for housing units with mortgages in 2022: $1,742 (1.4%) Median real estate property taxes paid for housing units with no mortgage in 2022: $574 (1.1%)
Business Search- 14 Million verified businesses
Males: 1,009
(47.6%)
Females: 1,110
(52.4%)
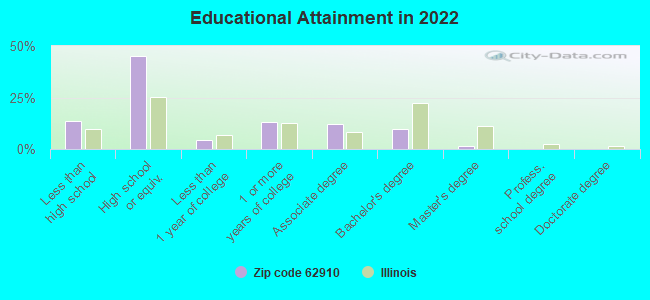
For population 25 years and over in 62910:
High school or higher: 85.5%
Bachelor's degree or higher: 11.6%
Graduate or professional degree: 1.9%
Unemployed: 2.5%
Mean travel time to work (commute): 24.7 minutes
For population 15 years and over in 62910:
Never married: 23.9%
Now married: 45.1%
Separated: 6.3%
Widowed: 6.5%
Divorced: 18.2%
Zip code 62910 compared to state average:
Median household income below state average.
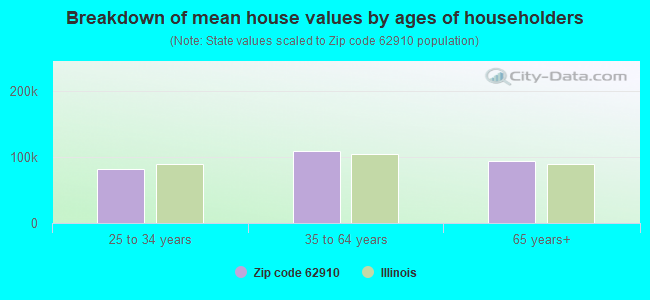
Median house value significantly below state average.
Unemployed percentage below state average.
Hispanic race population percentage significantly below state average.
Foreign-born population percentage significantly below state average.
Renting percentage below state average.
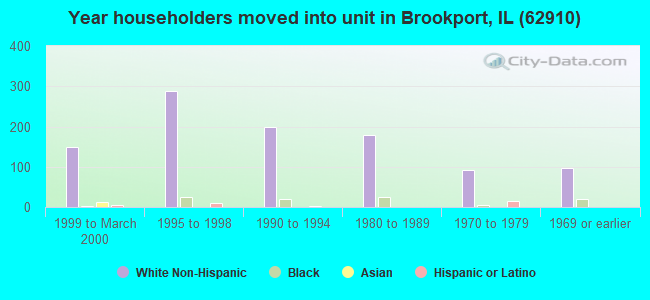
Length of stay since moving in significantly above state average.
House age below state average.
Number of college students below state average.
Percentage of population with a bachelor's degree or higher significantly below state average.
Averages for the 2020 tax year for zip code 62910, filed in 2021:
Average Adjusted Gross Income (AGI) in 2020: $44,734 (Individual Income Tax Returns)
Here:
$44,734
State:
$82,626
Salary/wage: $40,901 (reported on 79.4% of returns)
Here:
$40,901
State:
$66,640
(% of AGI for various income ranges: 1073.8% for AGIs below $25k, 3249.5% for AGIs $25k-50k, 5859.1% for AGIs $50k-75k, 8930.0% for AGIs $75k-100k, 18695.0% for AGIs $100k-200k)
Taxable interest for individuals: $615 (reported on 26.8% of returns)
This zip code:
$615
Illinois:
$2,376
(% of AGI for various income ranges: 8.4% for AGIs below $25k, 27.1% for AGIs $25k-50k, 18.2% for AGIs $50k-75k, 107.5% for AGIs $75k-100k, 21.7% for AGIs $100k-200k)
Ordinary dividends: $2,167 (reported on 12.4% of returns)
Here:
$2,167
State:
$9,061
(% of AGI for various income ranges: 13.1% for AGIs below $25k, 24.8% for AGIs $25k-50k, 84.5% for AGIs $50k-75k, 121.7% for AGIs $100k-200k)
Net capital gain/loss in AGI: +$4,070 (reported on 10.3% of returns)
Here:
+$4,070
State:
+$31,684
(% of AGI for various income ranges: 0.6% for AGIs below $25k, 35.2% for AGIs $25k-50k, 95.5% for AGIs $50k-75k, 376.7% for AGIs $100k-200k)
Profit/loss from business: +$3,942 (reported on 12.4% of returns)
Here:
+$3,942
State:
+$12,175
(% of AGI for various income ranges: 95.9% for AGIs below $25k, 67.1% for AGIs $25k-50k, 62.5% for AGIs $75k-100k)
Taxable individual retirement arrangement distribution: $16,586 (reported on 7.2% of returns)
62910:
$16,586
Illinois:
$21,613
(% of AGI for various income ranges: 251.4% for AGIs $25k-50k, 1582.5% for AGIs $75k-100k)
Earned income credit: $2,578 (reported on 23.7% of returns)
Here:
$2,578
State:
$2,311
(% of AGI for various income ranges: 122.2% for AGIs below $25k, 96.2% for AGIs $25k-50k)
Percentage of individuals using paid preparers for their 2020 taxes: 95.9%
Here:
96%
State:
93%
(% for various income ranges: 95.0% for AGIs below $25k, 96.2% for AGIs $25k-50k, 100.0% for AGIs $50k-75k, 100.0% for AGIs $75k-100k, 90.9% for AGIs $100k-200k)
Averages for the 2012 tax year for zip code 62910, filed in 2013:
Average Adjusted Gross Income (AGI) in 2012: $37,741 (Individual Income Tax Returns)
Here:
$37,741
State:
$68,058
Salary/wage: $34,106 (reported on 83.8% of returns)
Here:
$34,106
State:
$55,396
(% of AGI for various income ranges: 77.0% for AGIs below $25k, 75.8% for AGIs $25k-50k, 72.5% for AGIs $50k-75k, 77.8% for AGIs $75k-100k, 76.1% for AGIs $100k-200k)
Taxable interest for individuals: $923 (reported on 23.4% of returns)
This zip code:
$923
Illinois:
$1,969
(% of AGI for various income ranges: 0.7% for AGIs below $25k, 1.0% for AGIs $25k-50k, 0.6% for AGIs $50k-75k, 0.3% for AGIs $75k-100k, 0.1% for AGIs $100k-200k)
Ordinary dividends: $2,200 (reported on 10.8% of returns)
Here:
$2,200
State:
$7,786
(% of AGI for various income ranges: 0.7% for AGIs below $25k, 0.6% for AGIs $25k-50k, 1.0% for AGIs $50k-75k, 0.9% for AGIs $75k-100k)
Net capital gain/loss in AGI: +$1,788 (reported on 7.2% of returns)
Here:
+$1,788
State:
+$22,183
(% of AGI for various income ranges: 0.3% for AGIs $25k-50k, 0.6% for AGIs $50k-75k, 0.9% for AGIs $75k-100k)
Profit/loss from business: +$5,342 (reported on 10.8% of returns)
Here:
+$5,342
State:
+$12,903
(% of AGI for various income ranges: 5.0% for AGIs below $25k, 3.0% for AGIs $25k-50k)
Taxable individual retirement arrangement distribution: $9,533 (reported on 8.1% of returns)
62910:
$9,533
Illinois:
$17,929
(% of AGI for various income ranges: 1.5% for AGIs below $25k, 2.5% for AGIs $25k-50k, 3.5% for AGIs $50k-75k, 2.7% for AGIs $75k-100k)
Total itemized deductions: $17,790 (25% of AGI, reported on 18.9% of returns)
Here:
$17,790
State:
$26,433
Here:
25.1% of AGI
State:
19.2% of AGI
(% of AGI for various income ranges: 9.4% for AGIs $25k-50k, 9.7% for AGIs $50k-75k, 10.8% for AGIs $75k-100k, 13.2% for AGIs $100k-200k)
Charity contributions: $3,729 (reported on 12.6% of returns)
Here:
$3,729
State:
$4,525
(% of AGI for various income ranges: 0.9% for AGIs $25k-50k, 1.3% for AGIs $50k-75k, 1.6% for AGIs $75k-100k, 2.3% for AGIs $100k-200k)
Taxes paid: $5,548 (reported on 18.9% of returns)
62910:
$5,548
State:
$11,968
(% of AGI for various income ranges: 1.7% for AGIs $25k-50k, 3.3% for AGIs $50k-75k, 3.5% for AGIs $75k-100k, 5.0% for AGIs $100k-200k)
Earned income credit: $2,568 (reported on 27.9% of returns)
Here:
$2,568
State:
$2,349
(% of AGI for various income ranges: 8.9% for AGIs below $25k, 1.7% for AGIs $25k-50k)
Percentage of individuals using paid preparers for their 2012 taxes: 64.9%
Here:
65%
State:
57%
(% for various income ranges: 61.1% for AGIs below $25k, 66.7% for AGIs $25k-50k, 71.4% for AGIs $50k-75k, 66.7% for AGIs $75k-100k, 71.4% for AGIs $100k-200k)
Averages for the 2004 tax year for zip code 62910, filed in 2005:
Average Adjusted Gross Income (AGI) in 2004: $29,993 (Individual Income Tax Returns)
Here:
$29,993
State:
$54,625
Salary/wage: $28,320 (reported on 86.1% of returns)
Here:
$28,320
State:
$46,811
(% of AGI for various income ranges: 110.4% for AGIs below $10k, 79.9% for AGIs $10k-25k, 80.9% for AGIs $25k-50k, 81.0% for AGIs $50k-75k, 84.1% for AGIs $75k-100k, 71.9% for AGIs over 100k)
Taxable interest for individuals: $1,024 (reported on 32.2% of returns)
This zip code:
$1,024
Illinois:
$2,101
(% of AGI for various income ranges: 3.0% for AGIs below $10k, 2.3% for AGIs $10k-25k, 1.0% for AGIs $25k-50k, 0.7% for AGIs $50k-75k, 0.6% for AGIs $75k-100k, 0.5% for AGIs over 100k)
Taxable dividends: $1,662 (reported on 13.5% of returns)
Here:
$1,662
State:
$4,306
(% of AGI for various income ranges: 1.1% for AGIs below $10k, 0.6% for AGIs $10k-25k, 0.7% for AGIs $25k-50k, 0.9% for AGIs $50k-75k, 0.1% for AGIs $75k-100k, 1.2% for AGIs over 100k)
Net capital gain/loss: +$1,488 (reported on 10.7% of returns)
Here:
+$1,488
State:
+$17,321
(% of AGI for various income ranges: 1.9% for AGIs below $10k, 0.2% for AGIs $10k-25k, 0.6% for AGIs $25k-50k, 0.6% for AGIs $50k-75k, 0.9% for AGIs $75k-100k)
Profit/loss from business: +$4,087 (reported on 12.6% of returns)
Here:
+$4,087
State:
+$11,771
(% of AGI for various income ranges: 5.3% for AGIs below $10k, 3.8% for AGIs $10k-25k, 0.2% for AGIs $25k-50k, 2.9% for AGIs $50k-75k)
Profit/loss from farming: +$316 (reported on 6.4% of returns)
Here:
+$316
State:
+$2,327
(% of AGI for various income ranges: 11.7% for AGIs below $10k, -1.0% for AGIs $25k-50k, 0.2% for AGIs $50k-75k, -0.4% for AGIs $75k-100k)
IRA payment deduction: $1,417 (reported on 1.0% of returns)
62910:
$1,417
Illinois:
$3,087
Total itemized deductions: $14,423 (26% of AGI, reported on 13.8% of returns)
Here:
$14,423
State:
$20,239
Here:
25.9% of AGI
State:
19.5% of AGI
(% of AGI for various income ranges: 5.8% for AGIs $10k-25k, 5.7% for AGIs $25k-50k, 7.6% for AGIs $50k-75k, 6.5% for AGIs $75k-100k, 10.8% for AGIs over 100k)
Charity contributions deductions: $3,071 (5% of AGI, reported on 11.9% of returns)
Here:
$3,071
State:
$3,719
Here:
5.3% of AGI
State:
3.4% of AGI
(% of AGI for various income ranges: 0.5% for AGIs $10k-25k, 0.8% for AGIs $25k-50k, 1.7% for AGIs $50k-75k, 1.3% for AGIs $75k-100k, 2.8% for AGIs over 100k)
Total tax: $3,269 (reported on 68.0% of returns)
62910:
$3,269
State:
$9,882
(% of AGI for various income ranges: 3.3% for AGIs below $10k, 3.3% for AGIs $10k-25k, 5.5% for AGIs $25k-50k, 8.6% for AGIs $50k-75k, 10.9% for AGIs $75k-100k, 15.3% for AGIs over 100k)
Earned income credit: $1,767 (reported on 25.8% of returns)
Here:
$1,767
State:
$1,788
Percentage of individuals using paid preparers for their 2004 taxes: 65.8%
Here:
66%
State:
61%
(% for various income ranges: 63.0% for AGIs below $10k, 66.3% for AGIs $10k-25k, 68.9% for AGIs $25k-50k, 64.9% for AGIs $50k-75k, 66.0% for AGIs $75k-100k, 60.0% for AGIs over 100k)
Likely homosexual households (counted as self-reported same-sex unmarried-partner households)
Lesbian couples: 0.0% of all households
Gay men: 1.0% of all households
Household received Food Stamps/SNAP in the past 12 months: 163 Household did not receive Food Stamps/SNAP in the past 12 months: 644
Women who had a birth in the past 12 months: 32 (32 now married, 0 unmarried) Women who did not have a birth in the past 12 months: 401 (149 now married, 251 unmarried)
Housing units in zip code 62910 with a mortgage: 254 (15 second mortgage, 15 both second mortgage and home equity loan) Median monthly owner costs for units with a mortgage: $1,068 Median monthly owner costs for units without a mortgage: $415
Residents with income below the poverty level in 2022:
This zip code:
20.6%
Whole state:
11.9%
Residents with income below 50% of the poverty level in 2022:
This zip code:
10.5%
Whole state:
5.7%
Median number of rooms in houses and condos:
Here:
5.6
State:
6.4
Median number of rooms in apartments:
Here:
4.3
State:
4.1
Notable locations in this zip code not listed on our city pages
Notable locations in zip code 62910: Paducah and Illinois Fishing Camp (A), Pearcy Camp (B), Rural Pope County Fire Protection District Station 3 (C), Massac County Fire Protection District Station 2 (D), Brookport Fire Department (E). Display/hide their locations on the map
Churches in zip code 62910 include: Audubon Church (A), Brookport United Methodist Church (B), Church of Christ (C), Church of God (D), Unity Missionary Baptist Church (E), Siloam Church (F), Mount Sterling Church (G), Little Rock Church (H). Display/hide their locations on the map
Cemeteries: Allard Cemetery (1), Bethel Cemetery (2), Keckolie Cemetery (3), Lewis Cemetery (4), Howard Cemetery (5), Owens Cemetery (6), Vickers Cemetery (7). Display/hide their locations on the map
Lakes, reservoirs, and swamps: Allard Lake (A), Avery Lake (B), Beaverdam Lake (C), Loon Lake (D), Kinneman Lake (E), Brushy Lake (F), Burgess Pond (G), Mann Lake (H). Display/hide their locations on the map
Size of family households: 254 2-persons, 44 3-persons, 145 4-persons, 15 5-persons, 6 6-persons, 35 7-or-more-persons
Size of nonfamily households: 224 1-person, 45 2-persons, 32 3-persons
303 married couples with children.
136 single-parent households (19 men, 117 women).
96.2% of residents of 62910 zip code speak English at home.
2.9% of residents speak Spanish at home (98% very well, 2% not well).
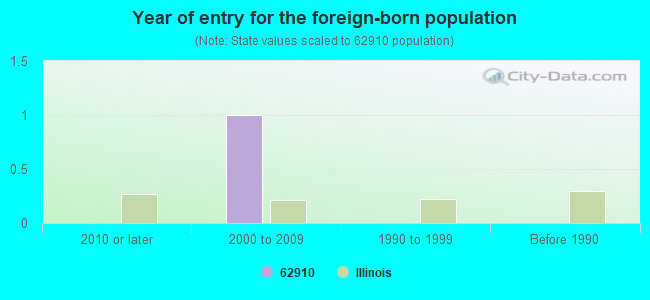
Foreign born population: 0 (0.0%)
:
0.0%
Whole state:
14.4%
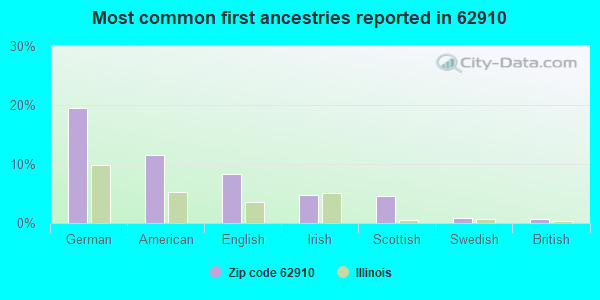
19%German
11%American
8%English
5%Irish
5%Scottish
1%Swedish
1%British
Year of entry for the foreign-born population
02010 or later
12000 to 2009
01990 to 1999
0Before 1990
Facilities with environmental interests located in this zip code:
METAL TRADERS INC (6690 UNIONVILLE RD. in BROOKPORT, IL)
STATE MASTER (Illinois EPA Project) - AIR PROGRAM AIR MINOR (AIRS/AFS) Business SIC classification: NONCLASSIFIABLE ESTABLISHMENTS
MASSAC CO PRE-KNDRGRTN/BROOKPORT (PO BOX 278 in BROOKPORT, IL)
(National Center for Education Statistics) - STATE ID-0206100103002 Organizations: MASSAC UNIT DISTRICT #1 (SCHOOL DISTRICT)
Housing units lacking complete plumbing facilities: 17.0% Housing units lacking complete kitchen facilities: 1.4%
48.5%Electricity
29.0%Bottled, tank, or LP gas
22.6%Utility gas
Population in 1990: 2,565. Population change in the 1990s: +160 (+6.2%).
Place of birth for U.S.-born residents:
This state: 830
Northeast: 66
Midwest: 186
South: 910
West: 97
62% of the 62910 zip code residents lived in the same house 5 years ago. Out of people who lived in different houses, 55% lived in this county. Out of people who lived in different counties, 50% lived in Illinois.
92% of the 62910 zip code residents lived in the same house 1 year ago. Out of people who lived in different houses, 15% moved from this county. Out of people who lived in different houses, 78% moved from different county within same state. Out of people who lived in different houses, 9% moved from different state. Out of people who lived in different houses, 3% moved from abroad.
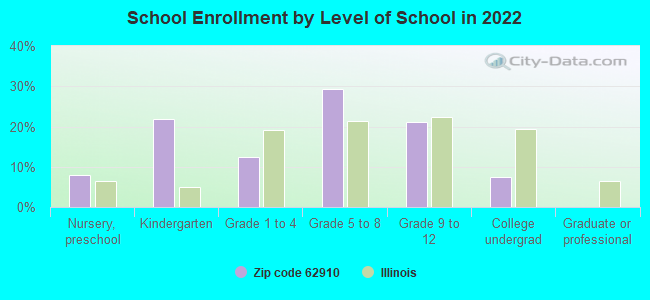
Private vs. public school enrollment:
Students in private schools in grades 1 to 8 (elementary and middle school): 30
Here:
16.1%
Illinois:
13.3%
Students in private schools in grades 9 to 12 (high school): 36
Here:
38.4%
Illinois:
9.9%
Students in private undergraduate colleges:
Here:
0.0%
Illinois:
27.4%
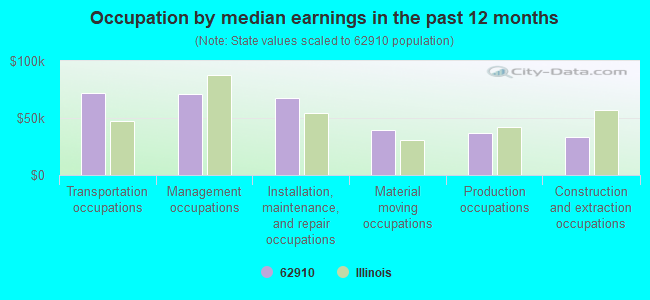
Occupation by median earnings in the past 12 months ($)
71,715Transportation occupations
71,023Management occupations
67,355Installation, maintenance, and repair occupations
39,718Material moving occupations
37,008Production occupations
33,114Construction and extraction occupations
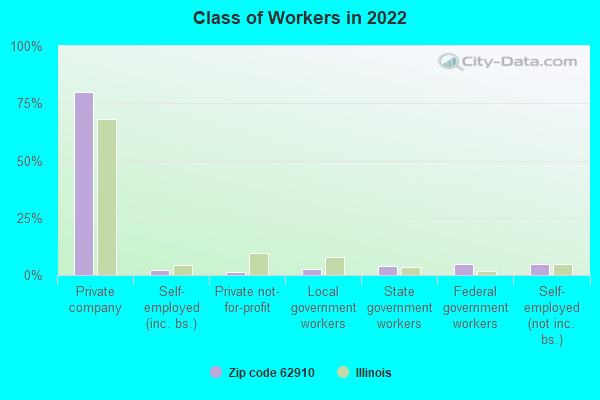
Top industries in this zip code by the number of employees in 2005:
Finance and Insurance: Commercial Banking (5-9 employees: 1 establishment)
Other Services (except Public Administration): Religious Organizations (1-4: 2)
Other Services (except Public Administration): Beauty Salons (1-4: 1)
Wholesale Trade: Tire and Tube Merchant Wholesalers (1-4: 1)
Health Care and Social Assistance: Offices of Chiropractors (1-4: 1)
Construction: Drywall and Insulation Contractors (1-4: 1)
Accommodation and Food Services: Hotels (except Casino Hotels) and Motels (1-4: 1)
Accommodation and Food Services: Full-Service Restaurants (1-4: 1)
Fatal accident statistics in 2011:
Fatal accident count: 1
Vehicles involved in fatal accidents: 2
Fatal accidents caused by drunken drivers: 0
Fatalities: 1
Persons involved in fatal accidents: 2
Pedestrians involved in fatal accidents: 0
Fatal accident statistics in 2010:
Fatal accident count: 1
Vehicles involved in fatal accidents: 1
Fatal accidents caused by drunken drivers: 1
Fatalities: 1
Persons involved in fatal accidents: 1
Pedestrians involved in fatal accidents: 0
2002 - 2018 National Fire Incident Reporting System (NFIRS) incidents
Based on the data from the years 2002 - 2018 the average number of fires per year is 27. The highest number of fire incidents - 50 took place in 2017, and the least - 2 in 2002. The data has a growing trend.
When looking into fire subcategories, the most incidents belonged to: Outside Fires (38.8%), and Structure Fires (37.1%).
Fire incident types reported to NFIRS in Zip Code 62910

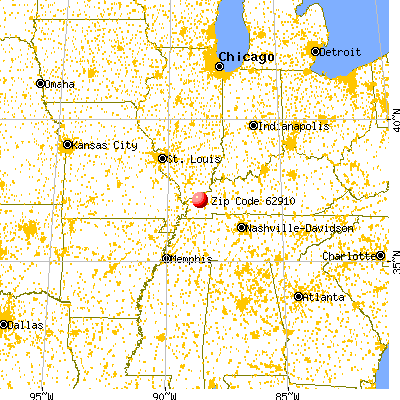


 Nearest zip codes: 42058, 42081, 42003, 62960, 42047, 42029.


 Based on the data from the years 2002 - 2018 the average number of fires per year is 27. The highest number of fire incidents - 50 took place in 2017, and the least - 2 in 2002. The data has a growing trend.
 When looking into fire subcategories, the most incidents belonged to: Outside Fires (38.8%), and Structure Fires (37.1%).