Estimated zip code population in 2022: 689 Zip code population in 2010: 603 Zip code population in 2000: 685
Houses and condos: 341 Renter-occupied apartments: 33
% of renters here:
13%
State:
32%
March 2022 cost of living index in zip code 63373: 86.3 (less than average, U.S. average is 100)
Land area: 16.6 sq. mi. Water area: 3.1 sq. mi.
Population density: 42 people per square mile
(very low).
OSM Map
General Map
Google Map
MSN Map
OSM Map
General Map
Google Map
MSN Map
OSM Map
General Map
Google Map
MSN Map
OSM Map
General Map
Google Map
MSN Map
Please wait while loading the map...
Real estate property taxes paid for housing units in 2022:
This zip code:
1.0% ($2,267)
Missouri:
0.8% ($1,810)
Median real estate property taxes paid for housing units with mortgages in 2022: $2,337 (0.9%) Median real estate property taxes paid for housing units with no mortgage in 2022: $1,895 (1.2%)
Business Search- 14 Million verified businesses
Males: 340
(49.4%)
Females: 348
(50.6%)
For population 25 years and over in 63373:
High school or higher: 95.3%
Bachelor's degree or higher: 26.2%
Graduate or professional degree: 11.9%
Unemployed: 1.6%
Mean travel time to work (commute): 24.9 minutes
For population 15 years and over in 63373:
Never married: 26.6%
Now married: 62.7%
Separated: 0.0%
Widowed: 4.8%
Divorced: 6.0%
Zip code 63373 compared to state average:
Unemployed percentage below state average.
Black race population percentage significantly below state average.
Median age above state average.
Foreign-born population percentage significantly below state average.
Renting percentage significantly below state average.
Length of stay since moving in significantly above state average.
Estimated median house/condo value in 2022: $218,759
63373:
$218,759
Missouri:
$221,200
According to our research of Missouri and other state lists, there was 1 registered sex offender living in 63373 zip code as of June 15, 2024. The ratio of all residents to sex offenders in zip code 63373 is 545 to 1. The ratio of registered sex offenders to all residents in this zip code is lower than the state average.
Median resident age:
This zip code:
46.2 years
Missouri median age:
39.1 years
Average household size:
This zip code:
2.6 people
Missouri:
2.4 people
Averages for the 2020 tax year for zip code 63373, filed in 2021:
Average Adjusted Gross Income (AGI) in 2020: $59,457 (Individual Income Tax Returns)
Here:
$59,457
State:
$68,151
Salary/wage: $52,900 (reported on 76.7% of returns)
Here:
$52,900
State:
$56,131
(% of AGI for various income ranges: 1428.0% for AGIs below $25k, 3503.3% for AGIs $25k-50k, 7310.0% for AGIs $50k-75k, 9530.0% for AGIs $75k-100k, 25150.0% for AGIs $100k-200k)
Taxable interest for individuals: $488 (reported on 26.7% of returns)
This zip code:
$488
Missouri:
$1,586
(% of AGI for various income ranges: 8.0% for AGIs below $25k, 10.0% for AGIs $50k-75k, 165.0% for AGIs $100k-200k)
Ordinary dividends: $2,160 (reported on 16.7% of returns)
Here:
$2,160
State:
$10,947
(% of AGI for various income ranges: 100.0% for AGIs $25k-50k, 160.0% for AGIs $75k-100k)
Net capital gain/loss in AGI: +$2,940 (reported on 16.7% of returns)
Here:
+$2,940
State:
+$18,453
(% of AGI for various income ranges: 122.0% for AGIs below $25k, 286.7% for AGIs $75k-100k)
Profit/loss from business: +$3,867 (reported on 10.0% of returns)
Here:
+$3,867
State:
+$12,260
(% of AGI for various income ranges: 193.3% for AGIs $25k-50k)
Taxable individual retirement arrangement distribution: $10,233 (reported on 10.0% of returns)
63373:
$10,233
Missouri:
$19,719
(% of AGI for various income ranges: 511.7% for AGIs $25k-50k)
Earned income credit: $2,150 (reported on 13.3% of returns)
Here:
$2,150
State:
$2,315
(% of AGI for various income ranges: 172.0% for AGIs below $25k)
Percentage of individuals using paid preparers for their 2020 taxes: 93.3%
Here:
93%
State:
93%
(% for various income ranges: 88.9% for AGIs below $25k, 87.5% for AGIs $25k-50k, 100.0% for AGIs $50k-75k, 100.0% for AGIs $75k-100k, 100.0% for AGIs $100k-200k)
Averages for the 2012 tax year for zip code 63373, filed in 2013:
Average Adjusted Gross Income (AGI) in 2012: $48,672 (Individual Income Tax Returns)
Here:
$48,672
State:
$55,896
Salary/wage: $42,759 (reported on 84.4% of returns)
Here:
$42,759
State:
$46,205
(% of AGI for various income ranges: 73.1% for AGIs below $25k, 78.8% for AGIs $25k-50k, 75.2% for AGIs $50k-75k, 75.8% for AGIs $75k-100k, 70.6% for AGIs $100k-200k)
Taxable interest for individuals: $800 (reported on 31.2% of returns)
This zip code:
$800
Missouri:
$1,559
(% of AGI for various income ranges: 0.8% for AGIs below $25k, 0.3% for AGIs $50k-75k, 1.1% for AGIs $100k-200k)
Ordinary dividends: $867 (reported on 28.1% of returns)
Here:
$867
State:
$7,410
(% of AGI for various income ranges: 2.0% for AGIs below $25k, 0.8% for AGIs $50k-75k, 0.5% for AGIs $100k-200k)
Net capital gain/loss in AGI: +$433 (reported on 18.8% of returns)
Here:
+$433
State:
+$11,579
Profit/loss from business: +$4,050 (reported on 12.5% of returns)
Here:
+$4,050
State:
+$11,688
Taxable individual retirement arrangement distribution: $10,550 (reported on 6.2% of returns)
63373:
$10,550
Missouri:
$14,773
Total itemized deductions: $17,022 (21% of AGI, reported on 28.1% of returns)
Here:
$17,022
State:
$22,730
Here:
21.1% of AGI
State:
19.2% of AGI
(% of AGI for various income ranges: 19.9% for AGIs below $25k, 17.5% for AGIs $50k-75k, 12.4% for AGIs $100k-200k)
Charity contributions: $2,214 (reported on 21.9% of returns)
Here:
$2,214
State:
$4,745
Taxes paid: $5,744 (reported on 28.1% of returns)
63373:
$5,744
State:
$8,399
(% of AGI for various income ranges: 4.6% for AGIs below $25k, 5.9% for AGIs $50k-75k, 4.7% for AGIs $100k-200k)
Earned income credit: $1,840 (reported on 15.6% of returns)
Here:
$1,840
State:
$2,288
(% of AGI for various income ranges: 6.3% for AGIs below $25k)
Percentage of individuals using paid preparers for their 2012 taxes: 59.4%
Here:
59%
State:
55%
(% for various income ranges: 50.0% for AGIs below $25k, 62.5% for AGIs $25k-50k, 60.0% for AGIs $50k-75k, 66.7% for AGIs $75k-100k, 75.0% for AGIs $100k-200k)
Averages for the 2004 tax year for zip code 63373, filed in 2005:
Average Adjusted Gross Income (AGI) in 2004: $40,794 (Individual Income Tax Returns)
Here:
$40,794
State:
$44,591
Salary/wage: $36,706 (reported on 86.2% of returns)
Here:
$36,706
State:
$38,941
(% of AGI for various income ranges: 84.8% for AGIs below $10k, 67.0% for AGIs $10k-25k, 87.0% for AGIs $25k-50k, 73.4% for AGIs $50k-75k, 84.1% for AGIs $75k-100k, 68.4% for AGIs over 100k)
Taxable interest for individuals: $1,333 (reported on 40.6% of returns)
This zip code:
$1,333
Missouri:
$1,801
(% of AGI for various income ranges: 4.8% for AGIs below $10k, 1.4% for AGIs $10k-25k, 0.4% for AGIs $25k-50k, 3.4% for AGIs $50k-75k, 0.2% for AGIs $75k-100k, 0.3% for AGIs over 100k)
Taxable dividends: $966 (reported on 25.9% of returns)
Here:
$966
State:
$3,677
(% of AGI for various income ranges: 3.0% for AGIs below $10k, 1.2% for AGIs $10k-25k, 0.3% for AGIs $25k-50k, 0.9% for AGIs $50k-75k, 0.2% for AGIs $75k-100k, 0.3% for AGIs over 100k)
Net capital gain/loss: +$1,200 (reported on 16.2% of returns)
Here:
+$1,200
State:
+$8,915
(% of AGI for various income ranges: -5.2% for AGIs below $10k, 0.7% for AGIs $10k-25k, -0.1% for AGIs $50k-75k, 2.8% for AGIs $75k-100k)
Profit/loss from business: +$3,714 (reported on 10.3% of returns)
Here:
+$3,714
State:
+$9,793
Profit/loss from farming: +$3,429 (reported on 6.2% of returns)
Here:
+$3,429
State:
-$5,056
Total itemized deductions: $13,583 (21% of AGI, reported on 28.2% of returns)
Here:
$13,583
State:
$18,261
Here:
20.5% of AGI
State:
20.5% of AGI
(% of AGI for various income ranges: 11.6% for AGIs $25k-50k, 9.1% for AGIs $50k-75k, 13.4% for AGIs $75k-100k, 9.0% for AGIs over 100k)
Charity contributions deductions: $1,526 (2% of AGI, reported on 22.9% of returns)
Here:
$1,526
State:
$3,665
Here:
2.2% of AGI
State:
3.9% of AGI
(% of AGI for various income ranges: 0.6% for AGIs $25k-50k, 1.2% for AGIs $50k-75k, 0.8% for AGIs $75k-100k, 1.3% for AGIs over 100k)
Total tax: $4,846 (reported on 84.1% of returns)
63373:
$4,846
State:
$6,999
(% of AGI for various income ranges: 1.9% for AGIs below $10k, 5.8% for AGIs $10k-25k, 8.0% for AGIs $25k-50k, 10.3% for AGIs $50k-75k, 9.7% for AGIs $75k-100k, 16.2% for AGIs over 100k)
Earned income credit: $1,357 (reported on 8.2% of returns)
Here:
$1,357
State:
$1,728
Percentage of individuals using paid preparers for their 2004 taxes: 65.3%
Here:
65%
State:
62%
(% for various income ranges: 55.0% for AGIs below $10k, 62.0% for AGIs $10k-25k, 71.9% for AGIs $25k-50k, 70.7% for AGIs $50k-75k, 60.0% for AGIs $75k-100k, 70.6% for AGIs over 100k)
Likely homosexual households (counted as self-reported same-sex unmarried-partner households)
Lesbian couples: 0.7% of all households
Gay men: 0.0% of all households
Household received Food Stamps/SNAP in the past 12 months: 13 Household did not receive Food Stamps/SNAP in the past 12 months: 252
Women who had a birth in the past 12 months: 7 (7 now married, 0 unmarried) Women who did not have a birth in the past 12 months: 144 (61 now married, 83 unmarried)
Housing units in zip code 63373 with a mortgage: 163 (9 second mortgage, 4 both second mortgage and home equity loan) Houses without a mortgage: 2
Median monthly owner costs for units with a mortgage: $1,540 Median monthly owner costs for units without a mortgage: $604
Residents with income below the poverty level in 2022:
This zip code:
7.8%
Whole state:
13.2%
Residents with income below 50% of the poverty level in 2022:
This zip code:
3.1%
Whole state:
6.8%
Median number of rooms in houses and condos:
Here:
5.4
State:
6.4
Median number of rooms in apartments:
Here:
4.9
State:
4.4
Notable locations in this zip code not listed on our city pages
Size of family households: 75 2-persons, 78 3-persons, 50 4-persons, 9 5-persons
Size of nonfamily households: 45 1-person, 4 2-persons
79 married couples with children.
21 single-parent households (6 men, 15 women).
98.5% of residents of 63373 zip code speak English at home.
0.8% of residents speak other Indo-European language at home (100% very well).
0.3% of residents speak Asian or Pacific Island language at home (100% very well).
Foreign born population: 7 (1.1%) (62.8% of them are naturalized citizens)
This zip code:
1.1%
Whole state:
4.1%
57%Bulgaria
43%Malaysia
70%German
9%Irish
4%American
3%Croatian
3%Italian
1%European
0%English
Year of entry for the foreign-born population
32010 or later
02000 to 2009
01990 to 1999
6Before 1990
Facilities with environmental interests located in this zip code:
PORTAGE DES SIOUX (PORTAGE DES SIOUX in PORTAGE DES SIOUX, MO)
STATE MASTER (Missouri monitoring and compilance) - PCS-MO0107328, NPDES NON-MAJOR National Pollutant Discharge Elimination System NON-MAJOR (Tracking pollutant discharge elimination systems) - permit Business SIC classification: SEWERAGE SYSTEMS Alternative names: PORTAGE DES SIOUX WWTP
HAMPTON AMUSEMENT RIDES (7330 WEBER LAKE RD in PORTAGE DES SIOUX, MO)
STATE MASTER (Missouri monitoring and compilance) - RCRAINFO-MOD985773696, NOT IN A UNIVERSE (Resource Conservation and Recovery Act (tracking hazardous waste)) Business NAICS classification: OTHER COMMERCIAL AND SERVICE INDUSTRY MACHINERY MANUFACTURING. Organizations: CARL MATHIS (CONTACT/OWNER)
PALISADES YACHT CLUB (1670 RIVERVIEW DR in PORTAGE DES SIOUX, MO)
Small Quantity Generators, between 100 kg and 1000 kg of hazardous waste/month (Resource Conservation and Recovery Act (tracking hazardous waste)) Organizations: DALE SKRABACZ (CONTACT/OPERATOR)
Housing units lacking complete plumbing facilities: 7.8% Housing units lacking complete kitchen facilities: 5.3%
48.0%Bottled, tank, or LP gas
46.1%Electricity
3.1%Utility gas
1.9%Fuel oil, kerosene, etc.
0.8%Wood
Population in 1990: 777.
Place of birth for U.S.-born residents:
This state: 577
Midwest: 67
South: 14
West: 18
70% of the 63373 zip code residents lived in the same house 5 years ago. Out of people who lived in different houses, 59% lived in this county. Out of people who lived in different counties, 50% lived in Missouri.
89% of the 63373 zip code residents lived in the same house 1 year ago. Out of people who lived in different houses, 25% moved from this county. Out of people who lived in different houses, 42% moved from different county within same state. Out of people who lived in different houses, 33% moved from different state.
Private vs. public school enrollment:
Students in private schools in grades 1 to 8 (elementary and middle school): 14
Here:
31.0%
Missouri:
15.4%
Students in private schools in grades 9 to 12 (high school):
Here:
0.0%
Missouri:
13.9%
Students in private undergraduate colleges: 1
Here:
4.0%
Missouri:
22.6%
Occupation by median earnings in the past 12 months ($)
91,048Business and financial operations occupations
59,822Management occupations
50,478Installation, maintenance, and repair occupations
48,343Sales and related occupations
36,402Transportation occupations
33,881Construction and extraction occupations
Top industries in this zip code by the number of employees in 2005:
Arts, Entertainment, and Recreation: Marinas (1-4 employees: 3 establishments)
Accommodation and Food Services: Full-Service Restaurants (1-4: 2)
Finance and Insurance: Insurance Agencies and Brokerages (1-4: 1)
Real Estate and Rental and Leasing: Lessors of Other Real Estate Property (1-4: 1)
Wholesale Trade: Wholesale Trade Agents and Brokers (1-4: 1)
Educational Services: Elementary and Secondary Schools (1-4: 1)
Health Care and Social Assistance: Home Health Care Services (1-4: 1)
Construction: Residential Remodelers (1-4: 1)
Fatal accident statistics in 2012:
Fatal accident count: 1
Vehicles involved in fatal accidents: 1
Fatal accidents caused by drunken drivers: 1
Fatalities: 1
Persons involved in fatal accidents: 1
Pedestrians involved in fatal accidents: 0
Home Mortgage Disclosure Act Aggregated Statistics For Year 2009 (Based on 10 partial tracts)
A) FHA, FSA/RHS & VA Home Purchase Loans
B) Conventional Home Purchase Loans
C) Refinancings
D) Home Improvement Loans
F) Non-occupant Loans on < 5 Family Dwellings (A B C & D)
Number
Average Value
Number
Average Value
Number
Average Value
Number
Average Value
Number
Average Value
LOANS ORIGINATED
3
$97,793
2
$85,250
16
$142,008
0
$0
1
$39,170
APPLICATIONS APPROVED, NOT ACCEPTED
0
$0
0
$0
2
$71,810
0
$0
0
$0
APPLICATIONS DENIED
2
$79,870
1
$81,410
11
$122,845
2
$43,200
0
$0
APPLICATIONS WITHDRAWN
1
$83,710
0
$0
9
$129,322
0
$0
0
$0
FILES CLOSED FOR INCOMPLETENESS
0
$0
0
$0
2
$110,785
0
$0
0
$0
Aggregated Statistics For Year 2008 (Based on 10 partial tracts)
A) FHA, FSA/RHS & VA Home Purchase Loans
B) Conventional Home Purchase Loans
C) Refinancings
D) Home Improvement Loans
F) Non-occupant Loans on < 5 Family Dwellings (A B C & D)
G) Loans On Manufactured Home Dwelling (A B C & D)
Number
Average Value
Number
Average Value
Number
Average Value
Number
Average Value
Number
Average Value
Number
Average Value
LOANS ORIGINATED
0
$0
6
$148,543
17
$142,622
2
$11,710
1
$76,030
0
$0
APPLICATIONS APPROVED, NOT ACCEPTED
0
$0
1
$77,570
2
$152,065
0
$0
0
$0
0
$0
APPLICATIONS DENIED
1
$100,990
5
$103,834
9
$123,136
2
$9,985
1
$105,980
1
$70,270
APPLICATIONS WITHDRAWN
0
$0
0
$0
4
$176,928
0
$0
0
$0
0
$0
FILES CLOSED FOR INCOMPLETENESS
0
$0
0
$0
2
$94,270
0
$0
0
$0
0
$0
Aggregated Statistics For Year 2007 (Based on 10 partial tracts)
A) FHA, FSA/RHS & VA Home Purchase Loans
B) Conventional Home Purchase Loans
C) Refinancings
D) Home Improvement Loans
F) Non-occupant Loans on < 5 Family Dwellings (A B C & D)
G) Loans On Manufactured Home Dwelling (A B C & D)
Number
Average Value
Number
Average Value
Number
Average Value
Number
Average Value
Number
Average Value
Number
Average Value
LOANS ORIGINATED
2
$115,390
11
$141,661
19
$134,521
3
$42,880
3
$97,920
0
$0
APPLICATIONS APPROVED, NOT ACCEPTED
1
$160,510
2
$124,800
7
$123,539
1
$85,630
0
$0
0
$0
APPLICATIONS DENIED
1
$117,890
3
$139,393
20
$105,792
2
$19,010
1
$57,600
1
$61,060
APPLICATIONS WITHDRAWN
0
$0
2
$149,760
7
$120,740
1
$76,800
1
$51,070
0
$0
FILES CLOSED FOR INCOMPLETENESS
0
$0
1
$92,930
2
$116,160
0
$0
0
$0
0
$0
Aggregated Statistics For Year 2006 (Based on 10 partial tracts)
A) FHA, FSA/RHS & VA Home Purchase Loans
B) Conventional Home Purchase Loans
C) Refinancings
D) Home Improvement Loans
F) Non-occupant Loans on < 5 Family Dwellings (A B C & D)
G) Loans On Manufactured Home Dwelling (A B C & D)
Number
Average Value
Number
Average Value
Number
Average Value
Number
Average Value
Number
Average Value
Number
Average Value
LOANS ORIGINATED
1
$96,770
19
$158,532
27
$103,737
3
$77,953
4
$121,920
0
$0
APPLICATIONS APPROVED, NOT ACCEPTED
0
$0
5
$111,052
8
$82,656
1
$9,980
0
$0
1
$62,210
APPLICATIONS DENIED
0
$0
7
$81,243
17
$98,936
3
$34,433
1
$32,640
1
$73,730
APPLICATIONS WITHDRAWN
0
$0
3
$88,703
10
$139,085
0
$0
0
$0
0
$0
FILES CLOSED FOR INCOMPLETENESS
0
$0
2
$100,800
2
$176,640
1
$83,710
0
$0
0
$0
Aggregated Statistics For Year 2005 (Based on 10 partial tracts)
A) FHA, FSA/RHS & VA Home Purchase Loans
B) Conventional Home Purchase Loans
C) Refinancings
D) Home Improvement Loans
F) Non-occupant Loans on < 5 Family Dwellings (A B C & D)
G) Loans On Manufactured Home Dwelling (A B C & D)
Number
Average Value
Number
Average Value
Number
Average Value
Number
Average Value
Number
Average Value
Number
Average Value
LOANS ORIGINATED
1
$139,010
18
$92,587
30
$96,832
5
$50,150
3
$114,303
0
$0
APPLICATIONS APPROVED, NOT ACCEPTED
0
$0
5
$85,094
5
$76,876
0
$0
0
$0
1
$41,860
APPLICATIONS DENIED
0
$0
6
$77,697
15
$97,639
3
$23,297
2
$43,390
2
$39,360
APPLICATIONS WITHDRAWN
0
$0
7
$120,960
15
$104,857
0
$0
2
$109,055
0
$0
FILES CLOSED FOR INCOMPLETENESS
0
$0
0
$0
2
$86,590
0
$0
0
$0
0
$0
Aggregated Statistics For Year 2004 (Based on 10 partial tracts)
A) FHA, FSA/RHS & VA Home Purchase Loans
B) Conventional Home Purchase Loans
C) Refinancings
D) Home Improvement Loans
F) Non-occupant Loans on < 5 Family Dwellings (A B C & D)
G) Loans On Manufactured Home Dwelling (A B C & D)
Number
Average Value
Number
Average Value
Number
Average Value
Number
Average Value
Number
Average Value
Number
Average Value
LOANS ORIGINATED
3
$100,863
14
$100,279
33
$90,287
3
$28,927
3
$85,887
1
$41,860
APPLICATIONS APPROVED, NOT ACCEPTED
0
$0
3
$97,407
7
$89,253
0
$0
0
$0
1
$77,950
APPLICATIONS DENIED
0
$0
8
$71,232
17
$84,119
3
$32,127
1
$96,380
3
$60,033
APPLICATIONS WITHDRAWN
0
$0
2
$114,430
12
$91,392
1
$72,580
0
$0
0
$0
FILES CLOSED FOR INCOMPLETENESS
0
$0
0
$0
3
$125,697
0
$0
0
$0
0
$0
Aggregated Statistics For Year 2003 (Based on 10 partial tracts)
A) FHA, FSA/RHS & VA Home Purchase Loans
B) Conventional Home Purchase Loans
C) Refinancings
D) Home Improvement Loans
F) Non-occupant Loans on < 5 Family Dwellings (A B C & D)


+$3,429
-$5,056
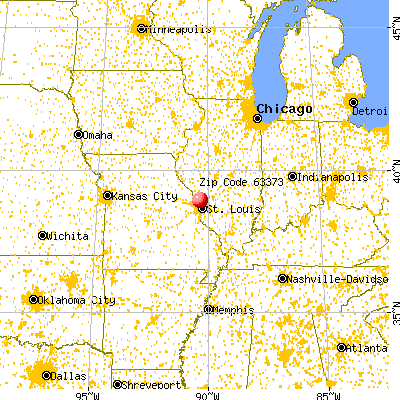
 Nearest zip codes: 62028, 62022, 63301, 62037, 63031, 63034.


