Estimated zip code population in 2022: 2,157 Zip code population in 2010: 2,004 Zip code population in 2000: 1,858
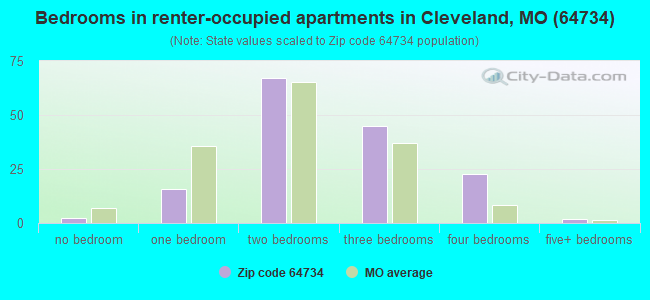
Houses and condos: 830 Renter-occupied apartments: 154
% of renters here:
20%
State:
32%
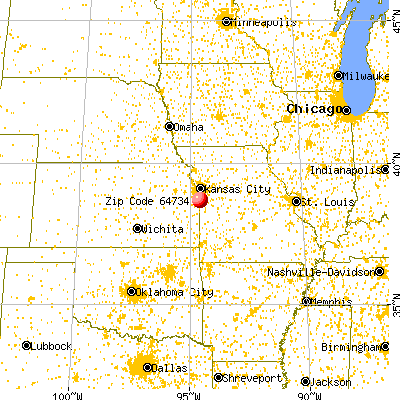
March 2022 cost of living index in zip code 64734: 78.2 (low, U.S. average is 100)
Land area: 42.8 sq. mi. Water area: 0.2 sq. mi.
Population density: 50 people per square mile
(very low).
OSM Map
General Map
Google Map
MSN Map
OSM Map
General Map
Google Map
MSN Map
OSM Map
General Map
Google Map
MSN Map
OSM Map
General Map
Google Map
MSN Map
Please wait while loading the map...
Real estate property taxes paid for housing units in 2022:
This zip code:
0.8% ($2,570)
Missouri:
0.8% ($1,810)
Median real estate property taxes paid for housing units with mortgages in 2022: $2,568 (0.7%) Median real estate property taxes paid for housing units with no mortgage in 2022: $2,587 (1.1%)
Business Search- 14 Million verified businesses
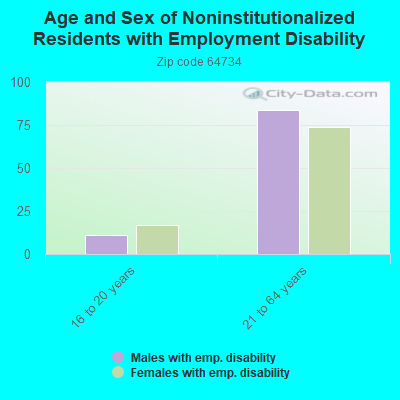
Males: 990
(45.9%)
Females: 1,167
(54.1%)
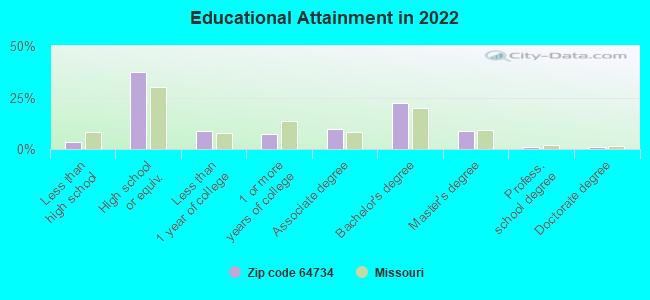
For population 25 years and over in 64734:
High school or higher: 96.5%
Bachelor's degree or higher: 32.6%
Graduate or professional degree: 10.2%
Unemployed: 2.2%
Mean travel time to work (commute): 36.1 minutes
For population 15 years and over in 64734:
Never married: 17.2%
Now married: 59.5%
Separated: 1.8%
Widowed: 4.8%
Divorced: 16.7%
Zip code 64734 compared to state average:
Black race population percentage significantly below state average.
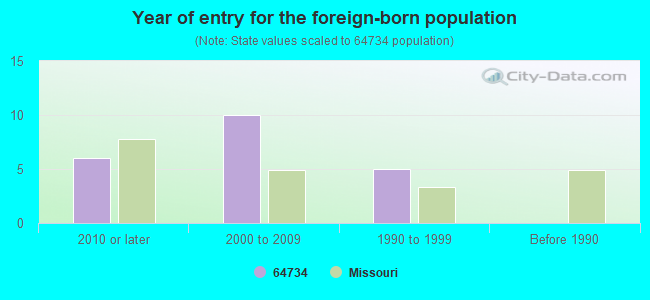
Foreign-born population percentage significantly below state average.
Renting percentage below state average.
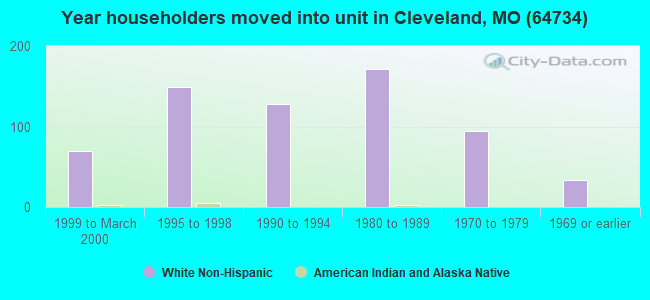
Length of stay since moving in significantly above state average.
Estimated median house/condo value in 2022: $309,392
64734:
$309,392
Missouri:
$221,200
According to our research of Missouri and other state lists, there were 5 registered sex offenders living in 64734 zip code as of June 15, 2024. The ratio of all residents to sex offenders in zip code 64734 is 383 to 1. The ratio of registered sex offenders to all residents in this zip code is near the state average.
Median resident age:
This zip code:
41.1 years
Missouri median age:
39.1 years
Average household size:
This zip code:
2.8 people
Missouri:
2.4 people
Averages for the 2020 tax year for zip code 64734, filed in 2021:
Average Adjusted Gross Income (AGI) in 2020: $72,657 (Individual Income Tax Returns)
Here:
$72,657
State:
$68,151
Salary/wage: $63,353 (reported on 79.8% of returns)
Here:
$63,353
State:
$56,131
(% of AGI for various income ranges: 1140.0% for AGIs below $25k, 3675.0% for AGIs $25k-50k, 6368.2% for AGIs $50k-75k, 10072.5% for AGIs $75k-100k, 18060.0% for AGIs $100k-200k)
Taxable interest for individuals: $889 (reported on 38.4% of returns)
This zip code:
$889
Missouri:
$1,586
(% of AGI for various income ranges: 17.2% for AGIs below $25k, 17.9% for AGIs $25k-50k, 63.6% for AGIs $50k-75k, 62.5% for AGIs $75k-100k, 130.0% for AGIs $100k-200k)
Ordinary dividends: $3,660 (reported on 20.2% of returns)
Here:
$3,660
State:
$10,947
(% of AGI for various income ranges: 13.9% for AGIs below $25k, 24.3% for AGIs $25k-50k, 64.5% for AGIs $50k-75k, 46.2% for AGIs $75k-100k, 513.6% for AGIs $100k-200k)
Net capital gain/loss in AGI: +$9,510 (reported on 20.2% of returns)
Here:
+$9,510
State:
+$18,453
(% of AGI for various income ranges: 9.4% for AGIs below $25k, 25.7% for AGIs $25k-50k, 190.0% for AGIs $50k-75k, 162.5% for AGIs $75k-100k, 1372.7% for AGIs $100k-200k)
Profit/loss from business: +$12,825 (reported on 16.2% of returns)
Here:
+$12,825
State:
+$12,260
(% of AGI for various income ranges: 227.2% for AGIs below $25k, 327.9% for AGIs $25k-50k, 341.2% for AGIs $75k-100k, 828.2% for AGIs $100k-200k)
Taxable individual retirement arrangement distribution: $18,692 (reported on 13.1% of returns)
64734:
$18,692
Missouri:
$19,719
(% of AGI for various income ranges: 223.3% for AGIs below $25k, 689.1% for AGIs $50k-75k, 1154.5% for AGIs $100k-200k)
Total itemized deductions: $32,229 (reported on 7.1% of returns)
Here:
$32,229
State:
$36,651
(% of AGI for various income ranges: 874.5% for AGIs $50k-75k, 1176.4% for AGIs $100k-200k)
Charity contributions: $10,050 (reported on 4.0% of returns)
Here:
$10,050
State:
$15,671
(% of AGI for various income ranges: 365.5% for AGIs $100k-200k)
Taxes paid: $7,629 (reported on 7.1% of returns)
64734:
$7,629
State:
$7,608
(% of AGI for various income ranges: 157.3% for AGIs $50k-75k, 328.2% for AGIs $100k-200k)
Earned income credit: $2,180 (reported on 10.1% of returns)
Here:
$2,180
State:
$2,315
(% of AGI for various income ranges: 74.4% for AGIs below $25k, 60.0% for AGIs $25k-50k)
Percentage of individuals using paid preparers for their 2020 taxes: 92.9%
Here:
93%
State:
93%
(% for various income ranges: 92.6% for AGIs below $25k, 94.4% for AGIs $25k-50k, 93.8% for AGIs $50k-75k, 92.3% for AGIs $75k-100k, 90.5% for AGIs $100k-200k, 100.0% for AGIs over 200k)
Averages for the 2012 tax year for zip code 64734, filed in 2013:
Average Adjusted Gross Income (AGI) in 2012: $55,943 (Individual Income Tax Returns)
Here:
$55,943
State:
$55,896
Salary/wage: $50,914 (reported on 83.2% of returns)
Here:
$50,914
State:
$46,205
(% of AGI for various income ranges: 65.5% for AGIs below $25k, 77.4% for AGIs $25k-50k, 73.8% for AGIs $50k-75k, 79.7% for AGIs $75k-100k, 75.5% for AGIs $100k-200k, 76.0% for AGIs over 200k)
Taxable interest for individuals: $750 (reported on 37.9% of returns)
This zip code:
$750
Missouri:
$1,559
(% of AGI for various income ranges: 2.1% for AGIs below $25k, 0.6% for AGIs $25k-50k, 0.4% for AGIs $50k-75k, 0.4% for AGIs $75k-100k, 0.5% for AGIs $100k-200k)
Ordinary dividends: $1,439 (reported on 18.9% of returns)
Here:
$1,439
State:
$7,410
(% of AGI for various income ranges: 1.4% for AGIs below $25k, 0.4% for AGIs $25k-50k, 0.5% for AGIs $50k-75k, 0.4% for AGIs $75k-100k, 0.5% for AGIs $100k-200k)
Net capital gain/loss in AGI: +$764 (reported on 14.7% of returns)
Here:
+$764
State:
+$11,579
(% of AGI for various income ranges: 0.4% for AGIs $25k-50k, 0.4% for AGIs $50k-75k, 0.3% for AGIs $100k-200k)
Profit/loss from business: +$5,319 (reported on 16.8% of returns)
Here:
+$5,319
State:
+$11,688
(% of AGI for various income ranges: 6.0% for AGIs below $25k, 4.6% for AGIs $25k-50k, 2.3% for AGIs $50k-75k, 0.7% for AGIs $75k-100k)
Taxable individual retirement arrangement distribution: $13,273 (reported on 11.6% of returns)
64734:
$13,273
Missouri:
$14,773
(% of AGI for various income ranges: 10.6% for AGIs below $25k, 5.6% for AGIs $50k-75k, 3.6% for AGIs $100k-200k)
Total itemized deductions: $19,585 (21% of AGI, reported on 35.8% of returns)
Here:
$19,585
State:
$22,730
Here:
20.7% of AGI
State:
19.2% of AGI
(% of AGI for various income ranges: 10.6% for AGIs below $25k, 11.0% for AGIs $25k-50k, 12.1% for AGIs $50k-75k, 12.8% for AGIs $75k-100k, 14.3% for AGIs $100k-200k, 11.6% for AGIs over 200k)
Charity contributions: $2,828 (reported on 26.3% of returns)
Here:
$2,828
State:
$4,745
(% of AGI for various income ranges: 0.6% for AGIs below $25k, 1.3% for AGIs $25k-50k, 1.3% for AGIs $50k-75k, 1.0% for AGIs $75k-100k, 2.4% for AGIs $100k-200k)
Taxes paid: $7,382 (reported on 35.8% of returns)
64734:
$7,382
State:
$8,399
(% of AGI for various income ranges: 2.1% for AGIs below $25k, 2.5% for AGIs $25k-50k, 3.7% for AGIs $50k-75k, 5.0% for AGIs $75k-100k, 5.9% for AGIs $100k-200k, 6.9% for AGIs over 200k)
Earned income credit: $1,891 (reported on 11.6% of returns)
Here:
$1,891
State:
$2,288
(% of AGI for various income ranges: 3.7% for AGIs below $25k, 1.0% for AGIs $25k-50k)
Percentage of individuals using paid preparers for their 2012 taxes: 61.1%
Here:
61%
State:
55%
(% for various income ranges: 50.0% for AGIs below $25k, 65.0% for AGIs $25k-50k, 68.8% for AGIs $50k-75k, 69.2% for AGIs $75k-100k, 75.0% for AGIs $100k-200k)
Averages for the 2004 tax year for zip code 64734, filed in 2005:
Average Adjusted Gross Income (AGI) in 2004: $57,601 (Individual Income Tax Returns)
Here:
$57,601
State:
$44,591
Salary/wage: $51,441 (reported on 84.9% of returns)
Here:
$51,441
State:
$38,941
(% of AGI for various income ranges: 65.9% for AGIs $10k-25k, 80.0% for AGIs $25k-50k, 81.8% for AGIs $50k-75k, 83.3% for AGIs $75k-100k, 63.5% for AGIs over 100k)
Taxable interest for individuals: $1,358 (reported on 56.1% of returns)
This zip code:
$1,358
Missouri:
$1,801
(% of AGI for various income ranges: 2.1% for AGIs $10k-25k, 1.7% for AGIs $25k-50k, 2.0% for AGIs $50k-75k, 0.5% for AGIs $75k-100k, 1.0% for AGIs over 100k)
Taxable dividends: $974 (reported on 25.0% of returns)
Here:
$974
State:
$3,677
(% of AGI for various income ranges: 0.4% for AGIs $10k-25k, 0.4% for AGIs $25k-50k, 0.7% for AGIs $50k-75k, 0.2% for AGIs $75k-100k, 0.4% for AGIs over 100k)
Net capital gain/loss: +$17,230 (reported on 21.7% of returns)
Here:
+$17,230
State:
+$8,915
(% of AGI for various income ranges: 1.4% for AGIs $10k-25k, -0.1% for AGIs $25k-50k, 0.7% for AGIs $50k-75k, -0.1% for AGIs $75k-100k, 22.6% for AGIs over 100k)
Profit/loss from business: +$5,117 (reported on 21.3% of returns)
Here:
+$5,117
State:
+$9,793
(% of AGI for various income ranges: 9.3% for AGIs $10k-25k, 4.3% for AGIs $25k-50k, 0.4% for AGIs $50k-75k, 0.8% for AGIs $75k-100k, 1.0% for AGIs over 100k)
IRA payment deduction: $2,926 (reported on 3.5% of returns)
64734:
$2,926
Missouri:
$2,972
Total itemized deductions: $16,267 (21% of AGI, reported on 49.3% of returns)
Here:
$16,267
State:
$18,261
Here:
20.7% of AGI
State:
20.5% of AGI
(% of AGI for various income ranges: 11.6% for AGIs $10k-25k, 12.1% for AGIs $25k-50k, 16.6% for AGIs $50k-75k, 14.6% for AGIs $75k-100k, 12.4% for AGIs over 100k)
Charity contributions deductions: $2,486 (3% of AGI, reported on 40.9% of returns)
Here:
$2,486
State:
$3,665
Here:
3.1% of AGI
State:
3.9% of AGI
(% of AGI for various income ranges: 1.3% for AGIs $10k-25k, 1.2% for AGIs $25k-50k, 2.4% for AGIs $50k-75k, 1.4% for AGIs $75k-100k, 1.9% for AGIs over 100k)
Total tax: $6,569 (reported on 90.3% of returns)
64734:
$6,569
State:
$6,999
(% of AGI for various income ranges: 5.1% for AGIs $10k-25k, 6.7% for AGIs $25k-50k, 8.6% for AGIs $50k-75k, 10.3% for AGIs $75k-100k, 15.3% for AGIs over 100k)
Earned income credit: $1,717 (reported on 7.0% of returns)
Here:
$1,717
State:
$1,728
Percentage of individuals using paid preparers for their 2004 taxes: 68.7%
Here:
69%
State:
62%
(% for various income ranges: 70.7% for AGIs $10k-25k, 66.7% for AGIs $25k-50k, 71.1% for AGIs $50k-75k, 75.9% for AGIs $75k-100k, 64.9% for AGIs over 100k)
Likely homosexual households (counted as self-reported same-sex unmarried-partner households)
Lesbian couples: 0.1% of all households
Gay men: 0.0% of all households
Household received Food Stamps/SNAP in the past 12 months: 25 Household did not receive Food Stamps/SNAP in the past 12 months: 752
Women who had a birth in the past 12 months: 12 (12 now married, 0 unmarried) Women who did not have a birth in the past 12 months: 406 (206 now married, 199 unmarried)
Housing units in zip code 64734 with a mortgage: 382 (6 second mortgage, 7 both second mortgage and home equity loan) Median monthly owner costs for units with a mortgage: $1,884 Median monthly owner costs for units without a mortgage: $625
Residents with income below the poverty level in 2022:
This zip code:
7.7%
Whole state:
13.2%
Residents with income below 50% of the poverty level in 2022:
This zip code:
4.3%
Whole state:
6.8%
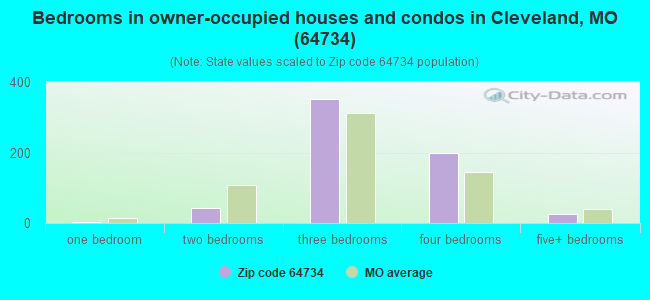
Median number of rooms in houses and condos:
Here:
6.7
State:
6.4
Median number of rooms in apartments:
Here:
5.2
State:
4.4
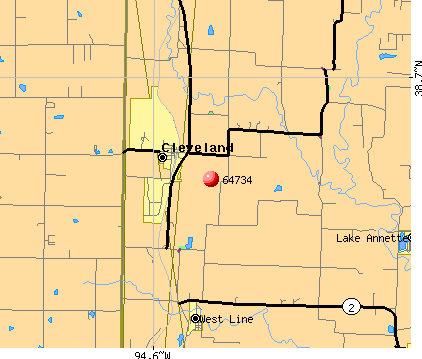
Notable locations in this zip code not listed on our city pages
Notable locations in zip code 64734: Dolan - West Dolan Fire Protection District Station 2 (A), Western Cass Fire Protection District Station 6 (B). Display/hide their locations on the map
Size of family households: 319 2-persons, 104 3-persons, 91 4-persons, 50 5-persons, 49 6-persons, 10 7-or-more-persons
Size of nonfamily households: 109 1-person, 33 2-persons, 11 4-persons
393 married couples with children.
93 single-parent households (54 men, 39 women).
95.9% of residents of 64734 zip code speak English at home.
4.2% of residents speak Spanish at home (85% very well, 15% well).
Foreign born population: 1 (0.1%) (0.0% of them are naturalized citizens)
:
0.1%
Whole state:
4.1%
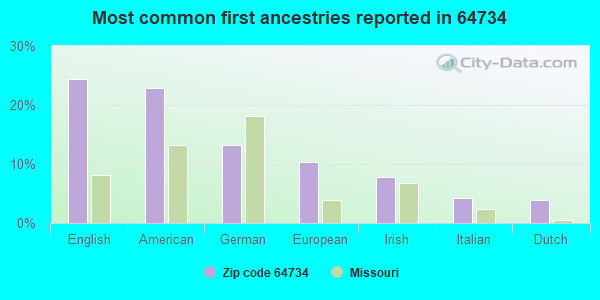
24%English
23%American
13%German
10%European
8%Irish
4%Italian
4%Dutch
Year of entry for the foreign-born population
62010 or later
102000 to 2009
51990 to 1999
0Before 1990
Facilities with environmental interests located in this zip code:
BYER CRUSHED RUCK CO (2.5 MI NE HOLMES RD ON Y HWY in CLEVELAND, MO)
AIR MINOR (AIRS/AFS) AIR SYNTHETIC MINOR (AIRS/AFS) (Integrated Compliance Information System) - ICIS-07-1994-0433, FORMAL ENFORCEMENT ACTION STATE MASTER (Missouri monitoring and compilance) - ICIS-10080, ENFORCEMENT/COMPLIANCE ACTIVITY, RCRAINFO-MO0000070599, NOT IN A UNIVERSE, AIRS/AFS-MO0893148, AIR SYNTHETIC MINOR, PCS-MOG490172, NPDES NON-MAJOR, NEI-NTIMO15026, AIR PROGRAM CRITERIA AND HAZARDOUS AIR POLLUTANT INVENTORY (Inventory of air pollution sources) National Pollutant Discharge Elimination System NON-MAJOR (Tracking pollutant discharge elimination systems) - permit (Resource Conservation and Recovery Act (tracking hazardous waste)) Business SIC and NAICS classification: CRUSHED AND BROKEN LIMESTONE Organizations: FAHEY REALTY (CONTACT/OWNER)
, KEVIN R FAHEY & JOSEPH FAHEY (CONTACT/OWNER)
Alternative names: BEYER CRUSHED ROCK CO, FAHEY REALTY
AMERICAN US AGGREGATE (STATE RT 2 & D HWY in CLEVELAND, MO)
STATE MASTER (Missouri monitoring and compilance) - PCS-MOG490830, NPDES NON-MAJOR, PCS-MOR104363, National Pollutant Discharge Elimination System NON-MAJOR (Tracking pollutant discharge elimination systems) - permit National Pollutant Discharge Elimination System NON-MAJOR (Tracking pollutant discharge elimination systems) - permit Business SIC classification: CRUSHED AND BROKEN LIMESTONE; HEAVY CONSTRUCTION Organizations: AMERICAN US AGGREGATE CO (CONTACT/OWNER)
, REX & DAVID CARLSON (CONTACT/OWNER)
Alternative names: C & C ROCK QUARRY INC.
GRANDVIEW (EX) RADIO BEACON #1 (OFF OF CASS COUNTY ROAD D in CLEVELAND, MO)
SUPERFUND (Superfund database) STATE MASTER (Missouri monitoring and compilance) - CERCLIS-MON000703333, SUPERFUND Alternative names: GRANDVIEW RADIO BEACON #1
AMERICAN U.S. AGGREGATES (COUNTY RD D, 1/4 MI S OF RT 2 in CLEVELAND, MO)
AIR MINOR (AIRS/AFS) Business SIC classification: CRUSHED AND BROKEN LIMESTONE
AMERICAN U.S. AGGREGATE-CLEVELAND SITE (RR2 SOUTH OF JCT D & RT 2 in CLEVELAND, MO)
CRITERIA AND HAZARDOUS AIR POLLUTANT INVENTORY (Inventory of air pollution sources) Business SIC classification: CRUSHED AND BROKEN LIMESTONE
Housing units lacking complete plumbing facilities: 0.9% Housing units lacking complete kitchen facilities: 2.5%
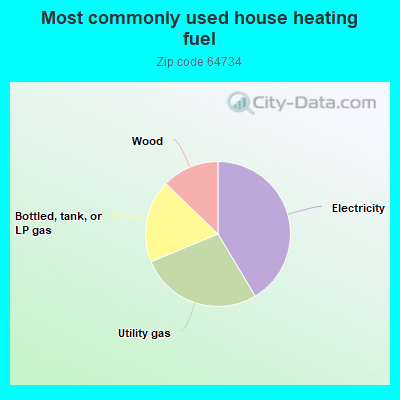
41.5%Electricity
27.4%Utility gas
18.5%Bottled, tank, or LP gas
12.8%Wood
Population in 1990: 2,586.
Place of birth for U.S.-born residents:
This state: 955
Northeast: 20
Midwest: 859
South: 172
West: 135
68% of the 64734 zip code residents lived in the same house 5 years ago. Out of people who lived in different houses, 37% lived in this county. Out of people who lived in different counties, 50% lived in Missouri.
89% of the 64734 zip code residents lived in the same house 1 year ago. Out of people who lived in different houses, 51% moved from this county. Out of people who lived in different houses, 8% moved from different county within same state. Out of people who lived in different houses, 38% moved from different state. Out of people who lived in different houses, 4% moved from abroad.
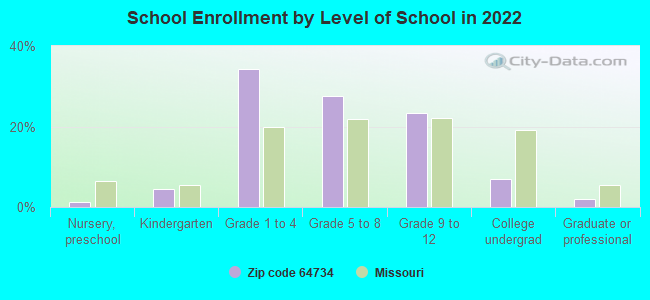
Private vs. public school enrollment:
Students in private schools in grades 1 to 8 (elementary and middle school): 11
Here:
3.6%
Missouri:
15.4%
Students in private schools in grades 9 to 12 (high school):
Here:
0.0%
Missouri:
13.9%
Students in private undergraduate colleges: 13
Here:
38.4%
Missouri:
22.6%
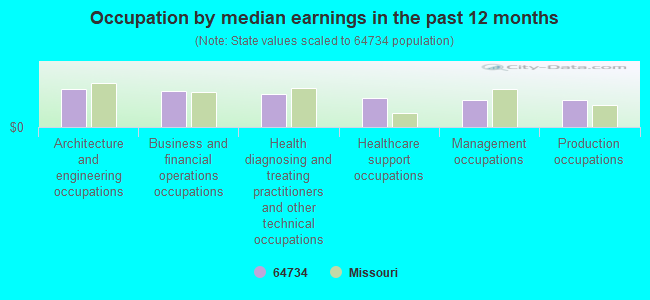
Occupation by median earnings in the past 12 months ($)
101,679Architecture and engineering occupations
97,612Business and financial operations occupations
89,032Health diagnosing and treating practitioners and other technical occupations
77,913Healthcare support occupations
73,468Management occupations
72,908Production occupations
Top industries in this zip code by the number of employees in 2005:
Mining: Crushed and Broken Limestone Mining and Quarrying (10-19 employees: 1 establishment)
Administrative and Support and Waste Management and Remediation Services: Solid Waste Collection (10-19: 1)
Administrative and Support and Waste Management and Remediation Services: Collection Agencies (10-19: 1)
Construction: Commercial and Institutional Building Construction (5-9: 1, 1-4: 1)
Construction: Masonry Contractors (5-9: 1)
Other Services (except Public Administration): General Automotive Repair (5-9: 1)
Professional, Scientific, and Technical Services: Graphic Design Services (5-9: 1)
Finance and Insurance: Commercial Banking (5-9: 1)
Fatal accident statistics in 2014:
Fatal accident count: 1
Vehicles involved in fatal accidents: 2
Fatal accidents caused by drunken drivers: 0
Fatalities: 2
Persons involved in fatal accidents: 3
Pedestrians involved in fatal accidents: 0
Fatal accident statistics in 2012:
Fatal accident count: 1
Vehicles involved in fatal accidents: 1
Fatal accidents caused by drunken drivers: 1
Fatalities: 1
Persons involved in fatal accidents: 1
Pedestrians involved in fatal accidents: 0
Home Mortgage Disclosure Act Aggregated Statistics For Year 2009 (Based on 4 partial tracts)
A) FHA, FSA/RHS & VA Home Purchase Loans
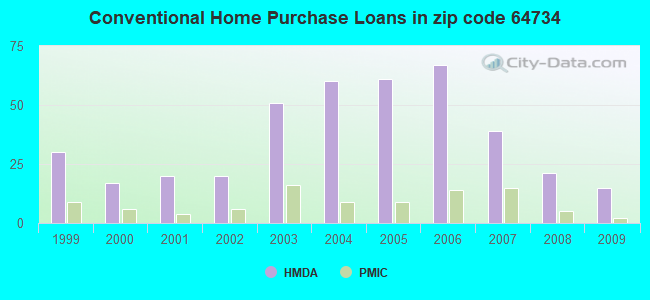
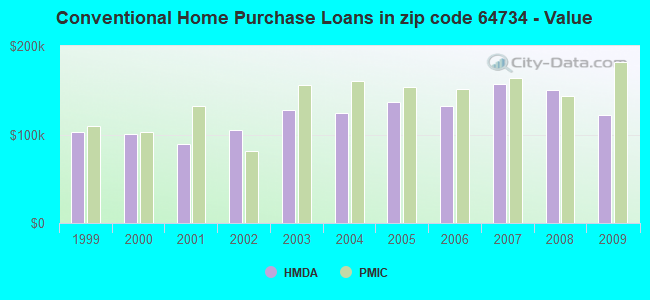
B) Conventional Home Purchase Loans
C) Refinancings
D) Home Improvement Loans
F) Non-occupant Loans on < 5 Family Dwellings (A B C & D)
G) Loans On Manufactured Home Dwelling (A B C & D)
Number
Average Value
Number
Average Value
Number
Average Value
Number
Average Value
Number
Average Value
Number
Average Value
LOANS ORIGINATED
14
$129,039
15
$121,931
121
$163,721
7
$62,283
4
$53,035
3
$70,380
APPLICATIONS APPROVED, NOT ACCEPTED
2
$175,340
0
$0
9
$134,623
1
$5,640
0
$0
0
$0
APPLICATIONS DENIED
3
$178,283
2
$94,525
32
$179,075
4
$44,160
1
$96,870
3
$81,243
APPLICATIONS WITHDRAWN
2
$172,920
0
$0
29
$180,682
2
$113,010
1
$63,730
0
$0
FILES CLOSED FOR INCOMPLETENESS
0
$0
0
$0
6
$150,228
0
$0
0
$0
0
$0
Aggregated Statistics For Year 2008 (Based on 4 partial tracts)
A) FHA, FSA/RHS & VA Home Purchase Loans
B) Conventional Home Purchase Loans
C) Refinancings
D) Home Improvement Loans
F) Non-occupant Loans on < 5 Family Dwellings (A B C & D)
G) Loans On Manufactured Home Dwelling (A B C & D)
Number
Average Value
Number
Average Value
Number
Average Value
Number
Average Value
Number
Average Value
Number
Average Value
LOANS ORIGINATED
19
$152,855
21
$150,493
73
$165,553
8
$39,529
3
$124,427
2
$97,065
APPLICATIONS APPROVED, NOT ACCEPTED
2
$186,220
1
$120,560
12
$159,259
2
$49,385
1
$99,830
2
$42,565
APPLICATIONS DENIED
3
$228,420
7
$124,706
56
$170,674
8
$51,195
4
$117,530
4
$98,185
APPLICATIONS WITHDRAWN
1
$182,580
3
$144,257
24
$181,132
2
$127,745
0
$0
1
$42,580
FILES CLOSED FOR INCOMPLETENESS
0
$0
0
$0
8
$184,519
1
$49,070
1
$87,420
0
$0
Aggregated Statistics For Year 2007 (Based on 4 partial tracts)
A) FHA, FSA/RHS & VA Home Purchase Loans
B) Conventional Home Purchase Loans
C) Refinancings
D) Home Improvement Loans
F) Non-occupant Loans on < 5 Family Dwellings (A B C & D)
G) Loans On Manufactured Home Dwelling (A B C & D)
Number
Average Value
Number
Average Value
Number
Average Value
Number
Average Value
Number
Average Value
Number
Average Value
LOANS ORIGINATED
5
$125,870
39
$156,610
88
$147,913
16
$44,794
8
$163,735
2
$112,425
APPLICATIONS APPROVED, NOT ACCEPTED
1
$92,570
4
$222,002
17
$146,387
4
$25,708
1
$265,810
2
$63,795
APPLICATIONS DENIED
0
$0
12
$142,962
58
$148,400
9
$60,497
3
$173,383
3
$68,873
APPLICATIONS WITHDRAWN
1
$48,430
3
$130,280
22
$162,695
0
$0
2
$68,820
0
$0
FILES CLOSED FOR INCOMPLETENESS
0
$0
1
$31,020
8
$167,898
0
$0
0
$0
0
$0
Aggregated Statistics For Year 2006 (Based on 4 partial tracts)
A) FHA, FSA/RHS & VA Home Purchase Loans
B) Conventional Home Purchase Loans
C) Refinancings
D) Home Improvement Loans
F) Non-occupant Loans on < 5 Family Dwellings (A B C & D)
G) Loans On Manufactured Home Dwelling (A B C & D)
Number
Average Value
Number
Average Value
Number
Average Value
Number
Average Value
Number
Average Value
Number
Average Value
LOANS ORIGINATED
3
$111,243
67
$132,026
116
$152,029
18
$40,376
15
$85,267
4
$93,178
APPLICATIONS APPROVED, NOT ACCEPTED
0
$0
7
$99,561
23
$155,473
6
$55,722
2
$125,480
0
$0
APPLICATIONS DENIED
2
$65,745
5
$109,162
80
$143,466
12
$69,160
3
$88,313
3
$78,337
APPLICATIONS WITHDRAWN
2
$119,525
10
$124,797
51
$178,569
3
$85,600
3
$588,013
2
$60,125
FILES CLOSED FOR INCOMPLETENESS
0
$0
2
$68,600
14
$158,069
0
$0
0
$0
0
$0
Aggregated Statistics For Year 2005 (Based on 4 partial tracts)
A) FHA, FSA/RHS & VA Home Purchase Loans
B) Conventional Home Purchase Loans
C) Refinancings
D) Home Improvement Loans
F) Non-occupant Loans on < 5 Family Dwellings (A B C & D)
G) Loans On Manufactured Home Dwelling (A B C & D)
Number
Average Value
Number
Average Value
Number
Average Value
Number
Average Value
Number
Average Value
Number
Average Value
LOANS ORIGINATED
7
$151,113
61
$136,628
151
$136,099
19
$70,532
12
$84,742
6
$57,425
APPLICATIONS APPROVED, NOT ACCEPTED
1
$86,290
7
$137,543
23
$185,344
3
$153,407
2
$159,895
2
$106,640
APPLICATIONS DENIED
1
$84,230
11
$112,849
76
$149,003
13
$70,445
1
$41,010
5
$81,814
APPLICATIONS WITHDRAWN
0
$0
7
$107,754
49
$157,063
6
$116,023
1
$105,750
2
$76,780
FILES CLOSED FOR INCOMPLETENESS
0
$0
1
$11,840
13
$146,148
0
$0
0
$0
0
$0
Aggregated Statistics For Year 2004 (Based on 4 partial tracts)
A) FHA, FSA/RHS & VA Home Purchase Loans
B) Conventional Home Purchase Loans
C) Refinancings
D) Home Improvement Loans
F) Non-occupant Loans on < 5 Family Dwellings (A B C & D)
G) Loans On Manufactured Home Dwelling (A B C & D)
Number
Average Value
Number
Average Value
Number
Average Value
Number
Average Value
Number
Average Value
Number
Average Value
LOANS ORIGINATED
7
$121,324
60
$124,729
160
$137,551
14
$57,316
9
$113,602
10
$54,292
APPLICATIONS APPROVED, NOT ACCEPTED
0
$0
9
$134,759
30
$134,775
1
$78,120
1
$143,350
3
$64,280
APPLICATIONS DENIED
0
$0
15
$127,055
75
$137,369
10
$48,548
3
$77,150
7
$83,823
APPLICATIONS WITHDRAWN
1
$74,020
8
$97,254
56
$137,004
3
$86,860
1
$42,180
1
$75,780
FILES CLOSED FOR INCOMPLETENESS
0
$0
5
$102,336
17
$154,804
0
$0
0
$0
0
$0
Aggregated Statistics For Year 2003 (Based on 4 partial tracts)
A) FHA, FSA/RHS & VA Home Purchase Loans
B) Conventional Home Purchase Loans
C) Refinancings
D) Home Improvement Loans
F) Non-occupant Loans on < 5 Family Dwellings (A B C & D)
Number
Average Value
Number
Average Value
Number
Average Value
Number
Average Value
Number
Average Value
LOANS ORIGINATED
7
$137,490
51
$127,238
299
$131,378
10
$25,162
7
$89,420
APPLICATIONS APPROVED, NOT ACCEPTED
0
$0
8
$98,906
28
$124,946
4
$30,015
1
$97,500
APPLICATIONS DENIED
0
$0
12
$87,706
93
$122,786
8
$19,140
4
$122,012
APPLICATIONS WITHDRAWN
0
$0
9
$107,313
70
$126,201
1
$8,460
3
$94,740
FILES CLOSED FOR INCOMPLETENESS
0
$0
3
$108,027
16
$133,222
1
$16,920
2
$155,265
Aggregated Statistics For Year 2002 (Based on 2 partial tracts)
A) FHA, FSA/RHS & VA Home Purchase Loans
B) Conventional Home Purchase Loans
C) Refinancings
D) Home Improvement Loans
F) Non-occupant Loans on < 5 Family Dwellings (A B C & D)
Number
Average Value
Number
Average Value
Number
Average Value
Number
Average Value
Number
Average Value
LOANS ORIGINATED
4
$111,908
20
$104,603
80
$114,221
5
$37,420
3
$126,033
APPLICATIONS APPROVED, NOT ACCEPTED
0
$0
2
$117,765
17
$127,083
1
$13,670
0
$0
APPLICATIONS DENIED
0
$0
7
$93,689
30
$103,626
3
$8,593
1
$84,760
APPLICATIONS WITHDRAWN
0
$0
2
$88,275
19
$127,151
1
$16,800
1
$62,890
FILES CLOSED FOR INCOMPLETENESS
0
$0
0
$0
5
$117,180
0
$0
0
$0
Aggregated Statistics For Year 2001 (Based on 2 partial tracts)
A) FHA, FSA/RHS & VA Home Purchase Loans
B) Conventional Home Purchase Loans
C) Refinancings
D) Home Improvement Loans
F) Non-occupant Loans on < 5 Family Dwellings (A B C & D)
Number
Average Value
Number
Average Value
Number
Average Value
Number
Average Value
Number
Average Value
LOANS ORIGINATED
2
$52,730
20
$89,194
67
$115,647
6
$28,058
6
$66,597
APPLICATIONS APPROVED, NOT ACCEPTED
0
$0
2
$33,590
6
$98,432
0
$0
0
$0
APPLICATIONS DENIED
0
$0
4
$75,092
30
$91,231
4
$13,280
1
$19,530
APPLICATIONS WITHDRAWN
1
$78,510
2
$221,665
20
$102,591
2
$28,515
0
$0
FILES CLOSED FOR INCOMPLETENESS
0
$0
0
$0
2
$132,415
0
$0
0
$0
Aggregated Statistics For Year 2000 (Based on 2 partial tracts)
A) FHA, FSA/RHS & VA Home Purchase Loans
B) Conventional Home Purchase Loans
C) Refinancings
D) Home Improvement Loans
F) Non-occupant Loans on < 5 Family Dwellings (A B C & D)
Number
Average Value
Number
Average Value
Number
Average Value
Number
Average Value
Number
Average Value
LOANS ORIGINATED
4
$91,498
17
$101,119
29
$76,127
7
$10,937
2
$60,350
APPLICATIONS APPROVED, NOT ACCEPTED
0
$0
4
$72,945
9
$64,102
0
$0
0
$0
APPLICATIONS DENIED
1
$51,560
8
$53,902
25
$73,589
2
$49,800
1
$33,590
APPLICATIONS WITHDRAWN
0
$0
3
$100,903
6
$63,472
1
$56,640
0
$0
FILES CLOSED FOR INCOMPLETENESS
0
$0
0
$0
3
$63,277
0
$0
0
$0
Aggregated Statistics For Year 1999 (Based on 2 partial tracts)
A) FHA, FSA/RHS & VA Home Purchase Loans
B) Conventional Home Purchase Loans
C) Refinancings
D) Home Improvement Loans
E) Loans on Dwellings For 5+ Families
F) Non-occupant Loans on < 5 Family Dwellings (A B C & D)
Detailed PMIC statistics for the following Tracts:0610.01
, 0611.00
2002 - 2018 National Fire Incident Reporting System (NFIRS) incidents
Based on the data from the years 2002 - 2018 the average number of fires per year is 15. The highest number of fire incidents - 47 took place in 2003, and the least - 0 in 2016. The data has a dropping trend.
When looking into fire subcategories, the most reports belonged to: Outside Fires (59.2%), and Structure Fires (29.6%).
Fire incident types reported to NFIRS in Zip Code 64734


 Nearest zip codes: 64746, 64078, 66053, 64012, 64742, 66013.
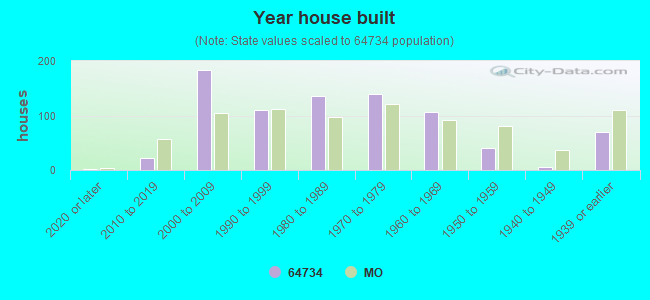


 Based on the data from the years 2002 - 2018 the average number of fires per year is 15. The highest number of fire incidents - 47 took place in 2003, and the least - 0 in 2016. The data has a dropping trend.
 When looking into fire subcategories, the most reports belonged to: Outside Fires (59.2%), and Structure Fires (29.6%).