Estimated zip code population in 2022: 1,053 Zip code population in 2010: 997 Zip code population in 2000: 904
Houses and condos: 412 Renter-occupied apartments: 43
% of renters here:
12%
State:
32%
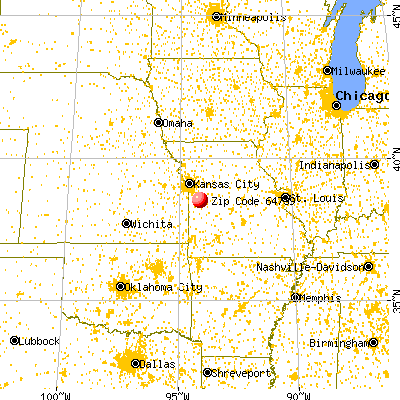
March 2022 cost of living index in zip code 64739: 76.8 (low, U.S. average is 100)
Land area: 51.2 sq. mi. Water area: 0.1 sq. mi.
Population density: 21 people per square mile
(very low).
OSM Map
General Map
Google Map
MSN Map
OSM Map
General Map
Google Map
MSN Map
OSM Map
General Map
Google Map
MSN Map
OSM Map
General Map
Google Map
MSN Map
Please wait while loading the map...
Real estate property taxes paid for housing units in 2022:
This zip code:
0.6% ($1,525)
Missouri:
0.8% ($1,810)
Median real estate property taxes paid for housing units with mortgages in 2022: $1,596 (0.6%) Median real estate property taxes paid for housing units with no mortgage in 2022: $1,306 (0.8%)
Estimated median house/condo value in 2022: $255,922
64739:
$255,922
Missouri:
$221,200
According to our research of Missouri and other state lists, there were 2 registered sex offenders living in 64739 zip code as of June 16, 2024. The ratio of all residents to sex offenders in zip code 64739 is 385 to 1. The ratio of registered sex offenders to all residents in this zip code is near the state average.
Median resident age:
This zip code:
42.7 years
Missouri median age:
39.1 years
Average household size:
This zip code:
2.8 people
Missouri:
2.4 people
Averages for the 2020 tax year for zip code 64739, filed in 2021:
Average Adjusted Gross Income (AGI) in 2020: $56,432 (Individual Income Tax Returns)
Here:
$56,432
State:
$68,151
Salary/wage: $56,172 (reported on 80.0% of returns)
Here:
$56,172
State:
$56,131
(% of AGI for various income ranges: 1400.0% for AGIs below $25k, 3410.0% for AGIs $25k-50k, 7240.0% for AGIs $50k-75k, 10275.0% for AGIs $75k-100k, 15910.0% for AGIs $100k-200k)
Taxable interest for individuals: $492 (reported on 24.0% of returns)
This zip code:
$492
Missouri:
$1,586
(% of AGI for various income ranges: 5.0% for AGIs below $25k, 5.6% for AGIs $25k-50k, 56.7% for AGIs $50k-75k, 25.0% for AGIs $100k-200k)
Ordinary dividends: $667 (reported on 12.0% of returns)
Here:
$667
State:
$10,947
(% of AGI for various income ranges: 29.0% for AGIs below $25k, 27.5% for AGIs $75k-100k)
Net capital gain/loss in AGI: +$6,200 (reported on 12.0% of returns)
Here:
+$6,200
State:
+$18,453
(% of AGI for various income ranges: 55.6% for AGIs $25k-50k, 805.0% for AGIs $75k-100k)
Profit/loss from business: +$6,586 (reported on 14.0% of returns)
Here:
+$6,586
State:
+$12,260
(% of AGI for various income ranges: 502.2% for AGIs $25k-50k, 22.5% for AGIs $75k-100k)
Taxable individual retirement arrangement distribution: $8,200 (reported on 6.0% of returns)
64739:
$8,200
Missouri:
$19,719
(% of AGI for various income ranges: 273.3% for AGIs $25k-50k)
Total itemized deductions: $25,400 (reported on 4.0% of returns)
Here:
$25,400
State:
$36,651
(% of AGI for various income ranges: 564.4% for AGIs $25k-50k)
Earned income credit: $2,457 (reported on 14.0% of returns)
Here:
$2,457
State:
$2,315
(% of AGI for various income ranges: 79.0% for AGIs below $25k, 103.3% for AGIs $25k-50k)
Percentage of individuals using paid preparers for their 2020 taxes: 96.0%
Here:
96%
State:
93%
(% for various income ranges: 92.9% for AGIs below $25k, 91.7% for AGIs $25k-50k, 100.0% for AGIs $50k-75k, 100.0% for AGIs $75k-100k, 100.0% for AGIs $100k-200k)
Averages for the 2012 tax year for zip code 64739, filed in 2013:
Average Adjusted Gross Income (AGI) in 2012: $46,764 (Individual Income Tax Returns)
Here:
$46,764
State:
$55,896
Salary/wage: $42,271 (reported on 84.4% of returns)
Here:
$42,271
State:
$46,205
(% of AGI for various income ranges: 70.8% for AGIs below $25k, 79.2% for AGIs $25k-50k, 71.0% for AGIs $50k-75k, 83.3% for AGIs $75k-100k, 74.2% for AGIs $100k-200k)
Taxable interest for individuals: $714 (reported on 31.1% of returns)
This zip code:
$714
Missouri:
$1,559
(% of AGI for various income ranges: 1.7% for AGIs below $25k, 1.0% for AGIs $25k-50k, 0.1% for AGIs $50k-75k, 0.3% for AGIs $75k-100k)
Ordinary dividends: $580 (reported on 11.1% of returns)
Here:
$580
State:
$7,410
Net capital gain/loss in AGI: +$3,600 (reported on 8.9% of returns)
Here:
+$3,600
State:
+$11,579
Profit/loss from business: +$10,329 (reported on 15.6% of returns)
Here:
+$10,329
State:
+$11,688
Taxable individual retirement arrangement distribution: $4,633 (reported on 6.7% of returns)
64739:
$4,633
Missouri:
$14,773
Total itemized deductions: $15,354 (21% of AGI, reported on 28.9% of returns)
Here:
$15,354
State:
$22,730
Here:
20.8% of AGI
State:
19.2% of AGI
(% of AGI for various income ranges: 8.0% for AGIs $25k-50k, 9.4% for AGIs $50k-75k, 12.2% for AGIs $75k-100k, 11.9% for AGIs $100k-200k)
Charity contributions: $2,557 (reported on 15.6% of returns)
Here:
$2,557
State:
$4,745
(% of AGI for various income ranges: 0.6% for AGIs $25k-50k, 1.5% for AGIs $75k-100k, 1.5% for AGIs $100k-200k)
Taxes paid: $4,738 (reported on 28.9% of returns)
64739:
$4,738
State:
$8,399
(% of AGI for various income ranges: 1.5% for AGIs $25k-50k, 2.1% for AGIs $50k-75k, 3.9% for AGIs $75k-100k, 5.0% for AGIs $100k-200k)
Earned income credit: $2,714 (reported on 15.6% of returns)
Here:
$2,714
State:
$2,288
(% of AGI for various income ranges: 5.8% for AGIs below $25k, 1.6% for AGIs $25k-50k)
Percentage of individuals using paid preparers for their 2012 taxes: 73.3%
Here:
73%
State:
55%
(% for various income ranges: 70.6% for AGIs below $25k, 72.7% for AGIs $25k-50k, 85.7% for AGIs $50k-75k, 66.7% for AGIs $75k-100k, 75.0% for AGIs $100k-200k)
Averages for the 2004 tax year for zip code 64739, filed in 2005:
Average Adjusted Gross Income (AGI) in 2004: $36,838 (Individual Income Tax Returns)
Here:
$36,838
State:
$44,591
Salary/wage: $35,981 (reported on 82.2% of returns)
Here:
$35,981
State:
$38,941
(% of AGI for various income ranges: 86.6% for AGIs below $10k, 63.6% for AGIs $10k-25k, 87.3% for AGIs $25k-50k, 82.1% for AGIs $50k-75k, 92.5% for AGIs $75k-100k, 68.9% for AGIs over 100k)
Taxable interest for individuals: $923 (reported on 43.1% of returns)
This zip code:
$923
Missouri:
$1,801
(% of AGI for various income ranges: 4.6% for AGIs below $10k, 3.4% for AGIs $10k-25k, 0.6% for AGIs $25k-50k, 0.5% for AGIs $50k-75k, 0.2% for AGIs $75k-100k, 1.4% for AGIs over 100k)
Taxable dividends: $300 (reported on 13.3% of returns)
Here:
$300
State:
$3,677
(% of AGI for various income ranges: 0.3% for AGIs $10k-25k, 0.1% for AGIs $25k-50k, 0.1% for AGIs $50k-75k, 0.1% for AGIs $75k-100k)
Net capital gain/loss: +$2,468 (reported on 13.8% of returns)
Here:
+$2,468
State:
+$8,915
Profit/loss from business: +$6,303 (reported on 16.9% of returns)
Here:
+$6,303
State:
+$9,793
(% of AGI for various income ranges: 9.0% for AGIs below $10k, 7.6% for AGIs $10k-25k, 4.0% for AGIs $25k-50k, 2.5% for AGIs $50k-75k)
Total itemized deductions: $15,204 (23% of AGI, reported on 25.1% of returns)
Here:
$15,204
State:
$18,261
Here:
23.1% of AGI
State:
20.5% of AGI
(% of AGI for various income ranges: 11.5% for AGIs $10k-25k, 10.1% for AGIs $25k-50k, 10.8% for AGIs $50k-75k, 12.4% for AGIs $75k-100k, 9.3% for AGIs over 100k)
Charity contributions deductions: $2,429 (3% of AGI, reported on 17.1% of returns)
Here:
$2,429
State:
$3,665
Here:
3.3% of AGI
State:
3.9% of AGI
(% of AGI for various income ranges: 0.9% for AGIs $25k-50k, 1.1% for AGIs $50k-75k, 1.0% for AGIs $75k-100k, 2.4% for AGIs over 100k)
Total tax: $4,720 (reported on 73.1% of returns)
64739:
$4,720
State:
$6,999
(% of AGI for various income ranges: 3.1% for AGIs below $10k, 4.5% for AGIs $10k-25k, 6.6% for AGIs $25k-50k, 8.7% for AGIs $50k-75k, 10.0% for AGIs $75k-100k, 17.9% for AGIs over 100k)
Earned income credit: $1,478 (reported on 14.9% of returns)
Here:
$1,478
State:
$1,728
Percentage of individuals using paid preparers for their 2004 taxes: 74.7%
Here:
75%
State:
62%
(% for various income ranges: 59.8% for AGIs below $10k, 76.3% for AGIs $10k-25k, 73.6% for AGIs $25k-50k, 86.1% for AGIs $50k-75k, 88.5% for AGIs $75k-100k, 85.0% for AGIs over 100k)
Household received Food Stamps/SNAP in the past 12 months: 16 Household did not receive Food Stamps/SNAP in the past 12 months: 356
Women who had a birth in the past 12 months: 14 (13 now married, 0 unmarried) Women who did not have a birth in the past 12 months: 181 (77 now married, 104 unmarried)
Housing units in zip code 64739 with a mortgage: 201 (7 second mortgage) Median monthly owner costs for units with a mortgage: $1,558 Median monthly owner costs for units without a mortgage: $474
Residents with income below the poverty level in 2022:
This zip code:
5.1%
Whole state:
13.2%
Residents with income below 50% of the poverty level in 2022:
This zip code:
2.2%
Whole state:
6.8%
Median number of rooms in houses and condos:
Here:
6.7
State:
6.4
Median number of rooms in apartments:
Here:
3.5
State:
4.4
Notable locations in this zip code not listed on our city pages
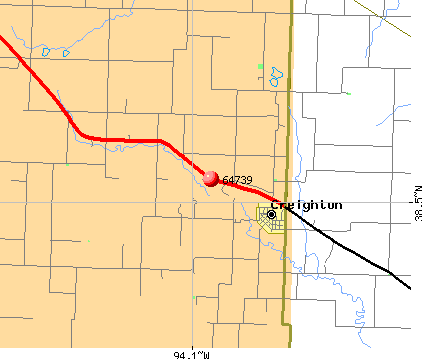
Notable locations in zip code 64739: Creighton Wastewater Treatment Facility (A), Number Eight School (B), Creighton Fire Protection District (C). Display/hide their locations on the map
Cemeteries: Lost Creek Cemetery (1), Trinity Lutheran Cemetery (2), Page Cemetery (3), Parker-Gregg Cemetery (4), Byler Cemetery (5), Grant Cemetery (6). Display/hide their locations on the map
Size of family households: 112 2-persons, 80 3-persons, 35 4-persons, 28 5-persons, 21 6-persons, 2 7-or-more-persons
Size of nonfamily households: 78 1-person, 13 2-persons
184 married couples with children.
28 single-parent households (17 men, 11 women).
99.6% of residents of 64739 zip code speak English at home.
0.1% of residents speak Spanish at home (100% very well).
0.1% of residents speak Asian or Pacific Island language at home (100% very well).
Foreign born population: 0 (0.0%)
:
0.0%
Whole state:
4.1%
27%American
20%German
13%English
7%Swedish
3%Scottish
2%Irish
2%Scotch-Irish
Year of entry for the foreign-born population
02010 or later
02000 to 2009
01990 to 1999
5Before 1990
Facilities with environmental interests located in this zip code:
A & M LANDFILL (32706 RAINBOW RD in CREIGHTON, MO)
STATE MASTER (Missouri monitoring and compilance) - NEI-NTIMOLF9228, AIR PROGRAM CRITERIA AND HAZARDOUS AIR POLLUTANT INVENTORY (Inventory of air pollution sources) Business SIC classification: REFUSE SYSTEMS Business NAICS classification: SOLID WASTE LANDFILL.
HILTY QUARRIES INC (1251 NW 1651 RD in CREIGHTON, MO)
National Pollutant Discharge Elimination System NON-MAJOR (Tracking pollutant discharge elimination systems) - permit Business SIC classification: CRUSHED AND BROKEN LIMESTONE Alternative names: HILTY QUARRIES INC. - CRE, HUNT MIDWEST MINING
AT&T COMPANY LONG LINES (RURAL ROUTE DAYTON in CREIGHTON, MO)
(Resource Conservation and Recovery Act (tracking hazardous waste)) Alternative names: AMERICAN TEL & TEL CO LONG LINES
Housing units lacking complete plumbing facilities: 2.8% Housing units lacking complete kitchen facilities: 1.3%
57.8%Electricity
34.0%Bottled, tank, or LP gas
7.2%Wood
1.4%No fuel used
Population in 1990: 711. Population change in the 1990s: +193 (+27.1%).
Place of birth for U.S.-born residents:
This state: 622
Midwest: 261
South: 15
West: 154
74% of the 64739 zip code residents lived in the same house 5 years ago. Out of people who lived in different houses, 52% lived in this county. Out of people who lived in different counties, 50% lived in Missouri.
95% of the 64739 zip code residents lived in the same house 1 year ago. Out of people who lived in different houses, 81% moved from this county. Out of people who lived in different houses, 5% moved from different state. Out of people who lived in different houses, 11% moved from abroad.
Private vs. public school enrollment:
Students in private schools in grades 1 to 8 (elementary and middle school): 57
Here:
46.4%
Missouri:
15.4%
Students in private schools in grades 9 to 12 (high school):
Here:
0.0%
Missouri:
13.9%
Students in private undergraduate colleges: 33
Here:
41.4%
Missouri:
22.6%
Occupation by median earnings in the past 12 months ($)
107,736Sales and related occupations
94,713Installation, maintenance, and repair occupations
81,757Management occupations
58,150Construction and extraction occupations
46,521Law enforcement workers including supervisors
37,175Production occupations
Companies with federal contracts located in this zip code:
BOWE CORPORATION (700 ARNOLD ST in CREIGHTON, MO; small business) : $17,725 in 3 contractsfrom 2004 to 2005
$7,183 with Defense Logistics Agency for Nuts and Washers. Signed on 2004-11-05. Completion date: 2005-02-04.
$5,704, same as above.Signed on 2005-02-07. Completion date: 2005-05-07.
$4,838 with Defense Logistics Agency for Guns, 75 mm through 125 mm. Signed on 2005-10-18. Completion date: 2006-01-17.
Top industries in this zip code by the number of employees in 2005:
Finance and Insurance: Commercial Banking (10-19 employees: 1 establishment)
Accommodation and Food Services: Full-Service Restaurants (10-19: 1)
Other Services (except Public Administration): Other Personal and Household Goods Repair and Maintenance (5-9: 1, 1-4: 1)
Construction: New Single-Family Housing Construction (except Operative Builders) (5-9: 1, 1-4: 1)
Construction: Poured Concrete Foundation and Structure Contractors (5-9: 1)
Construction: Painting and Wall Covering Contractors (1-4: 1)
Mining: Crushed and Broken Limestone Mining and Quarrying (1-4: 1)
Fatal accident statistics in 2012:
Fatal accident count: 1
Vehicles involved in fatal accidents: 1
Fatal accidents caused by drunken drivers: 1
Fatalities: 1
Persons involved in fatal accidents: 1
Pedestrians involved in fatal accidents: 0
Fatal accident statistics in 2010:
Fatal accident count: 1
Vehicles involved in fatal accidents: 1
Fatal accidents caused by drunken drivers: 0
Fatalities: 1
Persons involved in fatal accidents: 2
Pedestrians involved in fatal accidents: 0
Home Mortgage Disclosure Act Aggregated Statistics For Year 2009 (Based on 2 partial tracts)
A) FHA, FSA/RHS & VA Home Purchase Loans
B) Conventional Home Purchase Loans
C) Refinancings
D) Home Improvement Loans
F) Non-occupant Loans on < 5 Family Dwellings (A B C & D)
G) Loans On Manufactured Home Dwelling (A B C & D)
Number
Average Value
Number
Average Value
Number
Average Value
Number
Average Value
Number
Average Value
Number
Average Value
LOANS ORIGINATED
6
$93,995
12
$123,080
48
$140,012
3
$48,383
5
$175,064
3
$96,397
APPLICATIONS APPROVED, NOT ACCEPTED
1
$69,800
1
$131,850
8
$114,331
2
$49,585
0
$0
0
$0
APPLICATIONS DENIED
1
$83,100
2
$51,800
28
$149,600
2
$44,320
0
$0
2
$150,135
APPLICATIONS WITHDRAWN
3
$106,000
1
$182,820
13
$152,904
1
$13,850
0
$0
1
$36,560
FILES CLOSED FOR INCOMPLETENESS
1
$62,050
0
$0
3
$122,987
0
$0
0
$0
0
$0
Aggregated Statistics For Year 2008 (Based on 2 partial tracts)
A) FHA, FSA/RHS & VA Home Purchase Loans
B) Conventional Home Purchase Loans
C) Refinancings
D) Home Improvement Loans
F) Non-occupant Loans on < 5 Family Dwellings (A B C & D)
G) Loans On Manufactured Home Dwelling (A B C & D)
Number
Average Value
Number
Average Value
Number
Average Value
Number
Average Value
Number
Average Value
Number
Average Value
LOANS ORIGINATED
9
$106,491
11
$92,467
45
$136,875
5
$29,140
6
$111,723
3
$62,787
APPLICATIONS APPROVED, NOT ACCEPTED
1
$57,060
1
$85,870
6
$199,348
1
$55,400
1
$11,080
1
$123,540
APPLICATIONS DENIED
1
$111,910
2
$45,980
30
$141,362
6
$82,268
1
$41,550
2
$113,845
APPLICATIONS WITHDRAWN
1
$138,500
1
$231,020
15
$145,185
2
$38,780
0
$0
0
$0
FILES CLOSED FOR INCOMPLETENESS
0
$0
0
$0
3
$129,083
1
$65,370
0
$0
1
$62,600
Aggregated Statistics For Year 2007 (Based on 2 partial tracts)
A) FHA, FSA/RHS & VA Home Purchase Loans
B) Conventional Home Purchase Loans
C) Refinancings
D) Home Improvement Loans
F) Non-occupant Loans on < 5 Family Dwellings (A B C & D)
G) Loans On Manufactured Home Dwelling (A B C & D)
Number
Average Value
Number
Average Value
Number
Average Value
Number
Average Value
Number
Average Value
Number
Average Value
LOANS ORIGINATED
7
$106,684
20
$122,130
57
$128,547
8
$67,796
7
$96,396
5
$103,266
APPLICATIONS APPROVED, NOT ACCEPTED
0
$0
3
$122,987
14
$130,942
2
$37,950
0
$0
2
$91,965
APPLICATIONS DENIED
1
$169,520
5
$129,082
49
$138,150
7
$80,251
1
$161,210
3
$81,623
APPLICATIONS WITHDRAWN
2
$94,180
2
$57,340
18
$115,878
1
$22,710
0
$0
0
$0
FILES CLOSED FOR INCOMPLETENESS
0
$0
1
$99,720
3
$144,410
0
$0
0
$0
1
$67,590
Aggregated Statistics For Year 2006 (Based on 2 partial tracts)
A) FHA, FSA/RHS & VA Home Purchase Loans
B) Conventional Home Purchase Loans
C) Refinancings
D) Home Improvement Loans
F) Non-occupant Loans on < 5 Family Dwellings (A B C & D)
G) Loans On Manufactured Home Dwelling (A B C & D)
Number
Average Value
Number
Average Value
Number
Average Value
Number
Average Value
Number
Average Value
Number
Average Value
LOANS ORIGINATED
9
$102,982
41
$107,422
57
$126,079
11
$41,903
3
$76,637
4
$103,460
APPLICATIONS APPROVED, NOT ACCEPTED
1
$157,340
3
$142,933
14
$137,946
2
$44,320
1
$21,050
0
$0
APPLICATIONS DENIED
0
$0
14
$124,413
50
$145,037
7
$91,647
0
$0
5
$117,780
APPLICATIONS WITHDRAWN
2
$113,295
10
$111,354
21
$121,959
2
$55,675
1
$132,960
0
$0
FILES CLOSED FOR INCOMPLETENESS
0
$0
2
$73,130
7
$715,689
1
$76,450
1
$45,430
0
$0
Aggregated Statistics For Year 2005 (Based on 2 partial tracts)
A) FHA, FSA/RHS & VA Home Purchase Loans
B) Conventional Home Purchase Loans
C) Refinancings
D) Home Improvement Loans
E) Loans on Dwellings For 5+ Families
F) Non-occupant Loans on < 5 Family Dwellings (A B C & D)
G) Loans On Manufactured Home Dwelling (A B C & D)
Number
Average Value
Number
Average Value
Number
Average Value
Number
Average Value
Number
Average Value
Number
Average Value
Number
Average Value
LOANS ORIGINATED
9
$132,899
43
$98,122
66
$127,454
12
$24,192
1
$75,900
7
$87,849
6
$71,097
APPLICATIONS APPROVED, NOT ACCEPTED
0
$0
3
$64,817
13
$114,806
3
$42,843
0
$0
1
$39,890
2
$81,715
APPLICATIONS DENIED
1
$113,570
14
$87,888
53
$98,967
7
$45,586
0
$0
2
$44,595
4
$81,715
APPLICATIONS WITHDRAWN
1
$163,430
13
$98,058
30
$125,850
4
$115,648
0
$0
3
$114,123
1
$63,710
FILES CLOSED FOR INCOMPLETENESS
0
$0
1
$50,970
6
$159,828
1
$64,820
0
$0
0
$0
0
$0
Aggregated Statistics For Year 2004 (Based on 2 partial tracts)
A) FHA, FSA/RHS & VA Home Purchase Loans
B) Conventional Home Purchase Loans
C) Refinancings
D) Home Improvement Loans
F) Non-occupant Loans on < 5 Family Dwellings (A B C & D)
G) Loans On Manufactured Home Dwelling (A B C & D)
Number
Average Value
Number
Average Value
Number
Average Value
Number
Average Value
Number
Average Value
Number
Average Value
LOANS ORIGINATED
10
$97,947
35
$103,107
74
$101,509
5
$20,720
3
$94,180
7
$80,647
APPLICATIONS APPROVED, NOT ACCEPTED
0
$0
2
$67,865
11
$100,576
2
$51,800
1
$54,290
1
$43,770
APPLICATIONS DENIED
1
$158,440
11
$81,942
34
$100,502
3
$51,337
1
$117,450
3
$60,570
APPLICATIONS WITHDRAWN
1
$47,090
5
$76,784
27
$119,171
1
$13,850
1
$31,020
0
$0
FILES CLOSED FOR INCOMPLETENESS
0
$0
1
$55,400
6
$115,693
1
$29,360
1
$45,980
0
$0
Aggregated Statistics For Year 2003 (Based on 2 partial tracts)
A) FHA, FSA/RHS & VA Home Purchase Loans
B) Conventional Home Purchase Loans
C) Refinancings
D) Home Improvement Loans
F) Non-occupant Loans on < 5 Family Dwellings (A B C & D)
Number
Average Value
Number
Average Value
Number
Average Value
Number
Average Value
Number
Average Value
LOANS ORIGINATED
7
$101,461
21
$93,573
129
$106,802
6
$26,130
3
$55,770
APPLICATIONS APPROVED, NOT ACCEPTED
1
$65,370
1
$208,860
16
$122,192
0
$0
0
$0
APPLICATIONS DENIED
0
$0
8
$76,175
58
$105,909
1
$14,400
2
$75,345
APPLICATIONS WITHDRAWN
1
$85,320
2
$77,285
27
$99,700
0
$0
1
$32,130
FILES CLOSED FOR INCOMPLETENESS
0
$0
1
$28,810
6
$123,450
1
$22,160
0
$0
Aggregated Statistics For Year 2002 (Based on 2 partial tracts)
A) FHA, FSA/RHS & VA Home Purchase Loans
B) Conventional Home Purchase Loans
C) Refinancings
D) Home Improvement Loans
E) Loans on Dwellings For 5+ Families
F) Non-occupant Loans on < 5 Family Dwellings (A B C & D)
Number
Average Value
Number
Average Value
Number
Average Value
Number
Average Value
Number
Average Value
Number
Average Value
LOANS ORIGINATED
8
$100,551
22
$90,327
84
$104,304
6
$14,588
1
$150,130
5
$71,910
APPLICATIONS APPROVED, NOT ACCEPTED
0
$0
4
$80,052
12
$104,429
1
$66,480
0
$0
0
$0
APPLICATIONS DENIED
0
$0
6
$63,525
33
$92,552
4
$16,620
0
$0
1
$86,420
APPLICATIONS WITHDRAWN
0
$0
3
$140,163
25
$101,692
1
$16,620
1
$209,410
0
$0
FILES CLOSED FOR INCOMPLETENESS
0
$0
2
$66,205
6
$89,102
0
$0
0
$0
0
$0
Aggregated Statistics For Year 2001 (Based on 2 partial tracts)
A) FHA, FSA/RHS & VA Home Purchase Loans
B) Conventional Home Purchase Loans
C) Refinancings
D) Home Improvement Loans
F) Non-occupant Loans on < 5 Family Dwellings (A B C & D)
Number
Average Value
Number
Average Value
Number
Average Value
Number
Average Value
Number
Average Value
LOANS ORIGINATED
14
$92,518
22
$88,287
73
$98,088
12
$47,367
14
$76,729
APPLICATIONS APPROVED, NOT ACCEPTED
1
$101,380
3
$52,630
7
$74,236
1
$16,620
0
$0
APPLICATIONS DENIED
0
$0
6
$58,540
35
$80,488
6
$19,667
1
$94,180
APPLICATIONS WITHDRAWN
1
$39,330
2
$119,665
16
$82,165
2
$9,140
1
$47,640
FILES CLOSED FOR INCOMPLETENESS
0
$0
1
$41,550
4
$81,992
1
$5,540
1
$32,690
Aggregated Statistics For Year 2000 (Based on 2 partial tracts)
A) FHA, FSA/RHS & VA Home Purchase Loans
B) Conventional Home Purchase Loans
C) Refinancings
D) Home Improvement Loans
E) Loans on Dwellings For 5+ Families
F) Non-occupant Loans on < 5 Family Dwellings (A B C & D)
Number
Average Value
Number
Average Value
Number
Average Value
Number
Average Value
Number
Average Value
Number
Average Value
LOANS ORIGINATED
7
$81,834
23
$68,431
34
$76,305
7
$7,756
0
$0
2
$52,905
APPLICATIONS APPROVED, NOT ACCEPTED
1
$22,160
6
$41,827
10
$62,048
1
$8,860
0
$0
1
$54,290
APPLICATIONS DENIED
1
$55,400
6
$50,783
16
$55,573
2
$45,430
1
$73,130
1
$13,850
APPLICATIONS WITHDRAWN
1
$39,330
3
$115,600
11
$44,270
2
$21,330
0
$0
0
$0
FILES CLOSED FOR INCOMPLETENESS
0
$0
1
$52,630
2
$91,410
0
$0
0
$0
0
$0
Aggregated Statistics For Year 1999 (Based on 1 partial tract)
A) FHA, FSA/RHS & VA Home Purchase Loans
B) Conventional Home Purchase Loans
C) Refinancings
D) Home Improvement Loans
F) Non-occupant Loans on < 5 Family Dwellings (A B C & D)
Detailed PMIC statistics for the following Tracts:0612.00
2002 - 2018 National Fire Incident Reporting System (NFIRS) incidents
Based on the data from the years 2002 - 2018 the average number of fires per year is 10. The highest number of fire incidents - 27 took place in 2003, and the least - 0 in 2013. The data has a dropping trend.
When looking into fire subcategories, the most reports belonged to: Outside Fires (56.1%), and Structure Fires (27.4%).
Fire incident types reported to NFIRS in Zip Code 64739


 Nearest zip codes: 64747, 64788, 64726, 64743, 64040, 64770.


 Based on the data from the years 2002 - 2018 the average number of fires per year is 10. The highest number of fire incidents - 27 took place in 2003, and the least - 0 in 2013. The data has a dropping trend.
 When looking into fire subcategories, the most reports belonged to: Outside Fires (56.1%), and Structure Fires (27.4%).