Estimated zip code population in 2022: 1,346 Zip code population in 2010: 731 Zip code population in 2000: 724
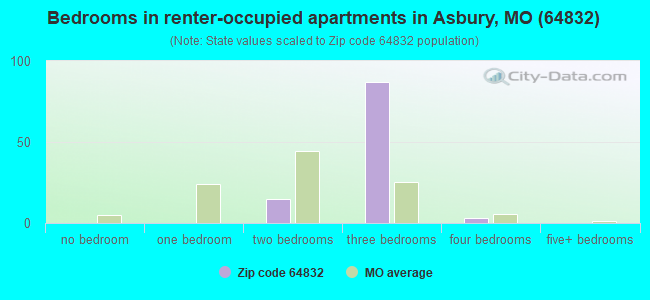
Houses and condos: 486 Renter-occupied apartments: 106
% of renters here:
22%
State:
32%
March 2022 cost of living index in zip code 64832: 77.0 (low, U.S. average is 100)
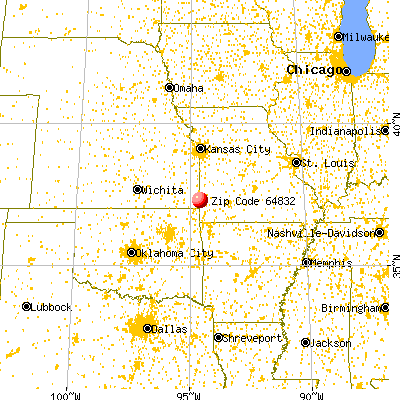
Land area: 70.9 sq. mi. Water area: 1.0 sq. mi.
Population density: 19 people per square mile
(very low).
OSM Map
General Map
Google Map
MSN Map
OSM Map
General Map
Google Map
MSN Map
OSM Map
General Map
Google Map
MSN Map
OSM Map
General Map
Google Map
MSN Map
Please wait while loading the map...
Real estate property taxes paid for housing units in 2022:
This zip code:
0.5% ($846)
Missouri:
0.8% ($1,810)
Median real estate property taxes paid for housing units with mortgages in 2022: $1,010 (1.3%) Median real estate property taxes paid for housing units with no mortgage in 2022: $826 (0.9%)
Business Search- 14 Million verified businesses
Males: 773
(57.5%)
Females: 571
(42.5%)
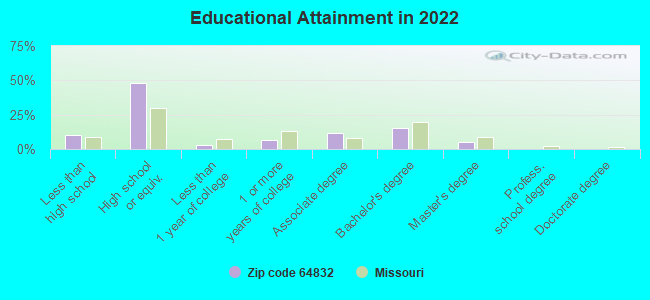
For population 25 years and over in 64832:
High school or higher: 88.9%
Bachelor's degree or higher: 20.3%
Graduate or professional degree: 5.2%
Unemployed: 5.7%
Mean travel time to work (commute): 30.0 minutes
For population 15 years and over in 64832:
Never married: 19.4%
Now married: 48.6%
Separated: 5.7%
Widowed: 6.9%
Divorced: 19.5%
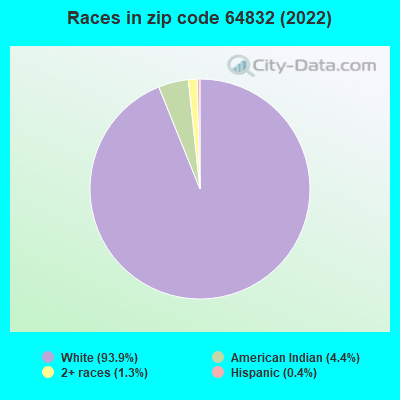
Zip code 64832 compared to state average:
Black race population percentage significantly below state average.
Hispanic race population percentage significantly below state average.
Median age significantly above state average.
Foreign-born population percentage significantly below state average.
Length of stay since moving in significantly above state average.
Number of college students significantly below state average.
Estimated median house/condo value in 2022: $180,266
64832:
$180,266
Missouri:
$221,200
According to our research of Missouri and other state lists, there were 2 registered sex offenders living in 64832 zip code as of June 16, 2024. The ratio of all residents to sex offenders in zip code 64832 is 323 to 1. The ratio of registered sex offenders to all residents in this zip code is near the state average.
Median resident age:
This zip code:
54.2 years
Missouri median age:
39.1 years
Average household size:
This zip code:
2.8 people
Missouri:
2.4 people
Averages for the 2020 tax year for zip code 64832, filed in 2021:
Average Adjusted Gross Income (AGI) in 2020: $47,431 (Individual Income Tax Returns)
Here:
$47,431
State:
$68,151
Salary/wage: $43,050 (reported on 75.0% of returns)
Here:
$43,050
State:
$56,131
(% of AGI for various income ranges: 1268.8% for AGIs below $25k, 3728.6% for AGIs $25k-50k, 7150.0% for AGIs $50k-75k, 6980.0% for AGIs $75k-100k)
Taxable interest for individuals: $244 (reported on 28.1% of returns)
This zip code:
$244
Missouri:
$1,586
(% of AGI for various income ranges: 11.2% for AGIs below $25k, 5.7% for AGIs $25k-50k, 22.5% for AGIs $75k-100k)
Ordinary dividends: $1,180 (reported on 15.6% of returns)
Here:
$1,180
State:
$10,947
(% of AGI for various income ranges: 43.8% for AGIs below $25k, 60.0% for AGIs $75k-100k)
Net capital gain/loss in AGI: +$3,060 (reported on 15.6% of returns)
Here:
+$3,060
State:
+$18,453
(% of AGI for various income ranges: 145.0% for AGIs below $25k, 185.0% for AGIs $50k-75k)
Profit/loss from business: +$3,740 (reported on 15.6% of returns)
Here:
+$3,740
State:
+$12,260
(% of AGI for various income ranges: 267.1% for AGIs $25k-50k)
Taxable individual retirement arrangement distribution: $8,667 (reported on 9.4% of returns)
64832:
$8,667
Missouri:
$19,719
(% of AGI for various income ranges: 371.4% for AGIs $25k-50k)
Earned income credit: $2,017 (reported on 18.8% of returns)
Here:
$2,017
State:
$2,315
(% of AGI for various income ranges: 86.2% for AGIs below $25k, 74.3% for AGIs $25k-50k)
Percentage of individuals using paid preparers for their 2020 taxes: 93.8%
Here:
94%
State:
93%
(% for various income ranges: 91.7% for AGIs below $25k, 100.0% for AGIs $25k-50k, 75.0% for AGIs $50k-75k, 100.0% for AGIs $75k-100k, 100.0% for AGIs $100k-200k)
Averages for the 2012 tax year for zip code 64832, filed in 2013:
Average Adjusted Gross Income (AGI) in 2012: $47,647 (Individual Income Tax Returns)
Here:
$47,647
State:
$55,896
Salary/wage: $38,720 (reported on 83.3% of returns)
Here:
$38,720
State:
$46,205
(% of AGI for various income ranges: 73.4% for AGIs below $25k, 81.2% for AGIs $25k-50k, 77.7% for AGIs $50k-75k, 76.8% for AGIs $75k-100k, 47.8% for AGIs $100k-200k)
Taxable interest for individuals: $590 (reported on 33.3% of returns)
This zip code:
$590
Missouri:
$1,559
(% of AGI for various income ranges: 1.8% for AGIs below $25k, 0.6% for AGIs $25k-50k, 0.5% for AGIs $50k-75k)
Ordinary dividends: $967 (reported on 20.0% of returns)
Here:
$967
State:
$7,410
Net capital gain/loss in AGI: +$5,575 (reported on 13.3% of returns)
Here:
+$5,575
State:
+$11,579
Profit/loss from business: +$2,933 (reported on 10.0% of returns)
Here:
+$2,933
State:
+$11,688
Taxable individual retirement arrangement distribution: $4,050 (reported on 6.7% of returns)
64832:
$4,050
Missouri:
$14,773
Total itemized deductions: $22,900 (22% of AGI, reported on 20.0% of returns)
Here:
$22,900
State:
$22,730
Here:
22.5% of AGI
State:
19.2% of AGI
Charity contributions: $4,425 (reported on 13.3% of returns)
Here:
$4,425
State:
$4,745
Taxes paid: $5,900 (reported on 20.0% of returns)
64832:
$5,900
State:
$8,399
Earned income credit: $1,717 (reported on 20.0% of returns)
Here:
$1,717
State:
$2,288
(% of AGI for various income ranges: 5.8% for AGIs below $25k, 1.2% for AGIs $25k-50k)
Percentage of individuals using paid preparers for their 2012 taxes: 70.0%
Here:
70%
State:
55%
(% for various income ranges: 54.5% for AGIs below $25k, 75.0% for AGIs $25k-50k, 120.0% for AGIs $50k-75k, 100.0% for AGIs $100k-200k)
Averages for the 2004 tax year for zip code 64832, filed in 2005:
Average Adjusted Gross Income (AGI) in 2004: $38,259 (Individual Income Tax Returns)
Here:
$38,259
State:
$44,591
Salary/wage: $33,409 (reported on 81.0% of returns)
Here:
$33,409
State:
$38,941
(% of AGI for various income ranges: 103.8% for AGIs below $10k, 71.6% for AGIs $10k-25k, 84.8% for AGIs $25k-50k, 83.1% for AGIs $50k-75k, 86.2% for AGIs $75k-100k, 40.3% for AGIs over 100k)
Taxable interest for individuals: $1,017 (reported on 40.3% of returns)
This zip code:
$1,017
Missouri:
$1,801
(% of AGI for various income ranges: 8.8% for AGIs below $10k, 3.2% for AGIs $10k-25k, 0.8% for AGIs $25k-50k, 0.5% for AGIs $50k-75k, 0.3% for AGIs $75k-100k, 0.4% for AGIs over 100k)
Taxable dividends: $797 (reported on 22.1% of returns)
Here:
$797
State:
$3,677
(% of AGI for various income ranges: 1.0% for AGIs $10k-25k, 0.1% for AGIs $25k-50k, 0.1% for AGIs $50k-75k, 2.7% for AGIs $75k-100k)
Net capital gain/loss: +$7,806 (reported on 12.4% of returns)
Here:
+$7,806
State:
+$8,915
Total itemized deductions: $14,979 (16% of AGI, reported on 16.6% of returns)
Here:
$14,979
State:
$18,261
Here:
15.8% of AGI
State:
20.5% of AGI
Charity contributions deductions: $1,949 (3% of AGI, reported on 13.4% of returns)
Here:
$1,949
State:
$3,665
Here:
2.9% of AGI
State:
3.9% of AGI
Total tax: $4,394 (reported on 71.7% of returns)
64832:
$4,394
State:
$6,999
(% of AGI for various income ranges: 2.9% for AGIs below $10k, 4.4% for AGIs $10k-25k, 5.8% for AGIs $25k-50k, 8.8% for AGIs $50k-75k, 9.2% for AGIs $75k-100k, 11.9% for AGIs over 100k)
Earned income credit: $1,600 (reported on 17.2% of returns)
Here:
$1,600
State:
$1,728
Percentage of individuals using paid preparers for their 2004 taxes: 71.7%
Here:
72%
State:
62%
(% for various income ranges: 67.7% for AGIs below $10k, 68.4% for AGIs $10k-25k, 71.4% for AGIs $25k-50k, 71.4% for AGIs $50k-75k, 92.9% for AGIs $75k-100k, 92.3% for AGIs over 100k)
Household received Food Stamps/SNAP in the past 12 months: 16 Household did not receive Food Stamps/SNAP in the past 12 months: 466
Women who had a birth in the past 12 months: 4 (1 now married, 3 unmarried) Women who did not have a birth in the past 12 months: 133 (52 now married, 81 unmarried)
Housing units in zip code 64832 with a mortgage: 133 (39 second mortgage, 18 both second mortgage and home equity loan) Houses without a mortgage: 44
Median monthly owner costs for units with a mortgage: $1,009 Median monthly owner costs for units without a mortgage: $404
Residents with income below the poverty level in 2022:
This zip code:
15.3%
Whole state:
13.2%
Residents with income below 50% of the poverty level in 2022:
This zip code:
10.6%
Whole state:
6.8%
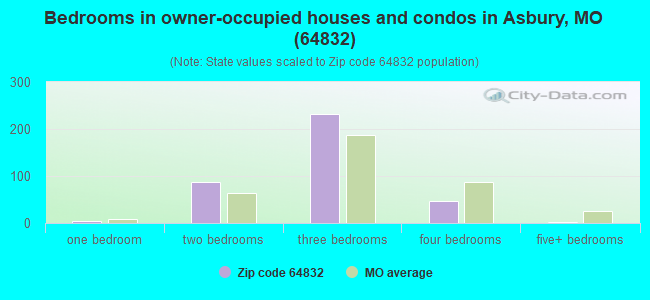
Median number of rooms in houses and condos:
Here:
6.3
State:
6.4
Median number of rooms in apartments:
Here:
6.7
State:
4.4
Notable locations in this zip code not listed on our city pages
Notable locations in zip code 64832: Georgia City (A), Asbury Fire Protection District Station 2 (B), Carl Junction Fire Protection District Station 3 (C), Asbury Fire Protection District Station 1 (D). Display/hide their locations on the map
Reservoirs: Asbury Farms Lake (A), Herr Lake (B), Number 180 Reservoir (C), Doran Lake (D), Browning West Lake (E), Blackberry Hay Farm Lake (F), Moss Lake (G). Display/hide their locations on the map
Streams, rivers, and creeks: Little North Fork (A), Blackberry Creek (B), North Fork Spring River (C), Glendale Fork (D), Pond Creek (E). Display/hide their locations on the map
Size of family households: 194 2-persons, 60 3-persons, 29 4-persons, 17 5-persons, 65 6-persons, 2 7-or-more-persons
Size of nonfamily households: 42 1-person, 75 2-persons
104 married couples with children.
11 single-parent households (11 women).
99.7% of residents of 64832 zip code speak English at home.
0.5% of residents speak Spanish at home (83% well, 17% not well).
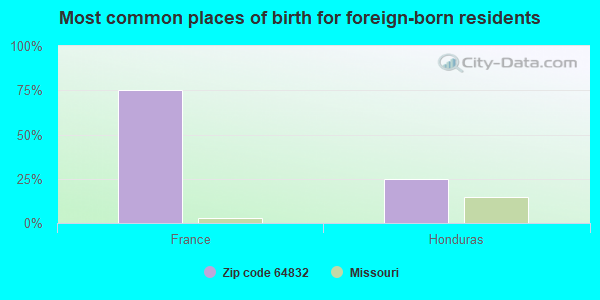
Foreign born population: 4 (0.4%) (40.3% of them are naturalized citizens)
This zip code:
0.4%
Whole state:
4.1%
75%France
25%Honduras
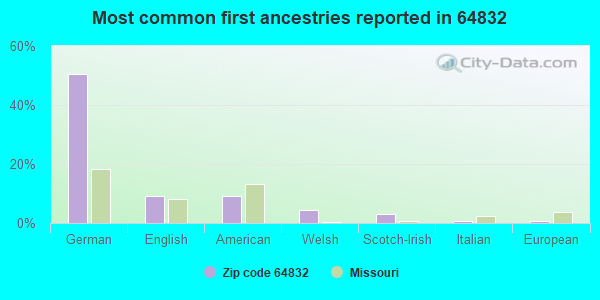
51%German
9%English
9%American
4%Welsh
3%Scotch-Irish
1%Italian
1%European
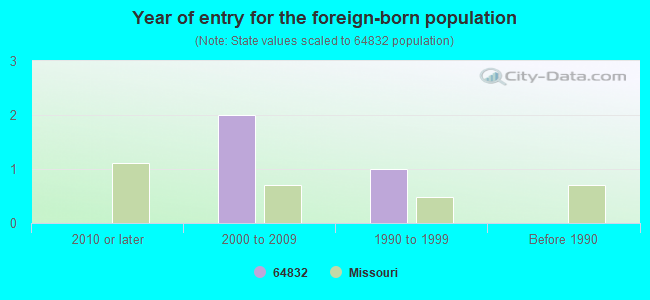
Year of entry for the foreign-born population
02010 or later
22000 to 2009
11990 to 1999
0Before 1990
Facilities with environmental interests located in this zip code:
ASBURY GENERATING STATION (21133 UPHILL LANE in ASBURY, MO)
AIR MAJOR (AIRS/AFS) AIR PROGRAM (Clean Air Markets Division Business System) STATE MASTER (Missouri monitoring and compilance) - CAMDBS-2076, AIR PROGRAM, NEI-290970001, NET-290970001, TRIS-64833SBRYG21133, TRI REPORTER, AIRS/AFS-MO0061405, AIR MAJOR, PCS-MO0095362, NPDES NON-MAJOR, RCRAINFO-MOD000766899, SQG, NEI-NTI7483, AIR PROGRAM, NTI-NTI7483, CRITERIA AND HAZARDOUS AIR POLLUTANT INVENTORY (Inventory of air pollution sources) National Pollutant Discharge Elimination System NON-MAJOR (Tracking pollutant discharge elimination systems) - permit Small Quantity Generators, between 100 kg and 1000 kg of hazardous waste/month (Resource Conservation and Recovery Act (tracking hazardous waste)) - notification TRI REPORTER (Tracking of toxic chemicals releasing facilities) Business SIC classification: ELECTRIC SERVICES Business NAICS classification: HYDROELECTRIC POWER GENERATION. Organizations: EMPIRE DIST ELECT CO (CONTACT/OWNER)
, EMPIRE DIST ELECTRIC CO (CONTACT/OWNER)
, EMPIRE DISTRICT ELECTRIC COMPANY (OWNER/OPERATOR)
Alternative names: EMPIRE, ASBURY PP, EMPIRE DIST ELECTRIC CO, EMPIRE DIST ELEC CO ASBURY PLANT
FORMER WITTER CO SITE (STILWELL AND MAIN STS in ASBURY, MO)
(Integrated Compliance Information System) - ICIS-07-2000-0079, FORMAL ENFORCEMENT ACTION STATE MASTER (Missouri monitoring and compilance) - ICIS-36747, ENFORCEMENT/COMPLIANCE ACTIVITY
ASBURY WASTE WATER TREATMENT FACILITY C/O CITY HALL (450 MAIN STREET in ASBURY, MO)
STATE MASTER (Missouri monitoring and compilance) - PCS-MO0114740, NPDES NON-MAJOR National Pollutant Discharge Elimination System NON-MAJOR (Tracking pollutant discharge elimination systems) - permit Business SIC classification: SEWERAGE SYSTEMS Organizations: ASBURY CITY OF (CONTACT/OWNER)
Alternative names: ASBURY WWTF
PITTSBURG & MIDWAY COAL MINING CO (RTE 1 in ASBURY, MO)
STATE MASTER (Missouri monitoring and compilance) - RCRAINFO-MOD095831251, NOT IN A UNIVERSE (Resource Conservation and Recovery Act (tracking hazardous waste))
PITTSBURG AND MIDWAY (107 WEST ELEVENTH STREET in ASBURY, MO)
AIR MAJOR (AIRS/AFS) STATE MASTER (Missouri monitoring and compilance) - AIRS/AFS-MO0058418, AIR MAJOR
Housing units lacking complete plumbing facilities: 0.7% Housing units lacking complete kitchen facilities: 0.7%
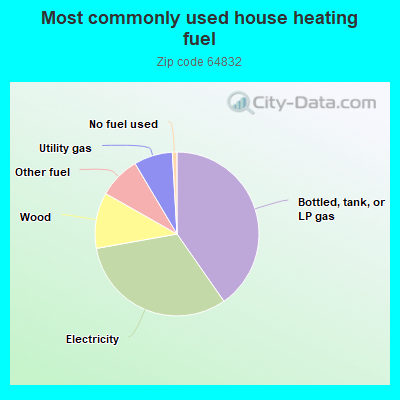
40.6%Bottled, tank, or LP gas
32.1%Electricity
11.1%Wood
8.3%Other fuel
7.7%Utility gas
0.9%No fuel used
Population in 1990: 603. Population change in the 1990s: +121 (+20.1%).
Place of birth for U.S.-born residents:
This state: 767
Northeast: 13
Midwest: 229
South: 285
West: 46
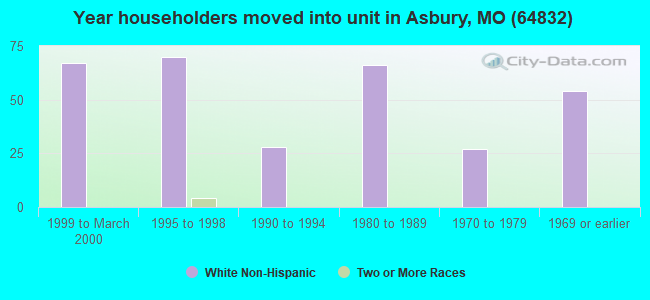
62% of the 64832 zip code residents lived in the same house 5 years ago. Out of people who lived in different houses, 39% lived in this county. Out of people who lived in different counties, 50% lived in Missouri.
86% of the 64832 zip code residents lived in the same house 1 year ago. Out of people who lived in different houses, 43% moved from this county. Out of people who lived in different houses, 4% moved from different county within same state. Out of people who lived in different houses, 53% moved from different state.
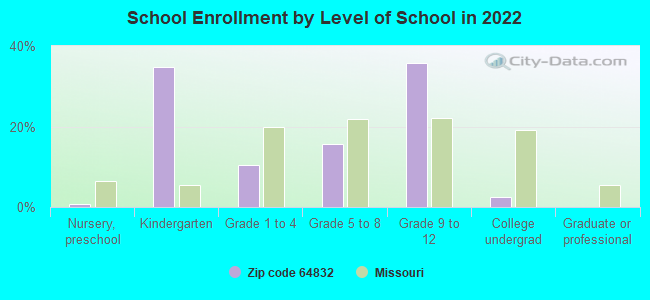
Private vs. public school enrollment:
Students in private schools in grades 1 to 8 (elementary and middle school): 3
Here:
5.5%
Missouri:
15.4%
Students in private schools in grades 9 to 12 (high school): 4
Here:
5.0%
Missouri:
13.9%
Students in private undergraduate colleges: 4
Here:
69.9%
Missouri:
22.6%
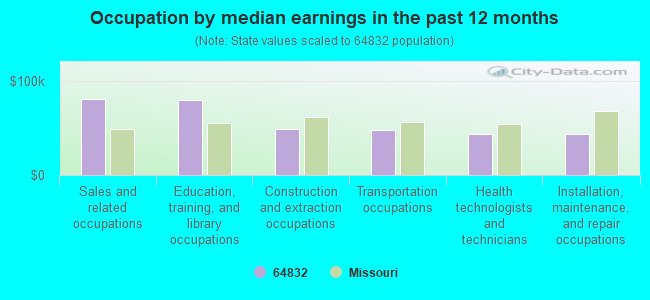
Occupation by median earnings in the past 12 months ($)
80,473Sales and related occupations
78,981Education, training, and library occupations
48,257Construction and extraction occupations
48,125Transportation occupations
43,763Health technologists and technicians
43,091Installation, maintenance, and repair occupations
Top industries in this zip code by the number of employees in 2005:
Utilities: Fossil Fuel Electric Power Generation (50-99 employees: 1 establishment)
Construction: Electrical Contractors (1-4: 2)
Other Services (except Public Administration): Beauty Salons (1-4: 1)
Administrative and Support and Waste Management and Remediation Services: Solid Waste Landfill (1-4: 1)
Wholesale Trade: Automobile and Other Motor Vehicle Merchant Wholesalers (1-4: 1)
People in group quarters in 2000:
12 people in homes for the mentally retarded
Fatal accident statistics in 2014:
Fatal accident count: 1
Vehicles involved in fatal accidents: 1
Fatal accidents caused by drunken drivers: 1
Fatalities: 1
Persons involved in fatal accidents: 1
Pedestrians involved in fatal accidents: 0
Fatal accident statistics in 2012:
Fatal accident count: 2
Vehicles involved in fatal accidents: 2
Fatal accidents caused by drunken drivers: 1
Fatalities: 2
Persons involved in fatal accidents: 5
Pedestrians involved in fatal accidents: 0
Home Mortgage Disclosure Act Aggregated Statistics For Year 2009 (Based on 2 partial tracts)
A) FHA, FSA/RHS & VA Home Purchase Loans
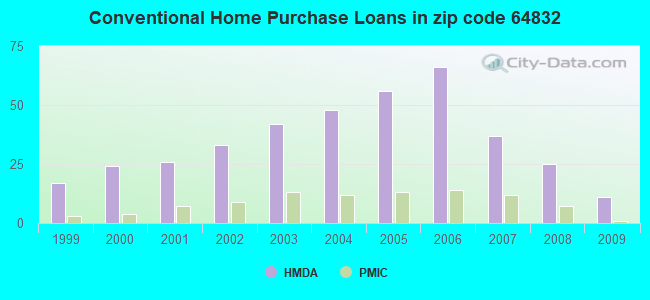
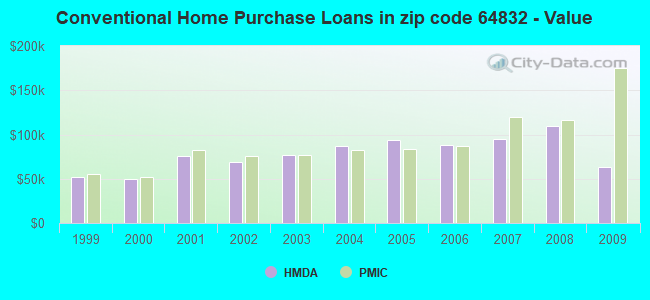
B) Conventional Home Purchase Loans
C) Refinancings
D) Home Improvement Loans
F) Non-occupant Loans on < 5 Family Dwellings (A B C & D)
G) Loans On Manufactured Home Dwelling (A B C & D)
Number
Average Value
Number
Average Value
Number
Average Value
Number
Average Value
Number
Average Value
Number
Average Value
LOANS ORIGINATED
17
$108,393
11
$63,229
57
$115,525
6
$35,950
3
$82,463
5
$58,986
APPLICATIONS APPROVED, NOT ACCEPTED
1
$131,620
1
$73,510
5
$120,878
0
$0
0
$0
1
$111,810
APPLICATIONS DENIED
3
$74,980
6
$51,430
20
$104,240
4
$39,618
1
$72,190
4
$37,088
APPLICATIONS WITHDRAWN
5
$98,428
2
$88,260
7
$133,380
1
$18,490
0
$0
1
$101,690
FILES CLOSED FOR INCOMPLETENESS
0
$0
0
$0
2
$66,250
0
$0
0
$0
0
$0
Aggregated Statistics For Year 2008 (Based on 2 partial tracts)
A) FHA, FSA/RHS & VA Home Purchase Loans
B) Conventional Home Purchase Loans
C) Refinancings
D) Home Improvement Loans
F) Non-occupant Loans on < 5 Family Dwellings (A B C & D)
G) Loans On Manufactured Home Dwelling (A B C & D)
Number
Average Value
Number
Average Value
Number
Average Value
Number
Average Value
Number
Average Value
Number
Average Value
LOANS ORIGINATED
14
$90,115
25
$110,068
37
$104,018
5
$35,040
11
$90,161
6
$64,048
APPLICATIONS APPROVED, NOT ACCEPTED
0
$0
3
$40,647
4
$68,340
0
$0
0
$0
1
$67,790
APPLICATIONS DENIED
3
$84,813
7
$109,987
32
$112,237
7
$54,584
0
$0
3
$81,877
APPLICATIONS WITHDRAWN
1
$105,650
3
$76,887
8
$140,039
0
$0
1
$42,700
0
$0
FILES CLOSED FOR INCOMPLETENESS
0
$0
0
$0
3
$76,007
0
$0
0
$0
0
$0
Aggregated Statistics For Year 2007 (Based on 2 partial tracts)
A) FHA, FSA/RHS & VA Home Purchase Loans
B) Conventional Home Purchase Loans
C) Refinancings
D) Home Improvement Loans
F) Non-occupant Loans on < 5 Family Dwellings (A B C & D)
G) Loans On Manufactured Home Dwelling (A B C & D)
Number
Average Value
Number
Average Value
Number
Average Value
Number
Average Value
Number
Average Value
Number
Average Value
LOANS ORIGINATED
8
$101,081
37
$95,095
40
$121,847
11
$31,815
4
$100,915
6
$52,603
APPLICATIONS APPROVED, NOT ACCEPTED
0
$0
7
$97,284
7
$120,426
1
$112,250
0
$0
2
$64,050
APPLICATIONS DENIED
1
$108,730
9
$75,372
29
$98,559
15
$50,300
3
$58,547
7
$59,490
APPLICATIONS WITHDRAWN
0
$0
7
$66,721
8
$97,614
2
$50,185
1
$129,860
0
$0
FILES CLOSED FOR INCOMPLETENESS
0
$0
1
$135,140
3
$176,813
0
$0
0
$0
0
$0
Aggregated Statistics For Year 2006 (Based on 2 partial tracts)
A) FHA, FSA/RHS & VA Home Purchase Loans
B) Conventional Home Purchase Loans
C) Refinancings
D) Home Improvement Loans
F) Non-occupant Loans on < 5 Family Dwellings (A B C & D)
G) Loans On Manufactured Home Dwelling (A B C & D)
Number
Average Value
Number
Average Value
Number
Average Value
Number
Average Value
Number
Average Value
Number
Average Value
LOANS ORIGINATED
8
$107,299
66
$88,053
62
$96,936
15
$44,167
12
$87,527
12
$58,913
APPLICATIONS APPROVED, NOT ACCEPTED
1
$90,680
10
$87,732
7
$107,094
1
$25,530
1
$28,170
3
$66,763
APPLICATIONS DENIED
1
$129,860
13
$135,514
35
$102,516
7
$34,524
2
$56,565
6
$53,192
APPLICATIONS WITHDRAWN
0
$0
5
$78,092
18
$89,654
3
$58,400
2
$111,150
1
$35,220
FILES CLOSED FOR INCOMPLETENESS
0
$0
1
$140,420
3
$123,257
0
$0
0
$0
0
$0
Aggregated Statistics For Year 2005 (Based on 2 partial tracts)
A) FHA, FSA/RHS & VA Home Purchase Loans
B) Conventional Home Purchase Loans
C) Refinancings
D) Home Improvement Loans
F) Non-occupant Loans on < 5 Family Dwellings (A B C & D)
G) Loans On Manufactured Home Dwelling (A B C & D)
Number
Average Value
Number
Average Value
Number
Average Value
Number
Average Value
Number
Average Value
Number
Average Value
LOANS ORIGINATED
11
$91,001
56
$93,818
52
$91,536
10
$27,204
9
$83,931
15
$65,883
APPLICATIONS APPROVED, NOT ACCEPTED
2
$80,555
7
$90,116
10
$94,467
0
$0
0
$0
3
$51,503
APPLICATIONS DENIED
2
$58,985
18
$77,769
40
$96,558
8
$28,502
2
$51,505
13
$50,962
APPLICATIONS WITHDRAWN
0
$0
6
$78,062
30
$116,976
4
$103,668
0
$0
1
$73,950
FILES CLOSED FOR INCOMPLETENESS
0
$0
3
$65,590
6
$80,190
0
$0
0
$0
0
$0
Aggregated Statistics For Year 2004 (Based on 2 partial tracts)
A) FHA, FSA/RHS & VA Home Purchase Loans
B) Conventional Home Purchase Loans
C) Refinancings
D) Home Improvement Loans
F) Non-occupant Loans on < 5 Family Dwellings (A B C & D)
G) Loans On Manufactured Home Dwelling (A B C & D)
Number
Average Value
Number
Average Value
Number
Average Value
Number
Average Value
Number
Average Value
Number
Average Value
LOANS ORIGINATED
5
$89,360
48
$87,141
57
$91,569
13
$36,774
7
$54,647
13
$55,702
APPLICATIONS APPROVED, NOT ACCEPTED
0
$0
7
$93,134
10
$82,538
1
$14,530
0
$0
1
$77,920
APPLICATIONS DENIED
1
$45,780
22
$75,655
50
$96,148
8
$30,099
2
$81,215
9
$63,829
APPLICATIONS WITHDRAWN
0
$0
4
$98,825
25
$82,758
3
$53,997
2
$61,190
4
$84,408
FILES CLOSED FOR INCOMPLETENESS
0
$0
3
$78,650
7
$91,247
0
$0
0
$0
0
$0
Aggregated Statistics For Year 2003 (Based on 2 partial tracts)
A) FHA, FSA/RHS & VA Home Purchase Loans
B) Conventional Home Purchase Loans
C) Refinancings
D) Home Improvement Loans
F) Non-occupant Loans on < 5 Family Dwellings (A B C & D)
Number
Average Value
Number
Average Value
Number
Average Value
Number
Average Value
Number
Average Value
LOANS ORIGINATED
9
$80,997
42
$77,150
88
$85,604
9
$12,472
11
$55,185
APPLICATIONS APPROVED, NOT ACCEPTED
0
$0
2
$44,460
14
$78,953
0
$0
1
$61,630
APPLICATIONS DENIED
0
$0
9
$67,938
51
$77,199
8
$12,931
4
$56,015
APPLICATIONS WITHDRAWN
1
$89,360
3
$67,350
26
$69,196
1
$21,570
0
$0
FILES CLOSED FOR INCOMPLETENESS
0
$0
1
$64,710
8
$85,014
0
$0
0
$0
Aggregated Statistics For Year 2002 (Based on 2 partial tracts)
A) FHA, FSA/RHS & VA Home Purchase Loans
B) Conventional Home Purchase Loans
C) Refinancings
D) Home Improvement Loans
F) Non-occupant Loans on < 5 Family Dwellings (A B C & D)
Number
Average Value
Number
Average Value
Number
Average Value
Number
Average Value
Number
Average Value
LOANS ORIGINATED
9
$79,726
33
$68,431
71
$70,172
7
$14,339
5
$51,768
APPLICATIONS APPROVED, NOT ACCEPTED
2
$56,345
2
$63,170
7
$94,831
2
$6,825
0
$0
APPLICATIONS DENIED
1
$92,880
9
$53,362
30
$68,422
2
$5,060
3
$57,520
APPLICATIONS WITHDRAWN
1
$122,820
5
$80,380
20
$72,545
2
$18,490
0
$0
FILES CLOSED FOR INCOMPLETENESS
0
$0
0
$0
1
$63,830
0
$0
0
$0
Aggregated Statistics For Year 2001 (Based on 2 partial tracts)
A) FHA, FSA/RHS & VA Home Purchase Loans
B) Conventional Home Purchase Loans
C) Refinancings
D) Home Improvement Loans
F) Non-occupant Loans on < 5 Family Dwellings (A B C & D)
Number
Average Value
Number
Average Value
Number
Average Value
Number
Average Value
Number
Average Value
LOANS ORIGINATED
9
$64,562
26
$75,884
71
$73,172
12
$21,827
6
$38,738
APPLICATIONS APPROVED, NOT ACCEPTED
0
$0
3
$73,807
4
$71,972
0
$0
0
$0
APPLICATIONS DENIED
1
$56,790
17
$57,485
31
$71,270
4
$14,638
2
$95,965
APPLICATIONS WITHDRAWN
0
$0
2
$31,915
21
$74,624
0
$0
0
$0
FILES CLOSED FOR INCOMPLETENESS
1
$94,640
0
$0
3
$65,883
0
$0
0
$0
Aggregated Statistics For Year 2000 (Based on 2 partial tracts)
A) FHA, FSA/RHS & VA Home Purchase Loans
B) Conventional Home Purchase Loans
C) Refinancings
D) Home Improvement Loans
F) Non-occupant Loans on < 5 Family Dwellings (A B C & D)
Number
Average Value
Number
Average Value
Number
Average Value
Number
Average Value
Number
Average Value
LOANS ORIGINATED
7
$74,897
24
$49,486
33
$54,665
12
$28,503
6
$28,027
APPLICATIONS APPROVED, NOT ACCEPTED
1
$73,510
3
$43,580
7
$46,096
3
$14,233
0
$0
APPLICATIONS DENIED
2
$62,290
14
$48,988
17
$69,267
6
$14,820
1
$40,940
APPLICATIONS WITHDRAWN
2
$56,565
4
$70,102
9
$58,791
0
$0
0
$0
FILES CLOSED FOR INCOMPLETENESS
0
$0
0
$0
1
$26,410
0
$0
0
$0
Aggregated Statistics For Year 1999 (Based on 1 partial tract)
A) FHA, FSA/RHS & VA Home Purchase Loans
B) Conventional Home Purchase Loans
C) Refinancings
D) Home Improvement Loans
F) Non-occupant Loans on < 5 Family Dwellings (A B C & D)
Detailed PMIC statistics for the following Tracts:0122.00
2002 - 2018 National Fire Incident Reporting System (NFIRS) incidents
According to the data from the years 2002 - 2018 the average number of fire incidents per year is 9. The highest number of reported fires - 22 took place in 2014, and the least - 0 in 2009. The data has an increasing trend.
When looking into fire subcategories, the most incidents belonged to: Outside Fires (69.8%), and Structure Fires (20.8%).
Fire incident types reported to NFIRS in Zip Code 64832


 Nearest zip codes: 66760, 64855, 64769, 66762, 64834, 64849.


 According to the data from the years 2002 - 2018 the average number of fire incidents per year is 9. The highest number of reported fires - 22 took place in 2014, and the least - 0 in 2009. The data has an increasing trend.
 When looking into fire subcategories, the most incidents belonged to: Outside Fires (69.8%), and Structure Fires (20.8%).