Estimated median house/condo value in 2022: $99,063
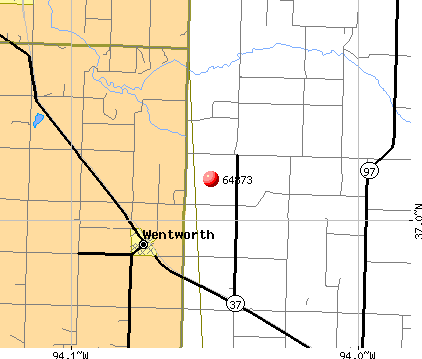
64873:
$99,063
Missouri:
$221,200
According to our research of Missouri and other state lists, there were 4 registered sex offenders living in 64873 zip code as of June 16, 2024. The ratio of all residents to sex offenders in zip code 64873 is 292 to 1. The ratio of registered sex offenders to all residents in this zip code is near the state average.
Median resident age:
This zip code:
51.8 years
Missouri median age:
39.1 years
Average household size:
This zip code:
2.5 people
Missouri:
2.4 people
Averages for the 2020 tax year for zip code 64873, filed in 2021:
Average Adjusted Gross Income (AGI) in 2020: $43,809 (Individual Income Tax Returns)
Here:
$43,809
State:
$68,151
Salary/wage: $42,065 (reported on 77.3% of returns)
Here:
$42,065
State:
$56,131
(% of AGI for various income ranges: 1349.1% for AGIs below $25k, 3981.0% for AGIs $25k-50k, 8043.3% for AGIs $50k-75k, 10880.0% for AGIs $75k-100k, 15800.0% for AGIs $100k-200k)
Taxable interest for individuals: $475 (reported on 27.3% of returns)
This zip code:
$475
Missouri:
$1,586
(% of AGI for various income ranges: 4.5% for AGIs below $25k, 21.0% for AGIs $25k-50k, 103.3% for AGIs $75k-100k)
Ordinary dividends: $1,180 (reported on 11.4% of returns)
Here:
$1,180
State:
$10,947
(% of AGI for various income ranges: 20.0% for AGIs below $25k, 123.3% for AGIs $75k-100k)
Net capital gain/loss in AGI: +$4,560 (reported on 11.4% of returns)
Here:
+$4,560
State:
+$18,453
(% of AGI for various income ranges: 98.0% for AGIs $25k-50k, 433.3% for AGIs $75k-100k)
Profit/loss from business: +$4,511 (reported on 20.5% of returns)
Here:
+$4,511
State:
+$12,260
(% of AGI for various income ranges: 180.0% for AGIs below $25k, 199.0% for AGIs $25k-50k, 30.0% for AGIs $50k-75k)
Taxable individual retirement arrangement distribution: $11,267 (reported on 6.8% of returns)
64873:
$11,267
Missouri:
$19,719
(% of AGI for various income ranges: 307.3% for AGIs below $25k)
Earned income credit: $2,350 (reported on 22.7% of returns)
Here:
$2,350
State:
$2,315
(% of AGI for various income ranges: 116.4% for AGIs below $25k, 107.0% for AGIs $25k-50k)
Percentage of individuals using paid preparers for their 2020 taxes: 93.2%
Here:
93%
State:
93%
(% for various income ranges: 93.8% for AGIs below $25k, 92.9% for AGIs $25k-50k, 100.0% for AGIs $50k-75k, 100.0% for AGIs $75k-100k, 75.0% for AGIs $100k-200k)
Averages for the 2012 tax year for zip code 64873, filed in 2013:
Average Adjusted Gross Income (AGI) in 2012: $36,100 (Individual Income Tax Returns)
Here:
$36,100
State:
$55,896
Salary/wage: $35,352 (reported on 79.5% of returns)
Here:
$35,352
State:
$46,205
(% of AGI for various income ranges: 72.7% for AGIs below $25k, 82.3% for AGIs $25k-50k, 86.6% for AGIs $50k-75k, 66.8% for AGIs $75k-100k)
Taxable interest for individuals: $420 (reported on 25.6% of returns)
This zip code:
$420
Missouri:
$1,559
(% of AGI for various income ranges: 0.5% for AGIs below $25k, 0.2% for AGIs $25k-50k, 0.2% for AGIs $50k-75k, 0.3% for AGIs $75k-100k)
Ordinary dividends: $400 (reported on 17.9% of returns)
Here:
$400
State:
$7,410
Net capital gain/loss in AGI: +$2,814 (reported on 17.9% of returns)
Here:
+$2,814
State:
+$11,579
Profit/loss from business: +$9,514 (reported on 17.9% of returns)
Here:
+$9,514
State:
+$11,688
(% of AGI for various income ranges: 7.0% for AGIs below $25k, 6.3% for AGIs $25k-50k, 6.5% for AGIs $50k-75k)
Taxable individual retirement arrangement distribution: $10,300 (reported on 5.1% of returns)
64873:
$10,300
Missouri:
$14,773
Total itemized deductions: $16,220 (24% of AGI, reported on 12.8% of returns)
Here:
$16,220
State:
$22,730
Here:
24.0% of AGI
State:
19.2% of AGI
Charity contributions: $4,733 (reported on 7.7% of returns)
Here:
$4,733
State:
$4,745
Taxes paid: $3,920 (reported on 12.8% of returns)
64873:
$3,920
State:
$8,399
Earned income credit: $2,722 (reported on 23.1% of returns)
Here:
$2,722
State:
$2,288
(% of AGI for various income ranges: 8.1% for AGIs below $25k, 1.8% for AGIs $25k-50k)
Percentage of individuals using paid preparers for their 2012 taxes: 69.2%
Here:
69%
State:
55%
(% for various income ranges: 64.7% for AGIs below $25k, 72.7% for AGIs $25k-50k, 71.4% for AGIs $50k-75k, 75.0% for AGIs $75k-100k)
Averages for the 2004 tax year for zip code 64873, filed in 2005:
Average Adjusted Gross Income (AGI) in 2004: $28,810 (Individual Income Tax Returns)
Here:
$28,810
State:
$44,591
Salary/wage: $30,423 (reported on 80.7% of returns)
Here:
$30,423
State:
$38,941
(% of AGI for various income ranges: 131.8% for AGIs below $10k, 79.5% for AGIs $10k-25k, 85.9% for AGIs $25k-50k, 85.2% for AGIs $50k-75k, 81.6% for AGIs $75k-100k)
Taxable interest for individuals: $897 (reported on 39.9% of returns)
This zip code:
$897
Missouri:
$1,801
(% of AGI for various income ranges: 10.8% for AGIs below $10k, 2.1% for AGIs $10k-25k, 1.3% for AGIs $25k-50k, 0.4% for AGIs $50k-75k)
Taxable dividends: $483 (reported on 24.5% of returns)
Here:
$483
State:
$3,677
(% of AGI for various income ranges: 4.8% for AGIs below $10k, 0.4% for AGIs $10k-25k, 0.4% for AGIs $25k-50k, 0.2% for AGIs $50k-75k)
Net capital gain/loss: +$2,538 (reported on 22.0% of returns)
Here:
+$2,538
State:
+$8,915
(% of AGI for various income ranges: 2.9% for AGIs below $10k, 3.2% for AGIs $10k-25k, 3.1% for AGIs $25k-50k, 0.8% for AGIs $50k-75k)
Profit/loss from business: +$4,684 (reported on 15.7% of returns)
Here:
+$4,684
State:
+$9,793
Total itemized deductions: $16,304 (27% of AGI, reported on 15.4% of returns)
Here:
$16,304
State:
$18,261
Here:
27.2% of AGI
State:
20.5% of AGI
Charity contributions deductions: $4,217 (7% of AGI, reported on 12.7% of returns)
Here:
$4,217
State:
$3,665
Here:
7.1% of AGI
State:
3.9% of AGI
Total tax: $3,009 (reported on 64.2% of returns)
64873:
$3,009
State:
$6,999
(% of AGI for various income ranges: 3.2% for AGIs below $10k, 3.7% for AGIs $10k-25k, 5.3% for AGIs $25k-50k, 6.8% for AGIs $50k-75k, 12.8% for AGIs $75k-100k)
Earned income credit: $1,802 (reported on 22.3% of returns)
Here:
$1,802
State:
$1,728
Percentage of individuals using paid preparers for their 2004 taxes: 78.0%
Here:
78%
State:
62%
(% for various income ranges: 75.5% for AGIs below $10k, 76.3% for AGIs $10k-25k, 75.5% for AGIs $25k-50k, 88.9% for AGIs $50k-75k, 88.2% for AGIs $75k-100k)
Household received Food Stamps/SNAP in the past 12 months: 44 Household did not receive Food Stamps/SNAP in the past 12 months: 287
Women who had a birth in the past 12 months: 2 (1 now married, 1 unmarried) Women who did not have a birth in the past 12 months: 114 (80 now married, 33 unmarried)
Housing units in zip code 64873 with a mortgage: 113 Median monthly owner costs for units with a mortgage: $646 Median monthly owner costs for units without a mortgage: $547
Residents with income below the poverty level in 2022:
This zip code:
7.2%
Whole state:
13.2%
Residents with income below 50% of the poverty level in 2022:
This zip code:
6.5%
Whole state:
6.8%
Median number of rooms in houses and condos:
Here:
5.7
State:
6.4
Notable locations in this zip code not listed on our city pages
Size of family households: 156 2-persons, 35 3-persons, 66 4-persons, 12 5-persons, 10 6-persons, 2 7-or-more-persons
Size of nonfamily households: 25 1-person, 19 2-persons
145 married couples with children.
1 single-parent households (1 men).
99.9% of residents of 64873 zip code speak English at home.
Foreign born population: 0 (0.0%)
:
0.0%
Whole state:
4.1%
18%German
13%American
9%English
3%Irish
1%Italian
0%Polish
Facilities with environmental interests located in this zip code:
P & K (30436 GREENBRIAR DR in WENTWORTH, MO)
National Pollutant Discharge Elimination System NON-MAJOR (Tracking pollutant discharge elimination systems) - permit Business SIC classification: BROILER, FRYER, AND ROASTER CHICKENS Organizations: PAO THAO AND KIA VANG (CONTACT/OWNER)
Alternative names: PAO THAO AND KIA VANG, THAO, PAO AND VANG, KIA
GRASSLANDS CONSULTANTS LL (HIGHWAY W in WENTWORTH, MO)
National Pollutant Discharge Elimination System NON-MAJOR (Tracking pollutant discharge elimination systems) - permit Business SIC classification: HEAVY CONSTRUCTION Alternative names: WENTWORTH DAIRY #2
Housing units lacking complete plumbing facilities: 4.9% Housing units lacking complete kitchen facilities: 4.0%
44.3%Electricity
28.7%Wood
22.4%Bottled, tank, or LP gas
5.3%Utility gas
Population in 1990: 1,211.
Place of birth for U.S.-born residents:
This state: 633
Northeast: 1
Midwest: 82
South: 51
West: 51
60% of the 64873 zip code residents lived in the same house 5 years ago. Out of people who lived in different houses, 17% lived in this county. Out of people who lived in different counties, 50% lived in Missouri.
100% of the 64873 zip code residents lived in the same house 1 year ago.
Private vs. public school enrollment:
Students in private schools in grades 1 to 8 (elementary and middle school): 14
Here:
27.5%
Missouri:
15.4%
Students in private schools in grades 9 to 12 (high school): 11
Here:
25.7%
Missouri:
13.9%
Students in private undergraduate colleges:
Here:
0.0%
Missouri:
22.6%
Occupation by median earnings in the past 12 months ($)
61,282Construction and extraction occupations
42,004Sales and related occupations
36,817Management occupations
28,869Farming, fishing, and forestry occupations
27,932Office and administrative support occupations
14,774Installation, maintenance, and repair occupations
Top industries in this zip code by the number of employees in 2005:
Health Care and Social Assistance: Other Individual and Family Services (1-4 employees: 1 establishment)
Construction: Poured Concrete Foundation and Structure Contractors (1-4: 1)
People in group quarters in 2000:
12 people in homes for the mentally retarded
Fatal accident statistics in 2013:
Fatal accident count: 1
Vehicles involved in fatal accidents: 1
Fatal accidents caused by drunken drivers: 0
Fatalities: 1
Persons involved in fatal accidents: 1
Pedestrians involved in fatal accidents: 0
Home Mortgage Disclosure Act Aggregated Statistics For Year 2009 (Based on 2 partial tracts)
A) FHA, FSA/RHS & VA Home Purchase Loans
B) Conventional Home Purchase Loans
C) Refinancings
D) Home Improvement Loans
F) Non-occupant Loans on < 5 Family Dwellings (A B C & D)
G) Loans On Manufactured Home Dwelling (A B C & D)
Number
Average Value
Number
Average Value
Number
Average Value
Number
Average Value
Number
Average Value
Number
Average Value
LOANS ORIGINATED
6
$96,698
6
$67,975
25
$108,337
3
$29,583
2
$72,790
5
$60,484
APPLICATIONS APPROVED, NOT ACCEPTED
0
$0
0
$0
2
$177,275
0
$0
0
$0
1
$71,140
APPLICATIONS DENIED
1
$103,310
4
$76,780
17
$110,618
2
$11,505
0
$0
3
$48,683
APPLICATIONS WITHDRAWN
1
$82,180
2
$108,945
8
$110,825
0
$0
0
$0
1
$46,730
FILES CLOSED FOR INCOMPLETENESS
0
$0
0
$0
1
$169,060
0
$0
0
$0
0
$0
Aggregated Statistics For Year 2008 (Based on 2 partial tracts)
A) FHA, FSA/RHS & VA Home Purchase Loans
B) Conventional Home Purchase Loans
C) Refinancings
D) Home Improvement Loans
F) Non-occupant Loans on < 5 Family Dwellings (A B C & D)
G) Loans On Manufactured Home Dwelling (A B C & D)
Number
Average Value
Number
Average Value
Number
Average Value
Number
Average Value
Number
Average Value
Number
Average Value
LOANS ORIGINATED
5
$93,122
11
$133,004
21
$111,754
4
$41,442
4
$74,198
4
$79,772
APPLICATIONS APPROVED, NOT ACCEPTED
0
$0
1
$111,760
2
$136,065
0
$0
0
$0
1
$42,500
APPLICATIONS DENIED
3
$75,057
4
$45,550
14
$123,756
4
$50,540
1
$34,990
5
$73,822
APPLICATIONS WITHDRAWN
0
$0
2
$74,080
9
$105,008
1
$24,650
1
$46,490
1
$84,290
FILES CLOSED FOR INCOMPLETENESS
0
$0
1
$34,050
4
$162,365
1
$19,960
0
$0
0
$0
Aggregated Statistics For Year 2007 (Based on 2 partial tracts)
A) FHA, FSA/RHS & VA Home Purchase Loans
B) Conventional Home Purchase Loans
C) Refinancings
D) Home Improvement Loans
F) Non-occupant Loans on < 5 Family Dwellings (A B C & D)
G) Loans On Manufactured Home Dwelling (A B C & D)
Number
Average Value
Number
Average Value
Number
Average Value
Number
Average Value
Number
Average Value
Number
Average Value
LOANS ORIGINATED
2
$85,465
16
$111,031
27
$89,041
4
$31,932
4
$66,390
7
$54,306
APPLICATIONS APPROVED, NOT ACCEPTED
0
$0
1
$151,920
3
$144,950
0
$0
0
$0
0
$0
APPLICATIONS DENIED
0
$0
7
$86,741
16
$103,268
6
$31,815
1
$61,520
6
$59,092
APPLICATIONS WITHDRAWN
1
$97,440
4
$68,445
7
$98,247
2
$25,710
1
$80,070
1
$43,440
FILES CLOSED FOR INCOMPLETENESS
0
$0
0
$0
2
$94,155
0
$0
0
$0
0
$0
Aggregated Statistics For Year 2006 (Based on 2 partial tracts)
A) FHA, FSA/RHS & VA Home Purchase Loans
B) Conventional Home Purchase Loans
C) Refinancings
D) Home Improvement Loans
F) Non-occupant Loans on < 5 Family Dwellings (A B C & D)
G) Loans On Manufactured Home Dwelling (A B C & D)
Number
Average Value
Number
Average Value
Number
Average Value
Number
Average Value
Number
Average Value
Number
Average Value
LOANS ORIGINATED
2
$121,040
25
$104,909
32
$100,480
8
$40,885
6
$112,938
7
$60,813
APPLICATIONS APPROVED, NOT ACCEPTED
0
$0
2
$57,410
5
$114,442
0
$0
0
$0
2
$57,995
APPLICATIONS DENIED
1
$87,110
12
$72,358
25
$101,546
7
$39,513
2
$94,035
7
$57,090
APPLICATIONS WITHDRAWN
0
$0
5
$77,766
15
$115,521
3
$51,107
1
$34,990
2
$42,030
FILES CLOSED FOR INCOMPLETENESS
0
$0
1
$32,870
3
$93,060
0
$0
0
$0
0
$0
Aggregated Statistics For Year 2005 (Based on 2 partial tracts)
A) FHA, FSA/RHS & VA Home Purchase Loans
B) Conventional Home Purchase Loans
C) Refinancings
D) Home Improvement Loans
F) Non-occupant Loans on < 5 Family Dwellings (A B C & D)
G) Loans On Manufactured Home Dwelling (A B C & D)
Number
Average Value
Number
Average Value
Number
Average Value
Number
Average Value
Number
Average Value
Number
Average Value
LOANS ORIGINATED
3
$88,363
19
$87,926
33
$94,155
5
$31,558
4
$50,892
7
$61,350
APPLICATIONS APPROVED, NOT ACCEPTED
0
$0
3
$55,333
5
$102,608
0
$0
0
$0
3
$37,253
APPLICATIONS DENIED
0
$0
10
$69,477
23
$86,325
5
$44,940
0
$0
7
$47,497
APPLICATIONS WITHDRAWN
1
$59,170
3
$76,387
16
$102,549
2
$61,400
0
$0
1
$41,790
FILES CLOSED FOR INCOMPLETENESS
0
$0
0
$0
3
$81,083
0
$0
0
$0
0
$0
Aggregated Statistics For Year 2004 (Based on 2 partial tracts)
A) FHA, FSA/RHS & VA Home Purchase Loans
B) Conventional Home Purchase Loans
C) Refinancings
D) Home Improvement Loans
F) Non-occupant Loans on < 5 Family Dwellings (A B C & D)
G) Loans On Manufactured Home Dwelling (A B C & D)
Number
Average Value
Number
Average Value
Number
Average Value
Number
Average Value
Number
Average Value
Number
Average Value
LOANS ORIGINATED
2
$71,495
21
$82,292
35
$92,337
5
$35,126
3
$69,970
8
$56,645
APPLICATIONS APPROVED, NOT ACCEPTED
0
$0
1
$101,200
7
$122,767
1
$11,740
0
$0
1
$41,090
APPLICATIONS DENIED
1
$114,820
8
$70,352
22
$105,681
4
$39,330
1
$31,930
8
$54,679
APPLICATIONS WITHDRAWN
1
$148,160
2
$67,505
18
$93,268
2
$49,545
0
$0
1
$113,880
FILES CLOSED FOR INCOMPLETENESS
0
$0
0
$0
3
$114,190
0
$0
0
$0
0
$0
Aggregated Statistics For Year 2003 (Based on 2 partial tracts)
A) FHA, FSA/RHS & VA Home Purchase Loans
B) Conventional Home Purchase Loans
C) Refinancings
D) Home Improvement Loans
F) Non-occupant Loans on < 5 Family Dwellings (A B C & D)
Number
Average Value
Number
Average Value
Number
Average Value
Number
Average Value
Number
Average Value
LOANS ORIGINATED
1
$104,960
16
$83,119
49
$87,571
4
$25,710
2
$53,770
APPLICATIONS APPROVED, NOT ACCEPTED
0
$0
2
$68,445
9
$94,572
0
$0
1
$37,330
APPLICATIONS DENIED
0
$0
7
$57,123
24
$104,026
4
$18,315
1
$27,710
APPLICATIONS WITHDRAWN
0
$0
2
$119,750
19
$104,226
0
$0
0
$0
FILES CLOSED FOR INCOMPLETENESS
0
$0
0
$0
3
$135,793
0
$0
0
$0
Aggregated Statistics For Year 2002 (Based on 2 partial tracts)
A) FHA, FSA/RHS & VA Home Purchase Loans
B) Conventional Home Purchase Loans
C) Refinancings
D) Home Improvement Loans
F) Non-occupant Loans on < 5 Family Dwellings (A B C & D)
Number
Average Value
Number
Average Value
Number
Average Value
Number
Average Value
Number
Average Value
LOANS ORIGINATED
3
$63,397
18
$72,527
41
$81,716
4
$22,658
4
$56,998
APPLICATIONS APPROVED, NOT ACCEPTED
0
$0
4
$73,318
5
$70,816
0
$0
0
$0
APPLICATIONS DENIED
0
$0
12
$56,685
20
$94,496
2
$10,920
1
$71,140
APPLICATIONS WITHDRAWN
0
$0
2
$71,495
10
$93,850
0
$0
0
$0
FILES CLOSED FOR INCOMPLETENESS
0
$0
1
$44,850
4
$76,192
0
$0
0
$0
Aggregated Statistics For Year 2001 (Based on 2 partial tracts)
A) FHA, FSA/RHS & VA Home Purchase Loans
B) Conventional Home Purchase Loans
C) Refinancings
D) Home Improvement Loans
F) Non-occupant Loans on < 5 Family Dwellings (A B C & D)
Number
Average Value
Number
Average Value
Number
Average Value
Number
Average Value
Number
Average Value
LOANS ORIGINATED
2
$54,120
15
$77,281
32
$78,445
4
$28,175
4
$79,245
APPLICATIONS APPROVED, NOT ACCEPTED
0
$0
3
$33,497
5
$56,728
0
$0
0
$0
APPLICATIONS DENIED
0
$0
16
$43,189
16
$70,381
3
$11,037
0
$0
APPLICATIONS WITHDRAWN
0
$0
1
$99,790
11
$78,210
1
$12,910
0
$0
FILES CLOSED FOR INCOMPLETENESS
0
$0
0
$0
1
$98,150
0
$0
0
$0
Aggregated Statistics For Year 2000 (Based on 2 partial tracts)
A) FHA, FSA/RHS & VA Home Purchase Loans
B) Conventional Home Purchase Loans
C) Refinancings
D) Home Improvement Loans
F) Non-occupant Loans on < 5 Family Dwellings (A B C & D)
Number
Average Value
Number
Average Value
Number
Average Value
Number
Average Value
Number
Average Value
LOANS ORIGINATED
3
$87,973
17
$61,642
14
$61,669
5
$16,154
2
$44,495
APPLICATIONS APPROVED, NOT ACCEPTED
0
$0
2
$51,655
6
$62,652
1
$7,980
0
$0
APPLICATIONS DENIED
0
$0
18
$45,225
12
$57,448
2
$58,465
0
$0
APPLICATIONS WITHDRAWN
0
$0
1
$99,320
8
$50,159
0
$0
0
$0
FILES CLOSED FOR INCOMPLETENESS
0
$0
0
$0
2
$60,695
0
$0
0
$0
Aggregated Statistics For Year 1999 (Based on 1 partial tract)
A) FHA, FSA/RHS & VA Home Purchase Loans
B) Conventional Home Purchase Loans
C) Refinancings
D) Home Improvement Loans
F) Non-occupant Loans on < 5 Family Dwellings (A B C & D)

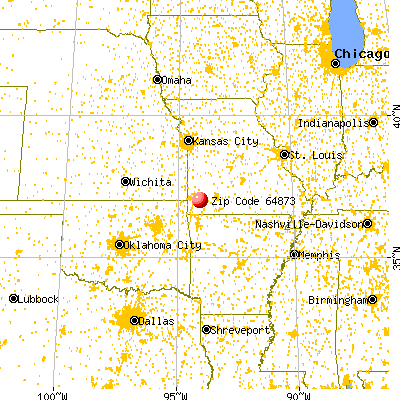


 Nearest zip codes: 65723, 65756, 64862, 65654, 64848, 65708.


