Estimated zip code population in 2022: 550 Zip code population in 2010: 829 Zip code population in 2000: 891
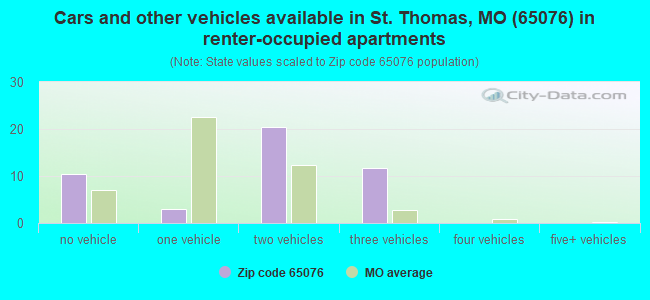
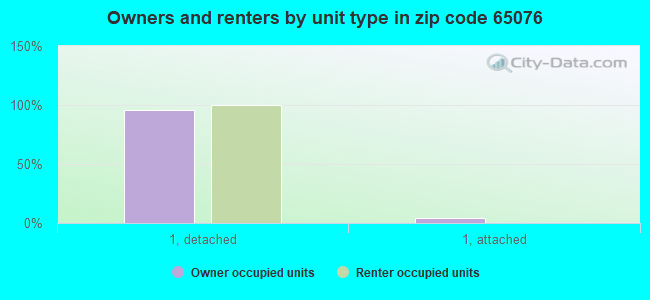
Houses and condos: 255 Renter-occupied apartments: 46
% of renters here:
18%
State:
32%
March 2022 cost of living index in zip code 65076: 74.6 (low, U.S. average is 100)
Land area: 25.9 sq. mi. Water area: 0.6 sq. mi.
Population density: 21 people per square mile
(very low).
OSM Map
General Map
Google Map
MSN Map
OSM Map
General Map
Google Map
MSN Map
OSM Map
General Map
Google Map
MSN Map
OSM Map
General Map
Google Map
MSN Map
Please wait while loading the map...
Real estate property taxes paid for housing units in 2022:
This zip code:
0.7% ($1,369)
Missouri:
0.8% ($1,810)
Median real estate property taxes paid for housing units with mortgages in 2022: $977 (0.6%) Median real estate property taxes paid for housing units with no mortgage in 2022: $1,794 (0.6%)
Business Search- 14 Million verified businesses
Males: 269
(49.0%)
Females: 280
(51.0%)
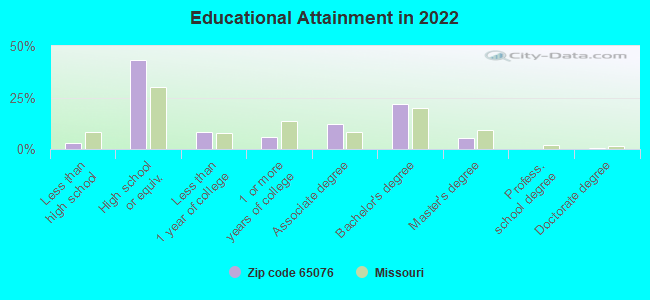
For population 25 years and over in 65076:
High school or higher: 97.4%
Bachelor's degree or higher: 27.5%
Graduate or professional degree: 5.6%
Mean travel time to work (commute): 25.8 minutes
For population 15 years and over in 65076:
Never married: 22.0%
Now married: 59.8%
Separated: 3.4%
Widowed: 11.0%
Divorced: 3.7%
Zip code 65076 compared to state average:
Unemployed percentage significantly below state average.
Black race population percentage significantly below state average.
Foreign-born population percentage below state average.
Renting percentage below state average.
Length of stay since moving in significantly above state average.
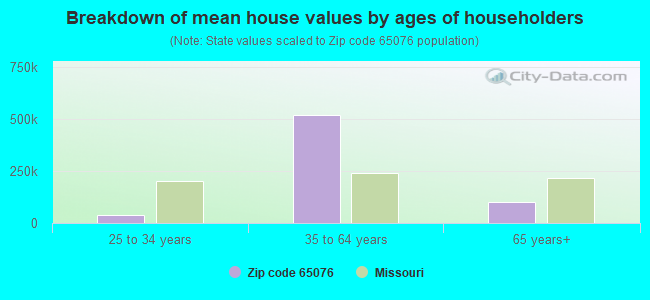
Estimated median house/condo value in 2022: $190,250
65076:
$190,250
Missouri:
$221,200
According to our research of Missouri and other state lists, there was 1 registered sex offender living in 65076 zip code as of June 16, 2024. The ratio of all residents to sex offenders in zip code 65076 is 803 to 1. The ratio of registered sex offenders to all residents in this zip code is lower than the state average.
Median resident age:
This zip code:
41.3 years
Missouri median age:
39.1 years
Average household size:
This zip code:
2.1 people
Missouri:
2.4 people
Averages for the 2020 tax year for zip code 65076, filed in 2021:
Average Adjusted Gross Income (AGI) in 2020: $57,992 (Individual Income Tax Returns)
Here:
$57,992
State:
$68,151
Salary/wage: $54,750 (reported on 83.3% of returns)
Here:
$54,750
State:
$56,131
(% of AGI for various income ranges: 1595.0% for AGIs below $25k, 3820.0% for AGIs $25k-50k, 6097.5% for AGIs $50k-75k, 10296.7% for AGIs $75k-100k, 20075.0% for AGIs $100k-200k)
Taxable interest for individuals: $546 (reported on 66.7% of returns)
This zip code:
$546
Missouri:
$1,586
(% of AGI for various income ranges: 45.0% for AGIs below $25k, 30.0% for AGIs $25k-50k, 95.0% for AGIs $50k-75k, 33.3% for AGIs $75k-100k, 102.5% for AGIs $100k-200k)
Ordinary dividends: $1,238 (reported on 22.2% of returns)
Here:
$1,238
State:
$10,947
(% of AGI for various income ranges: 53.3% for AGIs below $25k, 57.5% for AGIs $50k-75k, 110.0% for AGIs $100k-200k)
Net capital gain/loss in AGI: +$4,670 (reported on 27.8% of returns)
Here:
+$4,670
State:
+$18,453
(% of AGI for various income ranges: 240.0% for AGIs below $25k, 432.5% for AGIs $50k-75k, 375.0% for AGIs $100k-200k)
Profit/loss from business: +$8,050 (reported on 11.1% of returns)
Here:
+$8,050
State:
+$12,260
(% of AGI for various income ranges: 805.0% for AGIs $50k-75k)
Taxable individual retirement arrangement distribution: $9,275 (reported on 11.1% of returns)
65076:
$9,275
Missouri:
$19,719
(% of AGI for various income ranges: 742.0% for AGIs $25k-50k)
Earned income credit: $2,400 (reported on 5.6% of returns)
Here:
$2,400
State:
$2,315
(% of AGI for various income ranges: 80.0% for AGIs below $25k)
Percentage of individuals using paid preparers for their 2020 taxes: 88.9%
Here:
89%
State:
93%
(% for various income ranges: 90.9% for AGIs below $25k, 85.7% for AGIs $25k-50k, 83.3% for AGIs $50k-75k, 80.0% for AGIs $75k-100k, 100.0% for AGIs $100k-200k)
Averages for the 2012 tax year for zip code 65076, filed in 2013:
Average Adjusted Gross Income (AGI) in 2012: $46,055 (Individual Income Tax Returns)
Here:
$46,055
State:
$55,896
Salary/wage: $42,067 (reported on 87.1% of returns)
Here:
$42,067
State:
$46,205
(% of AGI for various income ranges: 80.1% for AGIs below $25k, 74.0% for AGIs $25k-50k, 83.1% for AGIs $50k-75k, 78.6% for AGIs $75k-100k, 80.8% for AGIs $100k-200k)
Taxable interest for individuals: $789 (reported on 61.3% of returns)
This zip code:
$789
Missouri:
$1,559
(% of AGI for various income ranges: 1.3% for AGIs below $25k, 2.4% for AGIs $25k-50k, 0.7% for AGIs $50k-75k, 0.9% for AGIs $75k-100k, 0.3% for AGIs $100k-200k)
Ordinary dividends: $1,020 (reported on 16.1% of returns)
Here:
$1,020
State:
$7,410
Net capital gain/loss in AGI: +$4,838 (reported on 25.8% of returns)
Here:
+$4,838
State:
+$11,579
(% of AGI for various income ranges: 3.8% for AGIs below $25k, 4.8% for AGIs $25k-50k, 5.2% for AGIs $50k-75k)
Profit/loss from business: +$3,150 (reported on 12.9% of returns)
Here:
+$3,150
State:
+$11,688
Taxable individual retirement arrangement distribution: $5,333 (reported on 9.7% of returns)
65076:
$5,333
Missouri:
$14,773
Total itemized deductions: $15,720 (19% of AGI, reported on 16.1% of returns)
Here:
$15,720
State:
$22,730
Here:
18.6% of AGI
State:
19.2% of AGI
Charity contributions: $2,860 (reported on 16.1% of returns)
Here:
$2,860
State:
$4,745
Taxes paid: $5,080 (reported on 16.1% of returns)
65076:
$5,080
State:
$8,399
Earned income credit: $1,850 (reported on 12.9% of returns)
Here:
$1,850
State:
$2,288
(% of AGI for various income ranges: 6.2% for AGIs below $25k)
Percentage of individuals using paid preparers for their 2012 taxes: 61.3%
Here:
61%
State:
55%
(% for various income ranges: 50.0% for AGIs below $25k, 62.5% for AGIs $25k-50k, 71.4% for AGIs $50k-75k, 100.0% for AGIs $75k-100k)
Averages for the 2004 tax year for zip code 65076, filed in 2005:
Average Adjusted Gross Income (AGI) in 2004: $38,145 (Individual Income Tax Returns)
Here:
$38,145
State:
$44,591
Salary/wage: $35,927 (reported on 88.3% of returns)
Here:
$35,927
State:
$38,941
(% of AGI for various income ranges: 80.7% for AGIs below $10k, 80.9% for AGIs $10k-25k, 85.8% for AGIs $25k-50k, 85.3% for AGIs $50k-75k, 87.0% for AGIs $75k-100k, 67.4% for AGIs over 100k)
Taxable interest for individuals: $897 (reported on 66.0% of returns)
This zip code:
$897
Missouri:
$1,801
(% of AGI for various income ranges: 5.5% for AGIs below $10k, 4.1% for AGIs $10k-25k, 1.6% for AGIs $25k-50k, 1.3% for AGIs $50k-75k, 0.9% for AGIs $75k-100k)
Taxable dividends: $469 (reported on 19.8% of returns)
Here:
$469
State:
$3,677
(% of AGI for various income ranges: 0.2% for AGIs $10k-25k, 0.2% for AGIs $25k-50k, 0.2% for AGIs $50k-75k, 0.7% for AGIs $75k-100k)
Net capital gain/loss: +$3,224 (reported on 23.5% of returns)
Here:
+$3,224
State:
+$8,915
(% of AGI for various income ranges: 5.0% for AGIs $10k-25k, 1.5% for AGIs $25k-50k, 2.2% for AGIs $50k-75k, 2.0% for AGIs $75k-100k)
Profit/loss from business: +$3,795 (reported on 12.0% of returns)
Here:
+$3,795
State:
+$9,793
IRA payment deduction: $3,053 (reported on 5.9% of returns)
65076:
$3,053
Missouri:
$2,972
Total itemized deductions: $13,250 (20% of AGI, reported on 19.8% of returns)
Here:
$13,250
State:
$18,261
Here:
20.1% of AGI
State:
20.5% of AGI
Charity contributions deductions: $2,500 (4% of AGI, reported on 17.9% of returns)
Here:
$2,500
State:
$3,665
Here:
3.7% of AGI
State:
3.9% of AGI
Total tax: $3,405 (reported on 84.6% of returns)
65076:
$3,405
State:
$6,999
(% of AGI for various income ranges: 4.4% for AGIs below $10k, 5.3% for AGIs $10k-25k, 6.7% for AGIs $25k-50k, 7.9% for AGIs $50k-75k, 17.5% for AGIs $75k-100k)
Earned income credit: $1,265 (reported on 10.5% of returns)
Here:
$1,265
State:
$1,728
Percentage of individuals using paid preparers for their 2004 taxes: 65.4%
Here:
65%
State:
62%
(% for various income ranges: 48.2% for AGIs below $10k, 61.1% for AGIs $10k-25k, 70.0% for AGIs $25k-50k, 73.1% for AGIs $50k-75k, 116.7% for AGIs $75k-100k)
Household received Food Stamps/SNAP in the past 12 months: 0 Household did not receive Food Stamps/SNAP in the past 12 months: 258
Women who had a birth in the past 12 months: 5 (5 now married, 0 unmarried) Women who did not have a birth in the past 12 months: 118 (55 now married, 63 unmarried)
Housing units in zip code 65076 with a mortgage: 120 (5 second mortgage, 5 both second mortgage and home equity loan) Houses without a mortgage: 20
Median monthly owner costs for units with a mortgage: $973 Median monthly owner costs for units without a mortgage: $466
Residents with income below the poverty level in 2022:
This zip code:
9.1%
Whole state:
13.2%
Residents with income below 50% of the poverty level in 2022:
This zip code:
9.1%
Whole state:
6.8%
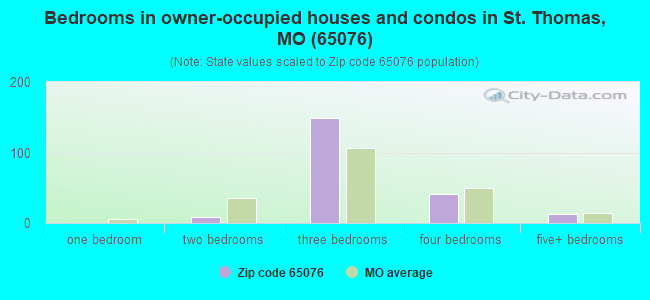
Median number of rooms in houses and condos:
Here:
6.5
State:
6.4
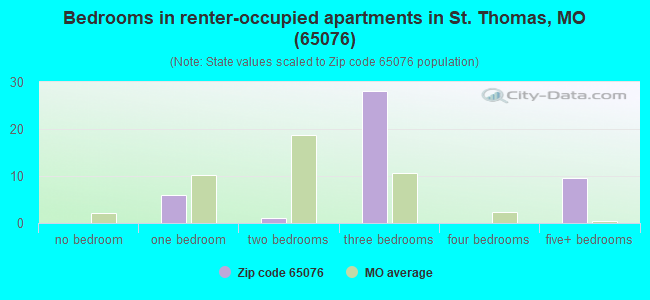
Median number of rooms in apartments:
Here:
5.5
State:
4.4
Notable locations in this zip code not listed on our city pages
Size of family households: 92 2-persons, 35 3-persons, 27 4-persons, 2 5-persons, 1 7-or-more-persons
Size of nonfamily households: 94 1-person, 5 2-persons
58 married couples with children.
39 single-parent households (35 men, 4 women).
95.6% of residents of 65076 zip code speak English at home.
1.5% of residents speak Spanish at home (100% very well).
2.9% of residents speak other Indo-European language at home (87% very well, 13% not well).
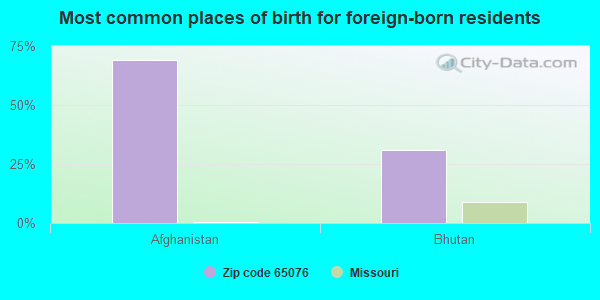
Foreign born population: 13 (2.5%) (85.8% of them are naturalized citizens)
This zip code:
2.5%
Whole state:
4.1%
69%Afghanistan
31%Bhutan
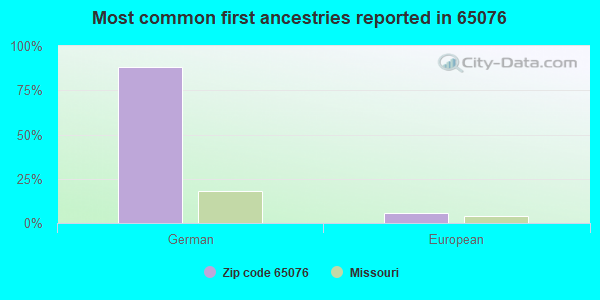
88%German
6%European
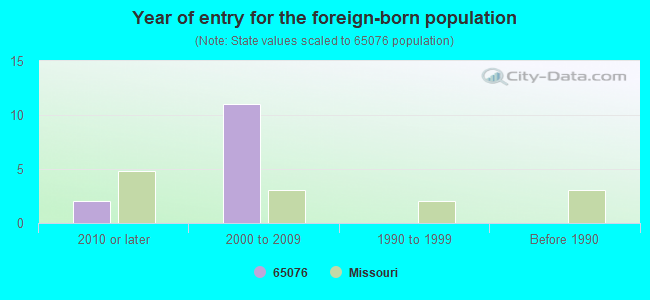
Year of entry for the foreign-born population
22010 or later
112000 to 2009
01990 to 1999
0Before 1990
Housing units lacking complete plumbing facilities: 3.5% Housing units lacking complete kitchen facilities: 3.4%
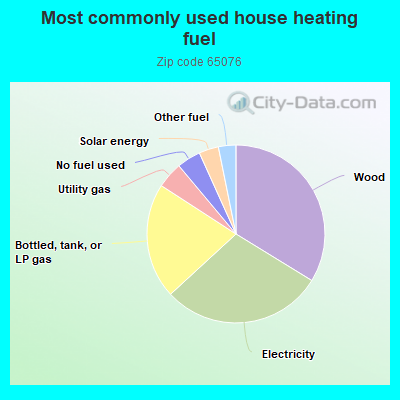
34.1%Wood
29.7%Electricity
21.2%Bottled, tank, or LP gas
4.8%Utility gas
4.4%No fuel used
3.6%Solar energy
3.2%Other fuel
Population in 1990: 1,232.
Place of birth for U.S.-born residents:
This state: 489
Northeast: 2
Midwest: 14
South: 3
West: 26
73% of the 65076 zip code residents lived in the same house 5 years ago. Out of people who lived in different houses, 77% lived in this county. Out of people who lived in different counties, 50% lived in Missouri.
99% of the 65076 zip code residents lived in the same house 1 year ago. Out of people who lived in different houses, 120% moved from this county.
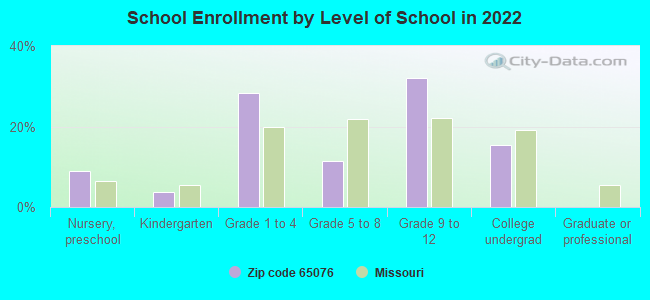
Private vs. public school enrollment:
Students in private schools in grades 1 to 8 (elementary and middle school): 8
Here:
28.0%
Missouri:
15.4%
Students in private schools in grades 9 to 12 (high school):
Here:
0.0%
Missouri:
13.9%
Students in private undergraduate colleges: 7
Here:
59.3%
Missouri:
22.6%
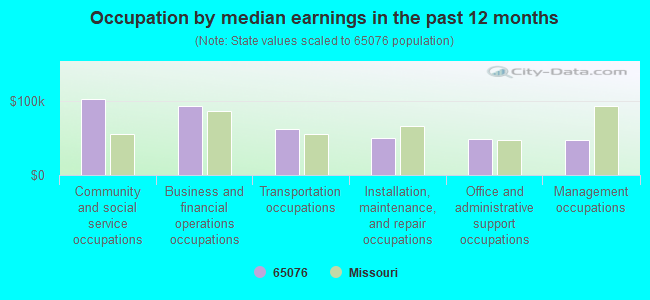
Occupation by median earnings in the past 12 months ($)
102,140Community and social service occupations
92,087Business and financial operations occupations
62,384Transportation occupations
50,204Installation, maintenance, and repair occupations
48,441Office and administrative support occupations
46,919Management occupations
Top industries in this zip code by the number of employees in 2005:
Other Services (except Public Administration): Religious Organizations (10-19 employees: 1 establishment)
Construction: Residential Remodelers (5-9: 1)
Construction: New Single-Family Housing Construction (except Operative Builders) (1-4: 1)
Administrative and Support and Waste Management and Remediation Services: Exterminating and Pest Control Services (1-4: 1)
Construction: Other Heavy and Civil Engineering Construction (1-4: 1)
Finance and Insurance: Direct Property and Casualty Insurance Carriers (1-4: 1)
Fatal accident statistics in 2013:
Fatal accident count: 1
Vehicles involved in fatal accidents: 2
Fatal accidents caused by drunken drivers: 0
Fatalities: 3
Persons involved in fatal accidents: 4
Pedestrians involved in fatal accidents: 0
Fatal accident statistics in 2011:
Fatal accident count: 1
Vehicles involved in fatal accidents: 1
Fatal accidents caused by drunken drivers: 0
Fatalities: 1
Persons involved in fatal accidents: 1
Pedestrians involved in fatal accidents: 0
Home Mortgage Disclosure Act Aggregated Statistics For Year 2009 (Based on 2 partial tracts)
A) FHA, FSA/RHS & VA Home Purchase Loans
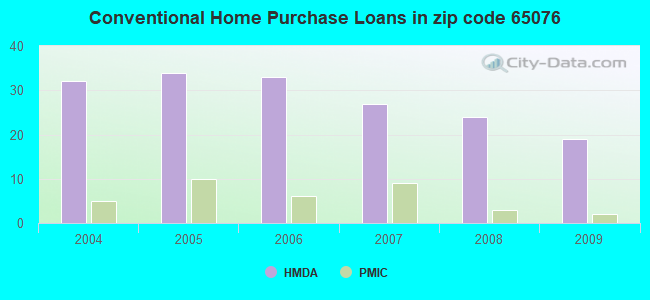
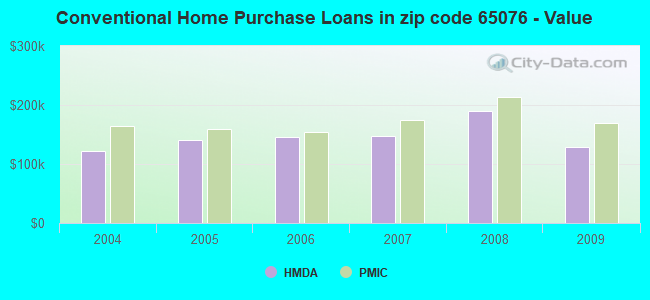
B) Conventional Home Purchase Loans
C) Refinancings
D) Home Improvement Loans
F) Non-occupant Loans on < 5 Family Dwellings (A B C & D)
G) Loans On Manufactured Home Dwelling (A B C & D)
Number
Average Value
Number
Average Value
Number
Average Value
Number
Average Value
Number
Average Value
Number
Average Value
LOANS ORIGINATED
4
$174,010
19
$128,957
110
$155,178
7
$80,646
3
$107,880
1
$61,080
APPLICATIONS APPROVED, NOT ACCEPTED
0
$0
2
$197,535
14
$160,376
1
$72,900
0
$0
0
$0
APPLICATIONS DENIED
1
$84,230
0
$0
10
$156,006
1
$115,270
0
$0
0
$0
APPLICATIONS WITHDRAWN
1
$110,340
2
$177,580
9
$153,199
0
$0
0
$0
0
$0
FILES CLOSED FOR INCOMPLETENESS
0
$0
0
$0
1
$244,330
0
$0
0
$0
0
$0
Aggregated Statistics For Year 2008 (Based on 2 partial tracts)
A) FHA, FSA/RHS & VA Home Purchase Loans
B) Conventional Home Purchase Loans
C) Refinancings
D) Home Improvement Loans
F) Non-occupant Loans on < 5 Family Dwellings (A B C & D)
Number
Average Value
Number
Average Value
Number
Average Value
Number
Average Value
Number
Average Value
LOANS ORIGINATED
1
$266,990
24
$189,548
48
$140,196
8
$71,181
5
$110,244
APPLICATIONS APPROVED, NOT ACCEPTED
0
$0
0
$0
9
$163,598
0
$0
0
$0
APPLICATIONS DENIED
1
$121,180
1
$138,910
6
$131,032
0
$0
0
$0
APPLICATIONS WITHDRAWN
0
$0
1
$345,310
6
$156,237
0
$0
0
$0
FILES CLOSED FOR INCOMPLETENESS
0
$0
0
$0
1
$279,800
0
$0
0
$0
Aggregated Statistics For Year 2007 (Based on 2 partial tracts)
A) FHA, FSA/RHS & VA Home Purchase Loans
B) Conventional Home Purchase Loans
C) Refinancings
D) Home Improvement Loans
F) Non-occupant Loans on < 5 Family Dwellings (A B C & D)
Number
Average Value
Number
Average Value
Number
Average Value
Number
Average Value
Number
Average Value
LOANS ORIGINATED
0
$0
27
$147,579
27
$132,327
6
$38,505
6
$113,708
APPLICATIONS APPROVED, NOT ACCEPTED
0
$0
3
$188,173
5
$197,434
1
$35,470
0
$0
APPLICATIONS DENIED
1
$127,090
1
$284,230
19
$128,828
2
$88,915
0
$0
APPLICATIONS WITHDRAWN
0
$0
1
$147,780
6
$123,725
0
$0
0
$0
FILES CLOSED FOR INCOMPLETENESS
0
$0
0
$0
1
$139,410
0
$0
0
$0
Aggregated Statistics For Year 2006 (Based on 2 partial tracts)
A) FHA, FSA/RHS & VA Home Purchase Loans
B) Conventional Home Purchase Loans
C) Refinancings
D) Home Improvement Loans
F) Non-occupant Loans on < 5 Family Dwellings (A B C & D)
G) Loans On Manufactured Home Dwelling (A B C & D)
Number
Average Value
Number
Average Value
Number
Average Value
Number
Average Value
Number
Average Value
Number
Average Value
LOANS ORIGINATED
1
$199,010
33
$145,198
23
$132,124
6
$42,857
3
$99,670
1
$20,690
APPLICATIONS APPROVED, NOT ACCEPTED
0
$0
5
$91,328
3
$159,767
0
$0
0
$0
0
$0
APPLICATIONS DENIED
0
$0
2
$154,430
9
$102,626
2
$87,435
0
$0
1
$49,750
APPLICATIONS WITHDRAWN
0
$0
4
$103,692
13
$118,906
1
$56,650
0
$0
0
$0
FILES CLOSED FOR INCOMPLETENESS
0
$0
0
$0
0
$0
0
$0
0
$0
0
$0
Aggregated Statistics For Year 2005 (Based on 2 partial tracts)
A) FHA, FSA/RHS & VA Home Purchase Loans
B) Conventional Home Purchase Loans
C) Refinancings
D) Home Improvement Loans
F) Non-occupant Loans on < 5 Family Dwellings (A B C & D)
G) Loans On Manufactured Home Dwelling (A B C & D)
Number
Average Value
Number
Average Value
Number
Average Value
Number
Average Value
Number
Average Value
Number
Average Value
LOANS ORIGINATED
1
$209,350
34
$141,072
32
$137,666
12
$38,382
4
$79,800
2
$24,135
APPLICATIONS APPROVED, NOT ACCEPTED
0
$0
1
$73,890
6
$112,313
0
$0
0
$0
0
$0
APPLICATIONS DENIED
1
$116,750
1
$100,490
12
$98,479
0
$0
0
$0
1
$60,590
APPLICATIONS WITHDRAWN
0
$0
4
$117,978
10
$105,663
0
$0
0
$0
0
$0
FILES CLOSED FOR INCOMPLETENESS
0
$0
0
$0
0
$0
0
$0
0
$0
0
$0
Aggregated Statistics For Year 2004 (Based on 2 partial tracts)
A) FHA, FSA/RHS & VA Home Purchase Loans
B) Conventional Home Purchase Loans
C) Refinancings
D) Home Improvement Loans
F) Non-occupant Loans on < 5 Family Dwellings (A B C & D)
G) Loans On Manufactured Home Dwelling (A B C & D)

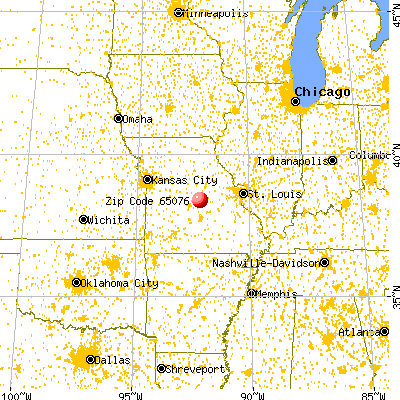


 Nearest zip codes: 65040, 65085, 65101, 65075, 65058, 65048.