Estimated zip code population in 2022: 1,537 Zip code population in 2010: 1,015 Zip code population in 2000: 762
Houses and condos: 502 Renter-occupied apartments: 92
% of renters here:
18%
State:
32%
March 2022 cost of living index in zip code 65080: 79.4 (low, U.S. average is 100)
Land area: 42.1 sq. mi. Water area: 1.7 sq. mi.
Population density: 37 people per square mile
(very low).
OSM Map
General Map
Google Map
MSN Map
OSM Map
General Map
Google Map
MSN Map
OSM Map
General Map
Google Map
MSN Map
OSM Map
General Map
Google Map
MSN Map
Please wait while loading the map...
Real estate property taxes paid for housing units in 2022:
This zip code:
0.5% ($1,606)
Missouri:
0.8% ($1,810)
Median real estate property taxes paid for housing units with mortgages in 2022: $1,658 (0.4%) Median real estate property taxes paid for housing units with no mortgage in 2022: $668 (1.0%)
Business Search- 14 Million verified businesses
Males: 867
(56.4%)
Females: 670
(43.6%)
For population 25 years and over in 65080:
High school or higher: 84.4%
Bachelor's degree or higher: 11.4%
Graduate or professional degree: 3.4%
Unemployed: 8.8%
Mean travel time to work (commute): 29.7 minutes
For population 15 years and over in 65080:
Never married: 42.2%
Now married: 39.2%
Separated: 0.0%
Widowed: 0.0%
Divorced: 18.6%
Zip code 65080 compared to state average:
Unemployed percentage above state average.
Black race population percentage significantly below state average.
Hispanic race population percentage significantly below state average.
Foreign-born population percentage significantly below state average.
Renting percentage below state average.
Length of stay since moving in significantly above state average.
Number of rooms per house above state average.
Number of college students below state average.
Percentage of population with a bachelor's degree or higher significantly below state average.
Averages for the 2020 tax year for zip code 65080, filed in 2021:
Average Adjusted Gross Income (AGI) in 2020: $69,139 (Individual Income Tax Returns)
Here:
$69,139
State:
$68,151
Salary/wage: $63,870 (reported on 80.4% of returns)
Here:
$63,870
State:
$56,131
(% of AGI for various income ranges: 1278.6% for AGIs below $25k, 3538.9% for AGIs $25k-50k, 6868.0% for AGIs $50k-75k, 10030.0% for AGIs $75k-100k, 17294.3% for AGIs $100k-200k)
Taxable interest for individuals: $530 (reported on 43.5% of returns)
This zip code:
$530
Missouri:
$1,586
(% of AGI for various income ranges: 11.4% for AGIs below $25k, 10.0% for AGIs $25k-50k, 28.0% for AGIs $50k-75k, 67.5% for AGIs $75k-100k, 68.6% for AGIs $100k-200k)
Ordinary dividends: $1,610 (reported on 21.7% of returns)
Here:
$1,610
State:
$10,947
(% of AGI for various income ranges: 47.8% for AGIs $25k-50k, 60.0% for AGIs $50k-75k, 125.7% for AGIs $100k-200k)
Net capital gain/loss in AGI: +$3,662 (reported on 17.4% of returns)
Here:
+$3,662
State:
+$18,453
(% of AGI for various income ranges: 22.9% for AGIs below $25k, 104.0% for AGIs $50k-75k, 321.4% for AGIs $100k-200k)
Profit/loss from business: +$8,667 (reported on 13.0% of returns)
Here:
+$8,667
State:
+$12,260
(% of AGI for various income ranges: 136.7% for AGIs $25k-50k, 992.5% for AGIs $75k-100k)
Taxable individual retirement arrangement distribution: $12,200 (reported on 8.7% of returns)
65080:
$12,200
Missouri:
$19,719
(% of AGI for various income ranges: 976.0% for AGIs $50k-75k)
Total itemized deductions: $24,933 (reported on 6.5% of returns)
Here:
$24,933
State:
$36,651
(% of AGI for various income ranges: 1496.0% for AGIs $50k-75k)
Taxes paid: $7,300 (reported on 4.3% of returns)
65080:
$7,300
State:
$7,608
(% of AGI for various income ranges: 292.0% for AGIs $50k-75k)
Earned income credit: $1,983 (reported on 13.0% of returns)
Here:
$1,983
State:
$2,315
(% of AGI for various income ranges: 77.1% for AGIs below $25k, 72.2% for AGIs $25k-50k)
Percentage of individuals using paid preparers for their 2020 taxes: 95.7%
Here:
96%
State:
93%
(% for various income ranges: 90.9% for AGIs below $25k, 100.0% for AGIs $25k-50k, 100.0% for AGIs $50k-75k, 100.0% for AGIs $75k-100k, 90.9% for AGIs $100k-200k)
Averages for the 2012 tax year for zip code 65080, filed in 2013:
Average Adjusted Gross Income (AGI) in 2012: $53,818 (Individual Income Tax Returns)
Here:
$53,818
State:
$55,896
Salary/wage: $50,483 (reported on 80.0% of returns)
Here:
$50,483
State:
$46,205
(% of AGI for various income ranges: 69.3% for AGIs below $25k, 75.3% for AGIs $25k-50k, 73.4% for AGIs $50k-75k, 79.8% for AGIs $75k-100k, 74.8% for AGIs $100k-200k)
Taxable interest for individuals: $305 (reported on 44.4% of returns)
This zip code:
$305
Missouri:
$1,559
(% of AGI for various income ranges: 0.3% for AGIs below $25k, 0.5% for AGIs $25k-50k, 0.4% for AGIs $50k-75k, 0.1% for AGIs $75k-100k)
Ordinary dividends: $1,625 (reported on 17.8% of returns)
Here:
$1,625
State:
$7,410
(% of AGI for various income ranges: 0.8% for AGIs $25k-50k, 0.9% for AGIs $50k-75k, 0.6% for AGIs $100k-200k)
Net capital gain/loss in AGI: +$2,343 (reported on 15.6% of returns)
Here:
+$2,343
State:
+$11,579
(% of AGI for various income ranges: 1.3% for AGIs $25k-50k, 0.8% for AGIs $50k-75k, 0.7% for AGIs $100k-200k)
Profit/loss from business: +$5,725 (reported on 8.9% of returns)
Here:
+$5,725
State:
+$11,688
Taxable individual retirement arrangement distribution: $6,267 (reported on 6.7% of returns)
65080:
$6,267
Missouri:
$14,773
Total itemized deductions: $19,292 (19% of AGI, reported on 26.7% of returns)
Here:
$19,292
State:
$22,730
Here:
19.5% of AGI
State:
19.2% of AGI
(% of AGI for various income ranges: 11.1% for AGIs $25k-50k, 8.7% for AGIs $50k-75k, 8.6% for AGIs $75k-100k, 11.7% for AGIs $100k-200k)
Charity contributions: $3,038 (reported on 17.8% of returns)
Here:
$3,038
State:
$4,745
Taxes paid: $5,933 (reported on 26.7% of returns)
65080:
$5,933
State:
$8,399
(% of AGI for various income ranges: 1.4% for AGIs $25k-50k, 2.6% for AGIs $50k-75k, 2.9% for AGIs $75k-100k, 4.5% for AGIs $100k-200k)
Earned income credit: $1,917 (reported on 13.3% of returns)
Here:
$1,917
State:
$2,288
(% of AGI for various income ranges: 4.6% for AGIs below $25k, 0.8% for AGIs $25k-50k)
Percentage of individuals using paid preparers for their 2012 taxes: 55.6%
Here:
56%
State:
55%
(% for various income ranges: 50.0% for AGIs below $25k, 58.3% for AGIs $25k-50k, 62.5% for AGIs $50k-75k, 60.0% for AGIs $75k-100k, 50.0% for AGIs $100k-200k)
Averages for the 2004 tax year for zip code 65080, filed in 2005:
Average Adjusted Gross Income (AGI) in 2004: $44,153 (Individual Income Tax Returns)
Here:
$44,153
State:
$44,591
Salary/wage: $42,124 (reported on 84.4% of returns)
Here:
$42,124
State:
$38,941
(% of AGI for various income ranges: 117.9% for AGIs below $10k, 68.7% for AGIs $10k-25k, 81.3% for AGIs $25k-50k, 86.3% for AGIs $50k-75k, 83.5% for AGIs $75k-100k, 74.2% for AGIs over 100k)
Taxable interest for individuals: $769 (reported on 49.9% of returns)
This zip code:
$769
Missouri:
$1,801
(% of AGI for various income ranges: 1.7% for AGIs below $10k, 3.1% for AGIs $10k-25k, 1.6% for AGIs $25k-50k, 0.3% for AGIs $50k-75k, 0.4% for AGIs $75k-100k, 0.3% for AGIs over 100k)
Taxable dividends: $472 (reported on 22.8% of returns)
Here:
$472
State:
$3,677
(% of AGI for various income ranges: 1.3% for AGIs below $10k, 0.5% for AGIs $10k-25k, 0.4% for AGIs $25k-50k, 0.1% for AGIs $50k-75k, 0.1% for AGIs $75k-100k, 0.3% for AGIs over 100k)
Net capital gain/loss: +$4,327 (reported on 14.1% of returns)
Here:
+$4,327
State:
+$8,915
Profit/loss from business: +$5,212 (reported on 13.3% of returns)
Here:
+$5,212
State:
+$9,793
(% of AGI for various income ranges: 10.5% for AGIs $10k-25k, 0.9% for AGIs $25k-50k, 1.5% for AGIs $50k-75k, 0.6% for AGIs $75k-100k)
Total itemized deductions: $15,121 (20% of AGI, reported on 25.3% of returns)
Here:
$15,121
State:
$18,261
Here:
20.0% of AGI
State:
20.5% of AGI
(% of AGI for various income ranges: 10.8% for AGIs $10k-25k, 5.1% for AGIs $25k-50k, 5.4% for AGIs $50k-75k, 11.4% for AGIs $75k-100k, 12.5% for AGIs over 100k)
Charity contributions deductions: $2,688 (3% of AGI, reported on 19.7% of returns)
Here:
$2,688
State:
$3,665
Here:
3.2% of AGI
State:
3.9% of AGI
(% of AGI for various income ranges: 0.5% for AGIs $25k-50k, 1.1% for AGIs $50k-75k, 1.0% for AGIs $75k-100k, 2.6% for AGIs over 100k)
Total tax: $5,436 (reported on 80.3% of returns)
65080:
$5,436
State:
$6,999
(% of AGI for various income ranges: 6.0% for AGIs below $10k, 5.0% for AGIs $10k-25k, 6.8% for AGIs $25k-50k, 8.6% for AGIs $50k-75k, 11.3% for AGIs $75k-100k, 14.8% for AGIs over 100k)
Earned income credit: $1,732 (reported on 10.5% of returns)
Here:
$1,732
State:
$1,728
Percentage of individuals using paid preparers for their 2004 taxes: 57.8%
Here:
58%
State:
62%
(% for various income ranges: 49.3% for AGIs below $10k, 62.7% for AGIs $10k-25k, 65.4% for AGIs $25k-50k, 44.3% for AGIs $50k-75k, 61.0% for AGIs $75k-100k, 59.4% for AGIs over 100k)
Household received Food Stamps/SNAP in the past 12 months: 12 Household did not receive Food Stamps/SNAP in the past 12 months: 497
Women who had a birth in the past 12 months: 13 (13 now married, 0 unmarried) Women who did not have a birth in the past 12 months: 248 (82 now married, 166 unmarried)
Housing units in zip code 65080 with a mortgage: 334 (143 second mortgage, 3 both second mortgage and home equity loan) Houses without a mortgage: 10
Median monthly owner costs for units with a mortgage: $1,957 Median monthly owner costs for units without a mortgage: $411
Residents with income below the poverty level in 2022:
This zip code:
19.4%
Whole state:
13.2%
Residents with income below 50% of the poverty level in 2022:
This zip code:
10.7%
Whole state:
6.8%
Median number of rooms in houses and condos:
Here:
7.6
State:
6.4
Median number of rooms in apartments:
Here:
6.5
State:
4.4
Notable locations in this zip code not listed on our city pages
Notable locations in zip code 65080: Musick (A), Prentiss (B), South Callaway Fire Protection District Station 2 (C). Display/hide their locations on the map
Cemeteries: Middle River Cemetery (1), Mount Tabor Cemetery (2), Riverview Cemetery (3), High Hill Cemetery (4), Thorp Cemetery (5). Display/hide their locations on the map
Streams, rivers, and creeks: Hillers Creek (A), Middle River (B), Muddy Creek (C), Sand Springs Branch (D), Gallons Creek (E), Osage River (F). Display/hide their locations on the map
Size of family households: 81 2-persons, 75 3-persons, 83 4-persons, 49 5-persons, 19 7-or-more-persons
Size of nonfamily households: 29 1-person, 170 2-persons
197 married couples with children.
158 single-parent households (79 men, 79 women).
99.9% of residents of 65080 zip code speak English at home.
Foreign born population: 0 (0.0%)
:
0.0%
Whole state:
4.1%
46%German
34%American
11%European
4%Irish
2%English
1%Scotch-Irish
Housing units lacking complete plumbing facilities: 2.3%
62.6%Electricity
28.3%Bottled, tank, or LP gas
5.3%Wood
4.2%Other fuel
Population in 1990: 413. Population change in the 1990s: +349 (+84.5%).
Place of birth for U.S.-born residents:
This state: 1,246
Midwest: 223
South: 16
West: 49
69% of the 65080 zip code residents lived in the same house 5 years ago. Out of people who lived in different houses, 32% lived in this county. Out of people who lived in different counties, 50% lived in Missouri.
97% of the 65080 zip code residents lived in the same house 1 year ago. Out of people who lived in different houses, 106% moved from this county.
Private vs. public school enrollment:
Students in private schools in grades 1 to 8 (elementary and middle school): 35
Here:
14.1%
Missouri:
15.4%
Students in private schools in grades 9 to 12 (high school):
Here:
0.0%
Missouri:
13.9%
Students in private undergraduate colleges: 34
Here:
100.0%
Missouri:
22.6%
Occupation by median earnings in the past 12 months ($)
81,788Life, physical, and social science occupations
77,107Computer and mathematical occupations
68,822Management occupations
59,768Health diagnosing and treating practitioners and other technical occupations
52,675Transportation occupations
36,575Construction and extraction occupations
Top industries in this zip code by the number of employees in 2005:
Construction: All Other Specialty Trade Contractors (10-19 employees: 1 establishment)
Construction: Drywall and Insulation Contractors (10-19: 1)
Wholesale Trade: Grain and Field Bean Merchant Wholesalers (10-19: 1)
Construction: Electrical Contractors (5-9: 1)
Construction: Site Preparation Contractors (1-4: 1)
Other Services (except Public Administration): General Automotive Repair (1-4: 1)
Construction: New Single-Family Housing Construction (except Operative Builders) (1-4: 1)
Fatal accident statistics in 2014:
Fatal accident count: 1
Vehicles involved in fatal accidents: 1
Fatal accidents caused by drunken drivers: 0
Fatalities: 1
Persons involved in fatal accidents: 0
Pedestrians involved in fatal accidents: 1
Home Mortgage Disclosure Act Aggregated Statistics For Year 2009 (Based on 2 partial tracts)
A) FHA, FSA/RHS & VA Home Purchase Loans
B) Conventional Home Purchase Loans
C) Refinancings
D) Home Improvement Loans
E) Loans on Dwellings For 5+ Families
F) Non-occupant Loans on < 5 Family Dwellings (A B C & D)
G) Loans On Manufactured Home Dwelling (A B C & D)
Number
Average Value
Number
Average Value
Number
Average Value
Number
Average Value
Number
Average Value
Number
Average Value
Number
Average Value
LOANS ORIGINATED
37
$132,501
58
$116,688
240
$133,072
33
$63,773
1
$1,400,860
14
$127,721
13
$47,193
APPLICATIONS APPROVED, NOT ACCEPTED
4
$80,252
11
$102,683
36
$136,795
3
$109,457
0
$0
1
$89,220
2
$70,825
APPLICATIONS DENIED
6
$143,488
5
$61,626
46
$130,312
4
$33,112
0
$0
0
$0
11
$85,709
APPLICATIONS WITHDRAWN
3
$79,410
4
$145,788
18
$131,123
0
$0
0
$0
1
$62,550
0
$0
FILES CLOSED FOR INCOMPLETENESS
4
$94,280
0
$0
4
$94,510
0
$0
0
$0
0
$0
1
$32,190
Aggregated Statistics For Year 2008 (Based on 2 partial tracts)
A) FHA, FSA/RHS & VA Home Purchase Loans
B) Conventional Home Purchase Loans
C) Refinancings
D) Home Improvement Loans
F) Non-occupant Loans on < 5 Family Dwellings (A B C & D)
G) Loans On Manufactured Home Dwelling (A B C & D)
Number
Average Value
Number
Average Value
Number
Average Value
Number
Average Value
Number
Average Value
Number
Average Value
LOANS ORIGINATED
16
$114,802
63
$124,611
126
$114,997
29
$30,163
13
$114,692
12
$77,647
APPLICATIONS APPROVED, NOT ACCEPTED
4
$117,275
9
$118,041
21
$123,822
3
$89,833
1
$59,790
2
$52,430
APPLICATIONS DENIED
6
$112,828
9
$93,309
60
$128,052
7
$94,871
3
$94,740
5
$63,834
APPLICATIONS WITHDRAWN
4
$68,295
10
$98,603
33
$129,664
2
$127,390
1
$59,790
4
$62,088
FILES CLOSED FOR INCOMPLETENESS
0
$0
0
$0
4
$151,308
0
$0
0
$0
0
$0
Aggregated Statistics For Year 2007 (Based on 2 partial tracts)
A) FHA, FSA/RHS & VA Home Purchase Loans
B) Conventional Home Purchase Loans
C) Refinancings
D) Home Improvement Loans
E) Loans on Dwellings For 5+ Families
F) Non-occupant Loans on < 5 Family Dwellings (A B C & D)
G) Loans On Manufactured Home Dwelling (A B C & D)
Number
Average Value
Number
Average Value
Number
Average Value
Number
Average Value
Number
Average Value
Number
Average Value
Number
Average Value
LOANS ORIGINATED
6
$81,402
107
$123,356
109
$109,203
24
$30,468
2
$933,135
24
$93,743
19
$50,928
APPLICATIONS APPROVED, NOT ACCEPTED
3
$79,717
12
$114,438
35
$120,336
3
$90,447
0
$0
0
$0
6
$51,202
APPLICATIONS DENIED
3
$69,597
14
$75,686
95
$117,967
19
$60,126
0
$0
4
$31,732
24
$69,062
APPLICATIONS WITHDRAWN
2
$90,140
7
$132,714
32
$153,750
3
$90,753
0
$0
3
$296,177
6
$64,233
FILES CLOSED FOR INCOMPLETENESS
0
$0
1
$101,180
9
$142,671
0
$0
0
$0
1
$145,330
0
$0
Aggregated Statistics For Year 2006 (Based on 2 partial tracts)
A) FHA, FSA/RHS & VA Home Purchase Loans
B) Conventional Home Purchase Loans
C) Refinancings
D) Home Improvement Loans
F) Non-occupant Loans on < 5 Family Dwellings (A B C & D)
G) Loans On Manufactured Home Dwelling (A B C & D)
Number
Average Value
Number
Average Value
Number
Average Value
Number
Average Value
Number
Average Value
Number
Average Value
LOANS ORIGINATED
5
$119,942
120
$106,697
86
$83,178
25
$34,290
10
$90,876
14
$57,291
APPLICATIONS APPROVED, NOT ACCEPTED
1
$19,320
18
$100,309
14
$86,330
4
$32,193
0
$0
4
$37,022
APPLICATIONS DENIED
1
$107,620
34
$85,244
81
$107,446
11
$21,741
11
$88,886
18
$62,087
APPLICATIONS WITHDRAWN
0
$0
12
$109,150
46
$106,177
8
$90,140
4
$48,290
5
$56,292
FILES CLOSED FOR INCOMPLETENESS
0
$0
1
$68,980
6
$102,558
1
$82,780
0
$0
0
$0
Aggregated Statistics For Year 2005 (Based on 2 partial tracts)
A) FHA, FSA/RHS & VA Home Purchase Loans
B) Conventional Home Purchase Loans
C) Refinancings
D) Home Improvement Loans
E) Loans on Dwellings For 5+ Families
F) Non-occupant Loans on < 5 Family Dwellings (A B C & D)
G) Loans On Manufactured Home Dwelling (A B C & D)
Number
Average Value
Number
Average Value
Number
Average Value
Number
Average Value
Number
Average Value
Number
Average Value
Number
Average Value
LOANS ORIGINATED
10
$118,838
123
$108,918
114
$98,870
17
$50,859
1
$915,200
18
$85,899
21
$52,604
APPLICATIONS APPROVED, NOT ACCEPTED
1
$29,430
19
$63,854
27
$101,553
5
$40,288
0
$0
0
$0
16
$45,185
APPLICATIONS DENIED
3
$117,733
40
$74,412
75
$97,597
15
$48,811
0
$0
6
$48,597
33
$54,575
APPLICATIONS WITHDRAWN
0
$0
13
$84,268
48
$104,761
7
$120,626
0
$0
3
$40,470
4
$60,018
FILES CLOSED FOR INCOMPLETENESS
0
$0
1
$52,430
4
$134,980
0
$0
0
$0
0
$0
0
$0
Aggregated Statistics For Year 2004 (Based on 2 partial tracts)
A) FHA, FSA/RHS & VA Home Purchase Loans
B) Conventional Home Purchase Loans
C) Refinancings
D) Home Improvement Loans
E) Loans on Dwellings For 5+ Families
F) Non-occupant Loans on < 5 Family Dwellings (A B C & D)
G) Loans On Manufactured Home Dwelling (A B C & D)

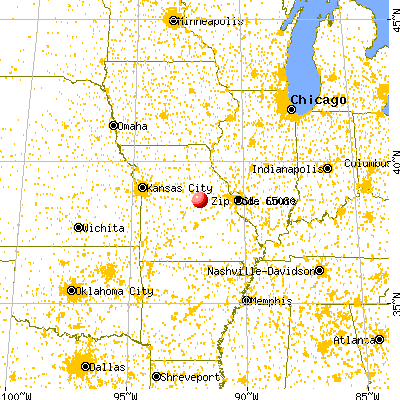


 Nearest zip codes: 65016, 65043, 65059, 65063, 65054, 65251.


