Estimated zip code population in 2022: 2,700 Zip code population in 2010: 2,806 Zip code population in 2000: 2,451
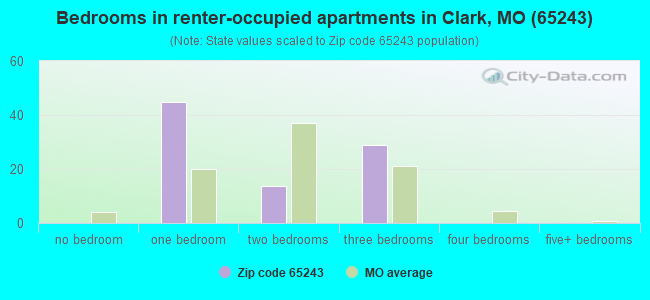
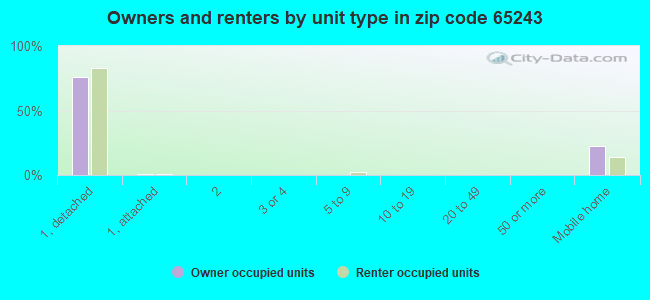
Houses and condos: 1,000 Renter-occupied apartments: 89
% of renters here:
11%
State:
32%
March 2022 cost of living index in zip code 65243: 76.5 (low, U.S. average is 100)
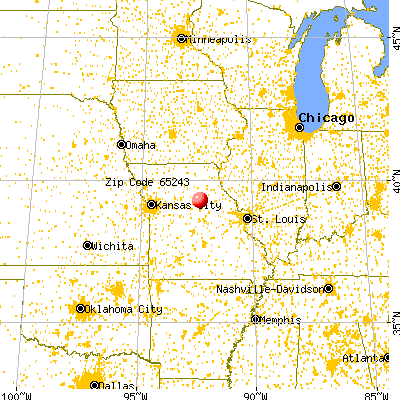
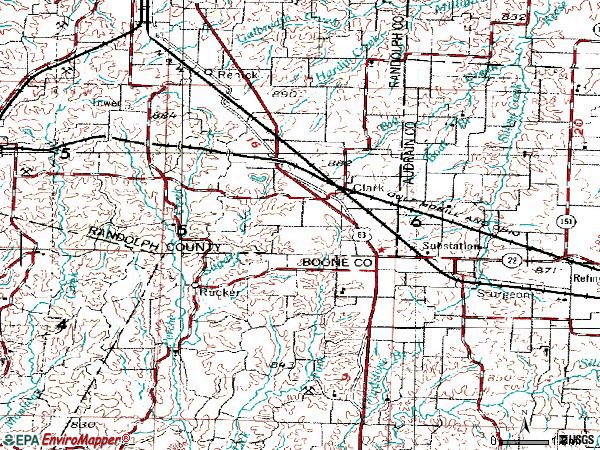
Land area: 98.7 sq. mi. Water area: 0.2 sq. mi.
Population density: 27 people per square mile
(very low).
OSM Map
General Map
Google Map
MSN Map
OSM Map
General Map
Google Map
MSN Map
OSM Map
General Map
Google Map
MSN Map
OSM Map
General Map
Google Map
MSN Map
Please wait while loading the map...
Real estate property taxes paid for housing units in 2022:
This zip code:
0.7% ($1,368)
Missouri:
0.8% ($1,810)
Median real estate property taxes paid for housing units with mortgages in 2022: $1,430 (0.7%) Median real estate property taxes paid for housing units with no mortgage in 2022: $1,280 (0.7%)
Business Search- 14 Million verified businesses
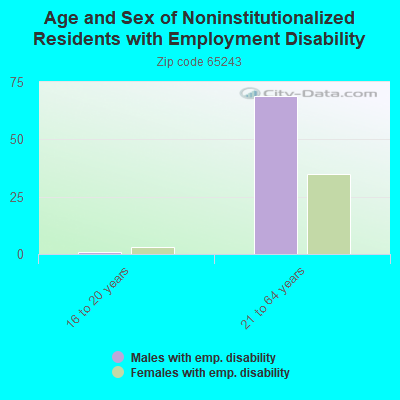
Males: 1,361
(50.4%)
Females: 1,339
(49.6%)
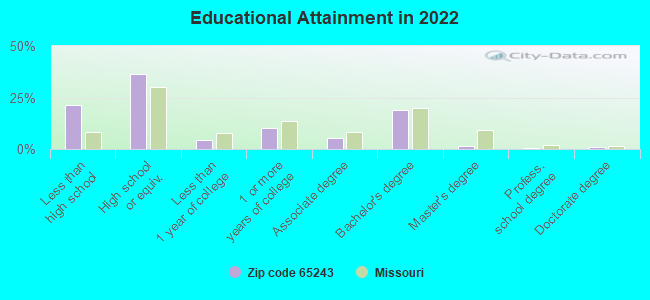
For population 25 years and over in 65243:
High school or higher: 77.7%
Bachelor's degree or higher: 22.0%
Graduate or professional degree: 3.1%
Unemployed: 4.1%
Mean travel time to work (commute): 25.2 minutes
For population 15 years and over in 65243:
Never married: 25.1%
Now married: 59.5%
Separated: 1.0%
Widowed: 5.4%
Divorced: 9.0%
Zip code 65243 compared to state average:
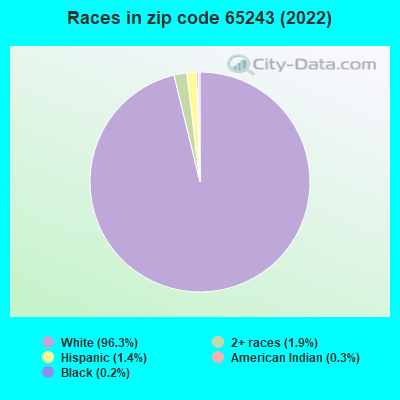
Black race population percentage significantly below state average.
Hispanic race population percentage significantly below state average.
Median age significantly below state average.
Foreign-born population percentage significantly below state average.
Renting percentage significantly below state average.
Length of stay since moving in significantly above state average.
House age below state average.
Number of college students below state average.
Percentage of population with a bachelor's degree or higher below state average.
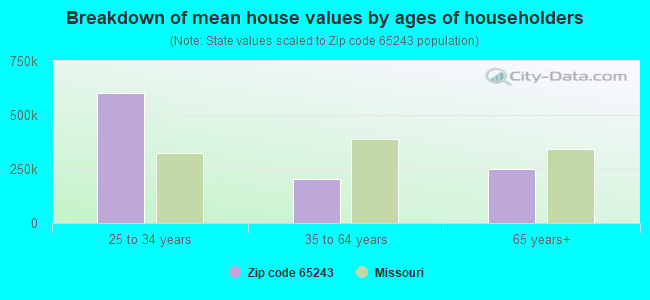
Estimated median house/condo value in 2022: $191,692
65243:
$191,692
Missouri:
$221,200
According to our research of Missouri and other state lists, there was 1 registered sex offender living in 65243 zip code as of June 16, 2024. The ratio of all residents to sex offenders in zip code 65243 is 2,523 to 1. The ratio of registered sex offenders to all residents in this zip code is much lower than the state average.
Median resident age:
This zip code:
30.2 years
Missouri median age:
39.1 years
Average household size:
This zip code:
3.2 people
Missouri:
2.4 people
Averages for the 2020 tax year for zip code 65243, filed in 2021:
Average Adjusted Gross Income (AGI) in 2020: $56,054 (Individual Income Tax Returns)
Here:
$56,054
State:
$68,151
Salary/wage: $46,524 (reported on 71.7% of returns)
Here:
$46,524
State:
$56,131
(% of AGI for various income ranges: 1390.6% for AGIs below $25k, 3851.3% for AGIs $25k-50k, 7228.9% for AGIs $50k-75k, 9226.7% for AGIs $75k-100k, 20773.3% for AGIs $100k-200k)
Taxable interest for individuals: $1,793 (reported on 29.3% of returns)
This zip code:
$1,793
Missouri:
$1,586
(% of AGI for various income ranges: 30.6% for AGIs below $25k, 61.9% for AGIs $25k-50k, 42.2% for AGIs $50k-75k, 43.3% for AGIs $75k-100k, 508.3% for AGIs $100k-200k)
Ordinary dividends: $2,936 (reported on 14.1% of returns)
Here:
$2,936
State:
$10,947
(% of AGI for various income ranges: 11.2% for AGIs below $25k, 21.9% for AGIs $25k-50k, 66.7% for AGIs $50k-75k, 495.0% for AGIs $100k-200k)
Net capital gain/loss in AGI: +$9,459 (reported on 17.2% of returns)
Here:
+$9,459
State:
+$18,453
(% of AGI for various income ranges: 54.7% for AGIs below $25k, 171.2% for AGIs $25k-50k, 141.1% for AGIs $50k-75k, 1856.7% for AGIs $100k-200k)
Profit/loss from business: +$22,059 (reported on 22.2% of returns)
Here:
+$22,059
State:
+$12,260
(% of AGI for various income ranges: 308.2% for AGIs below $25k, 643.8% for AGIs $25k-50k, 372.2% for AGIs $50k-75k, 1443.3% for AGIs $75k-100k, 3496.7% for AGIs $100k-200k)
Taxable individual retirement arrangement distribution: $15,371 (reported on 7.1% of returns)
65243:
$15,371
Missouri:
$19,719
(% of AGI for various income ranges: 98.8% for AGIs below $25k, 325.6% for AGIs $50k-75k, 1025.0% for AGIs $100k-200k)
Total itemized deductions: $28,633 (reported on 3.0% of returns)
Here:
$28,633
State:
$36,651
(% of AGI for various income ranges: 954.4% for AGIs $50k-75k)
Taxes paid: $5,867 (reported on 3.0% of returns)
65243:
$5,867
State:
$7,608
(% of AGI for various income ranges: 195.6% for AGIs $50k-75k)
Earned income credit: $2,364 (reported on 14.1% of returns)
Here:
$2,364
State:
$2,315
(% of AGI for various income ranges: 104.7% for AGIs below $25k, 95.6% for AGIs $25k-50k)
Percentage of individuals using paid preparers for their 2020 taxes: 90.9%
Here:
91%
State:
93%
(% for various income ranges: 90.6% for AGIs below $25k, 88.9% for AGIs $25k-50k, 93.3% for AGIs $50k-75k, 90.0% for AGIs $75k-100k, 107.7% for AGIs $100k-200k, 0.0% for AGIs over 200k)
Averages for the 2012 tax year for zip code 65243, filed in 2013:
Average Adjusted Gross Income (AGI) in 2012: $43,840 (Individual Income Tax Returns)
Here:
$43,840
State:
$55,896
Salary/wage: $40,342 (reported on 74.7% of returns)
Here:
$40,342
State:
$46,205
(% of AGI for various income ranges: 61.4% for AGIs below $25k, 72.8% for AGIs $25k-50k, 78.3% for AGIs $50k-75k, 78.9% for AGIs $75k-100k, 56.1% for AGIs $100k-200k)
Taxable interest for individuals: $923 (reported on 32.6% of returns)
This zip code:
$923
Missouri:
$1,559
(% of AGI for various income ranges: 1.6% for AGIs below $25k, 1.0% for AGIs $25k-50k, 0.4% for AGIs $50k-75k, 0.5% for AGIs $75k-100k, 0.4% for AGIs $100k-200k)
Ordinary dividends: $1,792 (reported on 12.6% of returns)
Here:
$1,792
State:
$7,410
(% of AGI for various income ranges: 0.3% for AGIs $25k-50k, 0.8% for AGIs $50k-75k, 0.9% for AGIs $100k-200k)
Net capital gain/loss in AGI: +$2,854 (reported on 13.7% of returns)
Here:
+$2,854
State:
+$11,579
(% of AGI for various income ranges: 1.8% for AGIs below $25k, 1.1% for AGIs $25k-50k, 0.7% for AGIs $50k-75k, 1.0% for AGIs $100k-200k)
Profit/loss from business: +$13,912 (reported on 17.9% of returns)
Here:
+$13,912
State:
+$11,688
(% of AGI for various income ranges: 13.1% for AGIs below $25k, 7.8% for AGIs $25k-50k, 7.0% for AGIs $50k-75k, 5.8% for AGIs $75k-100k)
Taxable individual retirement arrangement distribution: $10,171 (reported on 7.4% of returns)
65243:
$10,171
Missouri:
$14,773
Total itemized deductions: $19,441 (22% of AGI, reported on 17.9% of returns)
Here:
$19,441
State:
$22,730
Here:
21.6% of AGI
State:
19.2% of AGI
(% of AGI for various income ranges: 6.4% for AGIs below $25k, 4.8% for AGIs $25k-50k, 6.8% for AGIs $50k-75k, 9.9% for AGIs $75k-100k, 10.6% for AGIs $100k-200k)
Charity contributions: $4,677 (reported on 13.7% of returns)
Here:
$4,677
State:
$4,745
(% of AGI for various income ranges: 1.4% for AGIs below $25k, 1.0% for AGIs $50k-75k, 2.2% for AGIs $75k-100k, 2.4% for AGIs $100k-200k)
Taxes paid: $5,641 (reported on 17.9% of returns)
65243:
$5,641
State:
$8,399
(% of AGI for various income ranges: 0.9% for AGIs below $25k, 0.8% for AGIs $25k-50k, 1.8% for AGIs $50k-75k, 3.3% for AGIs $75k-100k, 3.8% for AGIs $100k-200k)
Earned income credit: $2,000 (reported on 17.9% of returns)
Here:
$2,000
State:
$2,288
(% of AGI for various income ranges: 4.6% for AGIs below $25k, 1.3% for AGIs $25k-50k)
Percentage of individuals using paid preparers for their 2012 taxes: 63.2%
Here:
63%
State:
55%
(% for various income ranges: 61.0% for AGIs below $25k, 63.6% for AGIs $25k-50k, 62.5% for AGIs $50k-75k, 62.5% for AGIs $75k-100k, 75.0% for AGIs $100k-200k)
Averages for the 2004 tax year for zip code 65243, filed in 2005:
Average Adjusted Gross Income (AGI) in 2004: $36,369 (Individual Income Tax Returns)
Here:
$36,369
State:
$44,591
Salary/wage: $36,794 (reported on 77.1% of returns)
Here:
$36,794
State:
$38,941
(% of AGI for various income ranges: 103.3% for AGIs below $10k, 67.5% for AGIs $10k-25k, 77.3% for AGIs $25k-50k, 83.9% for AGIs $50k-75k, 89.1% for AGIs $75k-100k, 62.8% for AGIs over 100k)
Taxable interest for individuals: $1,135 (reported on 42.7% of returns)
This zip code:
$1,135
Missouri:
$1,801
(% of AGI for various income ranges: 4.2% for AGIs below $10k, 2.8% for AGIs $10k-25k, 1.0% for AGIs $25k-50k, 0.6% for AGIs $50k-75k, 0.8% for AGIs $75k-100k, 2.3% for AGIs over 100k)
Taxable dividends: $524 (reported on 17.3% of returns)
Here:
$524
State:
$3,677
(% of AGI for various income ranges: 0.1% for AGIs $10k-25k, 0.1% for AGIs $25k-50k, 0.6% for AGIs $50k-75k, 0.2% for AGIs $75k-100k, 0.1% for AGIs over 100k)
Net capital gain/loss: +$2,632 (reported on 17.9% of returns)
Here:
+$2,632
State:
+$8,915
(% of AGI for various income ranges: 1.9% for AGIs below $10k, 1.9% for AGIs $10k-25k, 1.4% for AGIs $25k-50k, 1.4% for AGIs $50k-75k, 0.5% for AGIs $75k-100k, 1.3% for AGIs over 100k)
Profit/loss from business: +$7,907 (reported on 17.6% of returns)
Here:
+$7,907
State:
+$9,793
(% of AGI for various income ranges: 12.4% for AGIs below $10k, 8.7% for AGIs $10k-25k, 4.3% for AGIs $25k-50k, 5.1% for AGIs $50k-75k, -0.6% for AGIs $75k-100k)
Profit/loss from farming: +$1,455 (reported on 23.5% of returns)
Here:
+$1,455
State:
-$5,056
(% of AGI for various income ranges: -20.6% for AGIs below $10k, 7.8% for AGIs $10k-25k, 1.9% for AGIs $25k-50k, 1.4% for AGIs $50k-75k, -1.9% for AGIs $75k-100k, -2.2% for AGIs over 100k)
IRA payment deduction: $2,000 (reported on 1.3% of returns)
65243:
$2,000
Missouri:
$2,972
Total itemized deductions: $15,085 (22% of AGI, reported on 20.7% of returns)
Here:
$15,085
State:
$18,261
Here:
22.2% of AGI
State:
20.5% of AGI
(% of AGI for various income ranges: 4.9% for AGIs $10k-25k, 6.8% for AGIs $25k-50k, 10.0% for AGIs $50k-75k, 11.3% for AGIs $75k-100k, 11.3% for AGIs over 100k)
Charity contributions deductions: $2,724 (4% of AGI, reported on 15.8% of returns)
Here:
$2,724
State:
$3,665
Here:
3.9% of AGI
State:
3.9% of AGI
(% of AGI for various income ranges: 0.8% for AGIs $10k-25k, 0.9% for AGIs $25k-50k, 1.3% for AGIs $50k-75k, 1.5% for AGIs $75k-100k, 1.7% for AGIs over 100k)
Total tax: $4,536 (reported on 66.5% of returns)
65243:
$4,536
State:
$6,999
(% of AGI for various income ranges: 1.9% for AGIs below $10k, 3.0% for AGIs $10k-25k, 5.8% for AGIs $25k-50k, 8.0% for AGIs $50k-75k, 9.9% for AGIs $75k-100k, 17.9% for AGIs over 100k)
Earned income credit: $1,878 (reported on 13.5% of returns)
Here:
$1,878
State:
$1,728
Percentage of individuals using paid preparers for their 2004 taxes: 66.2%
Here:
66%
State:
62%
(% for various income ranges: 62.7% for AGIs below $10k, 66.9% for AGIs $10k-25k, 65.9% for AGIs $25k-50k, 66.4% for AGIs $50k-75k, 69.0% for AGIs $75k-100k, 75.9% for AGIs over 100k)
Household received Food Stamps/SNAP in the past 12 months: 31 Household did not receive Food Stamps/SNAP in the past 12 months: 800
Women who had a birth in the past 12 months: 113 (108 now married, 0 unmarried) Women who did not have a birth in the past 12 months: 483 (250 now married, 231 unmarried)
Housing units in zip code 65243 with a mortgage: 397 (21 second mortgage, 22 both second mortgage and home equity loan) Houses without a mortgage: 14
Median monthly owner costs for units with a mortgage: $1,223 Median monthly owner costs for units without a mortgage: $414
Residents with income below the poverty level in 2022:
This zip code:
36.1%
Whole state:
13.2%
Residents with income below 50% of the poverty level in 2022:
This zip code:
12.5%
Whole state:
6.8%
Median number of rooms in houses and condos:
Here:
6.3
State:
6.4
Median number of rooms in apartments:
Here:
2.5
State:
4.4
Notable locations in this zip code not listed on our city pages
Churches in zip code 65243 include: Pleasant Grove Church (A), Perche Church (B), Fairview Church (C), New Hope Church (D). Display/hide their locations on the map
Reservoirs: Tincher Lake North (A), Backues Lake (B), Charles Hood Lake (C), Tincher Lake South (D), Milnes Lake (E), Martin Lake (F). Display/hide their locations on the map
Streams, rivers, and creeks: Boat Branch (A), Saling Creek (B), Little Perche Creek (C), Big Creek (D), Sugar Creek (E), Pisgah Branch (F). Display/hide their locations on the map
Size of family households: 262 2-persons, 62 3-persons, 166 4-persons, 10 5-persons, 8 6-persons, 89 7-or-more-persons
Size of nonfamily households: 197 1-person, 25 2-persons
854 married couples with children.
44 single-parent households (6 men, 38 women).
75.5% of residents of 65243 zip code speak English at home.
1.7% of residents speak Spanish at home (100% very well).
21.8% of residents speak other Indo-European language at home (59% very well, 36% well, 3% not well, 2% not at all).
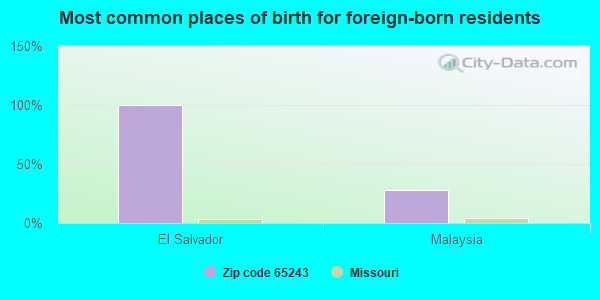
Foreign born population: 18 (0.7%) (100.0% of them are naturalized citizens)
This zip code:
0.7%
Whole state:
4.1%
100%El Salvador
28%Malaysia
28%Dutch
27%American
18%German
10%English
4%Pennsylvania German
3%Irish
2%European
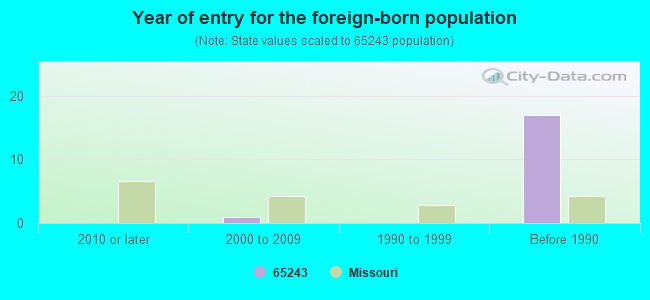
Year of entry for the foreign-born population
02010 or later
12000 to 2009
01990 to 1999
17Before 1990
Facilities with environmental interests located in this zip code:
CLARK (CLARK in CLARK, MO)
STATE MASTER (Missouri monitoring and compilance) - PCS-MO0054585, NPDES NON-MAJOR National Pollutant Discharge Elimination System NON-MAJOR (Tracking pollutant discharge elimination systems) - permit COMMUNITY WATER SYSTEM (SDWIS) Business SIC classification: SEWERAGE SYSTEMS Organizations: CITY OF CLARK (CONTACT/OWNER)
Alternative names: CLARK WWTF
PANHANDLE EASTERN PIPE LINE GEHLKEN (1.9 MI W OF HWY 63 ON HWY F in CLARK, MO)
STATE MASTER (Missouri monitoring and compilance) - RCRAINFO-MOP000042028, NOT IN A UNIVERSE (Resource Conservation and Recovery Act (tracking hazardous waste)) Organizations: PANHANDLE EASTERN PIPELINE COMPANY (CONTACT/OWNER)
PANHANDLE EASTERN PIPE LINE TOMLIN FARM (1.3 MI W OF HWY 63 ON HWY F in CLARK, MO)
STATE MASTER (Missouri monitoring and compilance) - RCRAINFO-MOP000042010, NOT IN A UNIVERSE (Resource Conservation and Recovery Act (tracking hazardous waste)) Organizations: PANHANDLE EASTERN PIPE LINE COMPANY (CONTACT/OWNER)
BARKLEY SUBDIVISION (SE WABASH & LISBON ST in CLARK, MO)
National Pollutant Discharge Elimination System NON-MAJOR (Tracking pollutant discharge elimination systems) - permit Business SIC classification: HEAVY CONSTRUCTION Organizations: ALVIN BARKLEY (CONTACT/OWNER)
Alternative names: ALVIN BARKLEY
ASH GROVE AMISH SCHOOL ( in CLARK, MO)
COMPLIANCE ACTIVITY (Tracking inspections of insecticide, fungicide, and rodenticide, and toxic substances)
PLAIN VIEW AMISH SCHOOL ( in CLARK, MO)
COMPLIANCE ACTIVITY (Tracking inspections of insecticide, fungicide, and rodenticide, and toxic substances)
PLEASANT RIDGE AMISH SCHOOL ( in CLARK, MO)
COMPLIANCE ACTIVITY (Tracking inspections of insecticide, fungicide, and rodenticide, and toxic substances)
HAVEN HILL AMISH SCHOOL ( in CLARK, MO)
COMPLIANCE ACTIVITY (Tracking inspections of insecticide, fungicide, and rodenticide, and toxic substances)
Housing units lacking complete plumbing facilities: 9.6% Housing units lacking complete kitchen facilities: 8.6%
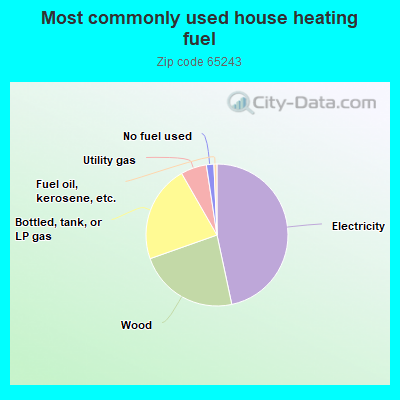
46.8%Electricity
23.0%Wood
22.2%Bottled, tank, or LP gas
5.9%Utility gas
1.7%No fuel used
0.7%Fuel oil, kerosene, etc.
Population in 1990: 4,672.
Place of birth for U.S.-born residents:
This state: 2,184
Northeast: 68
Midwest: 234
South: 61
West: 127
65% of the 65243 zip code residents lived in the same house 5 years ago. Out of people who lived in different houses, 60% lived in this county. Out of people who lived in different counties, 50% lived in Missouri.
97% of the 65243 zip code residents lived in the same house 1 year ago. Out of people who lived in different houses, 94% moved from this county. Out of people who lived in different houses, 9% moved from different county within same state. Out of people who lived in different houses, 4% moved from abroad.
Private vs. public school enrollment:
Students in private schools in grades 1 to 8 (elementary and middle school): 154
Here:
41.6%
Missouri:
15.4%
Students in private schools in grades 9 to 12 (high school): 16
Here:
13.8%
Missouri:
13.9%
Students in private undergraduate colleges: 4
Here:
8.2%
Missouri:
22.6%
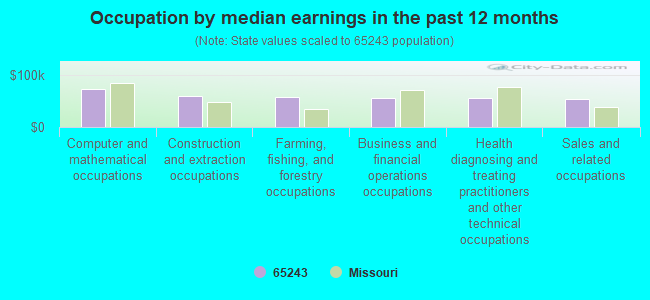
Occupation by median earnings in the past 12 months ($)
72,670Computer and mathematical occupations
59,147Construction and extraction occupations
57,110Farming, fishing, and forestry occupations
56,102Business and financial operations occupations
55,684Health diagnosing and treating practitioners and other technical occupations
53,956Sales and related occupations
Top industries in this zip code by the number of employees in 2005:
Wholesale Trade: Grain and Field Bean Merchant Wholesalers (5-9 employees: 1 establishment)
Information: Periodical Publishers (5-9: 1)
Construction: Electrical Contractors (5-9: 1)
Arts, Entertainment, and Recreation: Golf Courses and Country Clubs (1-4: 2)
Construction: New Single-Family Housing Construction (except Operative Builders) (1-4: 2)
Professional, Scientific, and Technical Services: Engineering Services (1-4: 2)
Construction: Framing Contractors (1-4: 1)
Other Services (except Public Administration): Nail Salons (1-4: 1)
Construction: Masonry Contractors (1-4: 1)
Fatal accident statistics in 2014:
Fatal accident count: 1
Vehicles involved in fatal accidents: 1
Fatal accidents caused by drunken drivers: 0
Fatalities: 1
Persons involved in fatal accidents: 1
Pedestrians involved in fatal accidents: 0
Fatal accident statistics in 2013:
Fatal accident count: 1
Vehicles involved in fatal accidents: 1
Fatal accidents caused by drunken drivers: 0
Fatalities: 1
Persons involved in fatal accidents: 5
Pedestrians involved in fatal accidents: 0
Home Mortgage Disclosure Act Aggregated Statistics For Year 2009 (Based on 2 partial tracts)
A) FHA, FSA/RHS & VA Home Purchase Loans
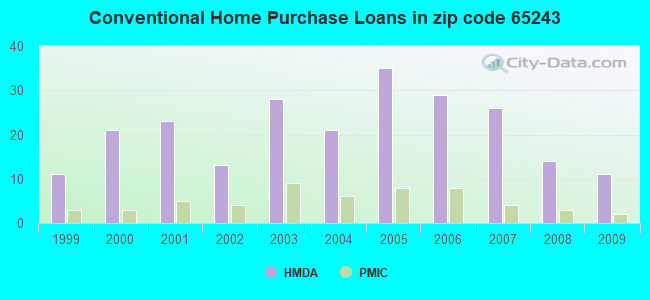
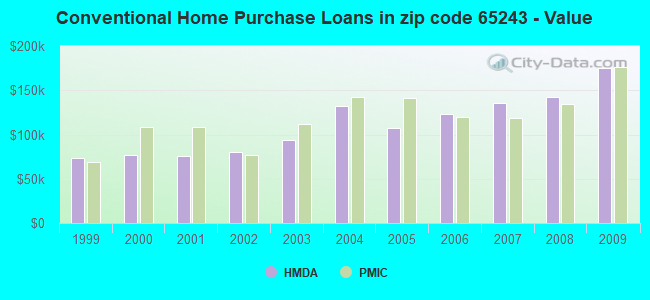
B) Conventional Home Purchase Loans
C) Refinancings
D) Home Improvement Loans
F) Non-occupant Loans on < 5 Family Dwellings (A B C & D)
G) Loans On Manufactured Home Dwelling (A B C & D)
Number
Average Value
Number
Average Value
Number
Average Value
Number
Average Value
Number
Average Value
Number
Average Value
LOANS ORIGINATED
9
$155,218
11
$175,663
68
$144,779
5
$57,920
4
$90,302
5
$69,468
APPLICATIONS APPROVED, NOT ACCEPTED
0
$0
3
$74,450
3
$93,550
1
$25,960
0
$0
2
$23,725
APPLICATIONS DENIED
1
$294,520
3
$60,127
17
$139,783
1
$19,250
0
$0
5
$61,680
APPLICATIONS WITHDRAWN
0
$0
0
$0
9
$149,548
1
$12,980
0
$0
1
$82,360
FILES CLOSED FOR INCOMPLETENESS
0
$0
0
$0
2
$166,730
0
$0
0
$0
0
$0
Aggregated Statistics For Year 2008 (Based on 2 partial tracts)
A) FHA, FSA/RHS & VA Home Purchase Loans
B) Conventional Home Purchase Loans
C) Refinancings
D) Home Improvement Loans
F) Non-occupant Loans on < 5 Family Dwellings (A B C & D)
G) Loans On Manufactured Home Dwelling (A B C & D)
Number
Average Value
Number
Average Value
Number
Average Value
Number
Average Value
Number
Average Value
Number
Average Value
LOANS ORIGINATED
7
$137,541
14
$142,113
46
$144,370
5
$85,670
5
$100,172
7
$79,737
APPLICATIONS APPROVED, NOT ACCEPTED
0
$0
1
$130,250
4
$149,835
0
$0
0
$0
1
$64,900
APPLICATIONS DENIED
1
$83,700
4
$84,038
14
$138,309
4
$43,305
0
$0
6
$69,080
APPLICATIONS WITHDRAWN
2
$91,980
2
$374,415
12
$146,104
2
$133,160
0
$0
1
$143,230
FILES CLOSED FOR INCOMPLETENESS
0
$0
0
$0
1
$135,180
0
$0
0
$0
1
$56,400
Aggregated Statistics For Year 2007 (Based on 2 partial tracts)
A) FHA, FSA/RHS & VA Home Purchase Loans
B) Conventional Home Purchase Loans
C) Refinancings
D) Home Improvement Loans
F) Non-occupant Loans on < 5 Family Dwellings (A B C & D)
G) Loans On Manufactured Home Dwelling (A B C & D)
Number
Average Value
Number
Average Value
Number
Average Value
Number
Average Value
Number
Average Value
Number
Average Value
LOANS ORIGINATED
5
$124,612
26
$135,812
38
$116,399
8
$44,145
5
$105,454
13
$75,885
APPLICATIONS APPROVED, NOT ACCEPTED
0
$0
2
$117,720
8
$167,682
0
$0
0
$0
1
$80,570
APPLICATIONS DENIED
0
$0
9
$91,808
26
$114,792
4
$45,880
2
$54,605
9
$68,682
APPLICATIONS WITHDRAWN
0
$0
4
$120,068
14
$127,886
1
$106,080
0
$0
1
$90,420
FILES CLOSED FOR INCOMPLETENESS
0
$0
0
$0
4
$163,710
0
$0
0
$0
0
$0
Aggregated Statistics For Year 2006 (Based on 2 partial tracts)
A) FHA, FSA/RHS & VA Home Purchase Loans
B) Conventional Home Purchase Loans
C) Refinancings
D) Home Improvement Loans
F) Non-occupant Loans on < 5 Family Dwellings (A B C & D)
G) Loans On Manufactured Home Dwelling (A B C & D)
Number
Average Value
Number
Average Value
Number
Average Value
Number
Average Value
Number
Average Value
Number
Average Value
LOANS ORIGINATED
4
$119,510
29
$123,121
36
$115,841
7
$73,150
5
$132,400
8
$83,981
APPLICATIONS APPROVED, NOT ACCEPTED
0
$0
4
$99,255
4
$117,608
0
$0
0
$0
2
$56,175
APPLICATIONS DENIED
0
$0
14
$71,041
32
$110,417
4
$19,358
1
$56,400
15
$73,466
APPLICATIONS WITHDRAWN
1
$123,090
6
$121,002
16
$126,755
1
$96,230
1
$298,100
4
$72,848
FILES CLOSED FOR INCOMPLETENESS
0
$0
0
$0
5
$136,698
0
$0
0
$0
0
$0
Aggregated Statistics For Year 2005 (Based on 2 partial tracts)
A) FHA, FSA/RHS & VA Home Purchase Loans
B) Conventional Home Purchase Loans
C) Refinancings
D) Home Improvement Loans
E) Loans on Dwellings For 5+ Families
F) Non-occupant Loans on < 5 Family Dwellings (A B C & D)
G) Loans On Manufactured Home Dwelling (A B C & D)
Number
Average Value
Number
Average Value
Number
Average Value
Number
Average Value
Number
Average Value
Number
Average Value
Number
Average Value
LOANS ORIGINATED
4
$106,752
35
$107,347
39
$120,554
6
$53,265
1
$154,870
7
$98,664
11
$65,390
APPLICATIONS APPROVED, NOT ACCEPTED
0
$0
4
$88,848
7
$115,544
0
$0
0
$0
0
$0
2
$31,780
APPLICATIONS DENIED
0
$0
13
$78,468
40
$104,123
4
$23,162
0
$0
1
$147,260
15
$60,098
APPLICATIONS WITHDRAWN
2
$108,095
4
$97,800
24
$113,112
3
$80,717
0
$0
1
$82,810
3
$64,903
FILES CLOSED FOR INCOMPLETENESS
0
$0
1
$115,480
3
$228,277
0
$0
0
$0
0
$0
0
$0
Aggregated Statistics For Year 2004 (Based on 2 partial tracts)
A) FHA, FSA/RHS & VA Home Purchase Loans
B) Conventional Home Purchase Loans
C) Refinancings
D) Home Improvement Loans
F) Non-occupant Loans on < 5 Family Dwellings (A B C & D)
G) Loans On Manufactured Home Dwelling (A B C & D)
Number
Average Value
Number
Average Value
Number
Average Value
Number
Average Value
Number
Average Value
Number
Average Value
LOANS ORIGINATED
5
$84,418
21
$131,914
55
$109,052
6
$39,240
2
$77,435
14
$64,998
APPLICATIONS APPROVED, NOT ACCEPTED
0
$0
7
$91,566
8
$101,829
0
$0
0
$0
6
$65,125
APPLICATIONS DENIED
2
$108,765
10
$73,048
29
$96,712
5
$48,340
1
$63,110
9
$68,682
APPLICATIONS WITHDRAWN
0
$0
2
$57,515
21
$102,053
0
$0
0
$0
3
$67,290
FILES CLOSED FOR INCOMPLETENESS
0
$0
1
$92,210
6
$164,568
0
$0
0
$0
0
$0
Aggregated Statistics For Year 2003 (Based on 2 partial tracts)
A) FHA, FSA/RHS & VA Home Purchase Loans
B) Conventional Home Purchase Loans
C) Refinancings
D) Home Improvement Loans
F) Non-occupant Loans on < 5 Family Dwellings (A B C & D)
Number
Average Value
Number
Average Value
Number
Average Value
Number
Average Value
Number
Average Value
LOANS ORIGINATED
2
$105,635
28
$93,596
129
$106,147
4
$15,890
6
$60,873
APPLICATIONS APPROVED, NOT ACCEPTED
0
$0
4
$62,218
8
$84,092
0
$0
0
$0
APPLICATIONS DENIED
0
$0
8
$70,218
35
$99,738
3
$14,770
1
$55,050
APPLICATIONS WITHDRAWN
0
$0
3
$110,407
26
$109,593
0
$0
0
$0
FILES CLOSED FOR INCOMPLETENESS
0
$0
0
$0
4
$82,248
0
$0
0
$0
Aggregated Statistics For Year 2002 (Based on 2 partial tracts)
A) FHA, FSA/RHS & VA Home Purchase Loans
B) Conventional Home Purchase Loans
C) Refinancings
D) Home Improvement Loans
F) Non-occupant Loans on < 5 Family Dwellings (A B C & D)
Number
Average Value
Number
Average Value
Number
Average Value
Number
Average Value
Number
Average Value
LOANS ORIGINATED
2
$68,705
13
$80,568
98
$103,414
2
$28,425
4
$62,328
APPLICATIONS APPROVED, NOT ACCEPTED
0
$0
5
$73,048
6
$102,277
0
$0
0
$0
APPLICATIONS DENIED
0
$0
7
$81,911
26
$88,625
2
$8,280
0
$0
APPLICATIONS WITHDRAWN
0
$0
2
$73,185
22
$86,855
0
$0
1
$28,650
FILES CLOSED FOR INCOMPLETENESS
1
$119,510
2
$83,925
1
$190,680
0
$0
0
$0
Aggregated Statistics For Year 2001 (Based on 2 partial tracts)
A) FHA, FSA/RHS & VA Home Purchase Loans
B) Conventional Home Purchase Loans
C) Refinancings
D) Home Improvement Loans
F) Non-occupant Loans on < 5 Family Dwellings (A B C & D)
Number
Average Value
Number
Average Value
Number
Average Value
Number
Average Value
Number
Average Value
LOANS ORIGINATED
1
$111,450
23
$75,391
68
$100,453
5
$14,054
1
$106,980
APPLICATIONS APPROVED, NOT ACCEPTED
0
$0
4
$36,592
7
$98,024
1
$58,190
0
$0
APPLICATIONS DENIED
1
$57,740
8
$48,900
24
$69,938
2
$30,435
0
$0
APPLICATIONS WITHDRAWN
0
$0
2
$68,930
16
$80,540
2
$14,100
0
$0
FILES CLOSED FOR INCOMPLETENESS
0
$0
1
$114,140
4
$91,758
0
$0
0
$0
Aggregated Statistics For Year 2000 (Based on 2 partial tracts)
A) FHA, FSA/RHS & VA Home Purchase Loans
B) Conventional Home Purchase Loans
C) Refinancings
D) Home Improvement Loans
F) Non-occupant Loans on < 5 Family Dwellings (A B C & D)
Number
Average Value
Number
Average Value
Number
Average Value
Number
Average Value
Number
Average Value
LOANS ORIGINATED
1
$118,170
21
$77,392
32
$73,728
4
$18,800
3
$31,930
APPLICATIONS APPROVED, NOT ACCEPTED
1
$55,500
6
$40,955
5
$60,964
1
$42,070
0
$0
APPLICATIONS DENIED
2
$55,950
25
$45,387
18
$71,143
4
$37,598
1
$47,000
APPLICATIONS WITHDRAWN
0
$0
1
$137,410
12
$62,925
0
$0
0
$0
FILES CLOSED FOR INCOMPLETENESS
0
$0
0
$0
3
$55,800
0
$0
0
$0
Aggregated Statistics For Year 1999 (Based on 1 partial tract)
A) FHA, FSA/RHS & VA Home Purchase Loans
B) Conventional Home Purchase Loans
C) Refinancings
D) Home Improvement Loans
F) Non-occupant Loans on < 5 Family Dwellings (A B C & D)
Detailed PMIC statistics for the following Tracts:0019.01
2002 - 2018 National Fire Incident Reporting System (NFIRS) incidents
According to the data from the years 2002 - 2018 the average number of fires per year is 8. The highest number of reported fire incidents - 21 took place in 2003, and the least - 0 in 2009. The data has a declining trend.
When looking into fire subcategories, the most incidents belonged to: Outside Fires (59.6%), and Structure Fires (27.9%).
Fire incident types reported to NFIRS in Zip Code 65243


+$1,455
-$5,056
(% of AGI for various income ranges: -20.6% for AGIs below $10k, 7.8% for AGIs $10k-25k, 1.9% for AGIs $25k-50k, 1.4% for AGIs $50k-75k, -1.9% for AGIs $75k-100k, -2.2% for AGIs over 100k)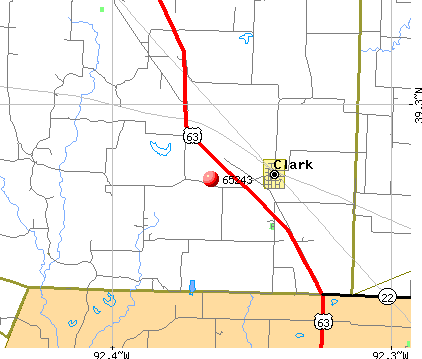 Nearest zip codes: 65284, 65278, 65270, 65256, 65257, 65255.
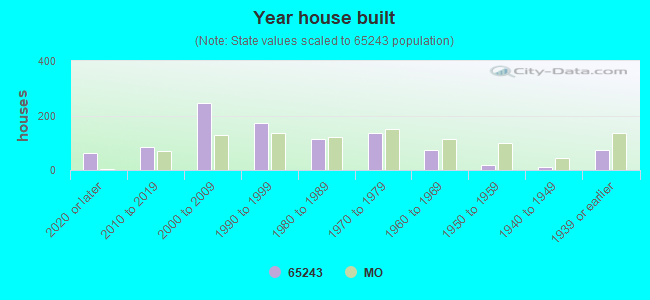


 According to the data from the years 2002 - 2018 the average number of fires per year is 8. The highest number of reported fire incidents - 21 took place in 2003, and the least - 0 in 2009. The data has a declining trend.
 When looking into fire subcategories, the most incidents belonged to: Outside Fires (59.6%), and Structure Fires (27.9%).