Estimated zip code population in 2022: 1,524 Zip code population in 2010: 1,948 Zip code population in 2000: 1,917
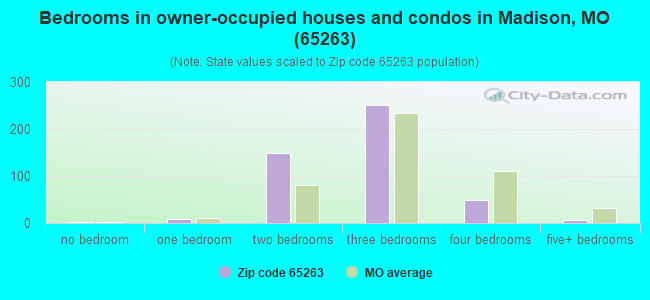
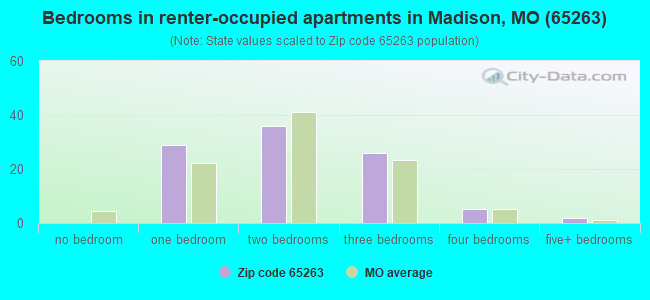
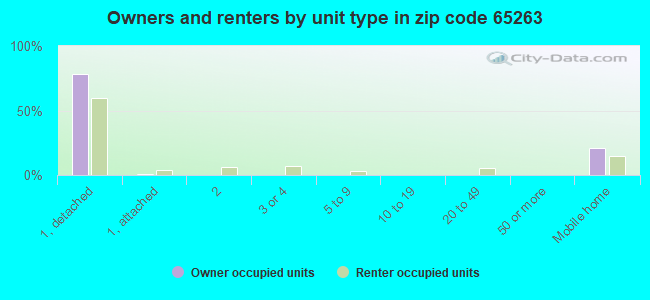
Houses and condos: 762 Renter-occupied apartments: 98
% of renters here:
17%
State:
32%
March 2022 cost of living index in zip code 65263: 76.6 (low, U.S. average is 100)
Land area: 135.6 sq. mi. Water area: 0.4 sq. mi.
Population density: 11 people per square mile
(very low).
OSM Map
General Map
Google Map
MSN Map
OSM Map
General Map
Google Map
MSN Map
OSM Map
General Map
Google Map
MSN Map
OSM Map
General Map
Google Map
MSN Map
Please wait while loading the map...
Real estate property taxes paid for housing units in 2022:
This zip code:
0.5% ($890)
Missouri:
0.8% ($1,810)
Median real estate property taxes paid for housing units with mortgages in 2022: $947 (1.0%) Median real estate property taxes paid for housing units with no mortgage in 2022: $879 (0.5%)
Business Search- 14 Million verified businesses
Males: 817
(53.6%)
Females: 706
(46.4%)
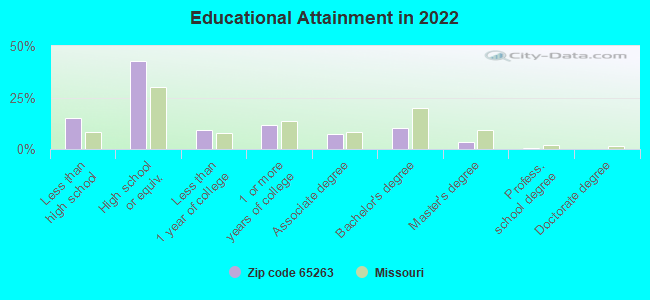
For population 25 years and over in 65263:
High school or higher: 84.0%
Bachelor's degree or higher: 13.8%
Graduate or professional degree: 3.8%
Unemployed: 1.3%
Mean travel time to work (commute): 28.8 minutes
For population 15 years and over in 65263:
Never married: 25.7%
Now married: 48.0%
Separated: 0.0%
Widowed: 10.7%
Divorced: 15.7%
Zip code 65263 compared to state average:
Unemployed percentage significantly below state average.
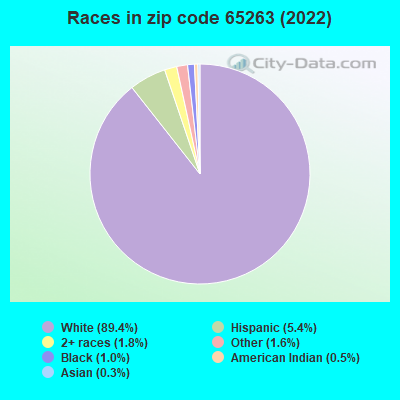
Black race population percentage significantly below state average.
Median age above state average.
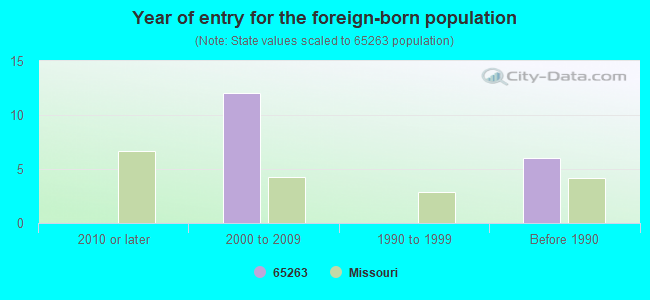
Foreign-born population percentage significantly below state average.
Renting percentage below state average.
Length of stay since moving in significantly above state average.
Number of college students below state average.
Percentage of population with a bachelor's degree or higher significantly below state average.
Averages for the 2020 tax year for zip code 65263, filed in 2021:
Average Adjusted Gross Income (AGI) in 2020: $47,107 (Individual Income Tax Returns)
Here:
$47,107
State:
$68,151
Salary/wage: $41,011 (reported on 77.8% of returns)
Here:
$41,011
State:
$56,131
(% of AGI for various income ranges: 1449.4% for AGIs below $25k, 4018.1% for AGIs $25k-50k, 6912.9% for AGIs $50k-75k, 11447.5% for AGIs $75k-100k, 18452.5% for AGIs $100k-200k)
Taxable interest for individuals: $588 (reported on 30.9% of returns)
This zip code:
$588
Missouri:
$1,586
(% of AGI for various income ranges: 12.2% for AGIs below $25k, 30.6% for AGIs $25k-50k, 25.7% for AGIs $50k-75k, 105.0% for AGIs $75k-100k, 40.0% for AGIs $100k-200k)
Ordinary dividends: $1,708 (reported on 16.0% of returns)
Here:
$1,708
State:
$10,947
(% of AGI for various income ranges: 18.9% for AGIs below $25k, 65.6% for AGIs $25k-50k, 80.0% for AGIs $50k-75k, 67.5% for AGIs $100k-200k)
Net capital gain/loss in AGI: +$9,133 (reported on 18.5% of returns)
Here:
+$9,133
State:
+$18,453
(% of AGI for various income ranges: 76.1% for AGIs below $25k, 38.1% for AGIs $25k-50k, 267.1% for AGIs $50k-75k, 2462.5% for AGIs $100k-200k)
Profit/loss from business: +$7,600 (reported on 16.0% of returns)
Here:
+$7,600
State:
+$12,260
(% of AGI for various income ranges: 90.6% for AGIs below $25k, 258.1% for AGIs $25k-50k, 90.0% for AGIs $50k-75k, 872.5% for AGIs $100k-200k)
Taxable individual retirement arrangement distribution: $14,100 (reported on 7.4% of returns)
65263:
$14,100
Missouri:
$19,719
(% of AGI for various income ranges: 180.0% for AGIs $25k-50k, 1395.0% for AGIs $75k-100k)
Earned income credit: $2,100 (reported on 19.8% of returns)
Here:
$2,100
State:
$2,315
(% of AGI for various income ranges: 107.8% for AGIs below $25k, 88.8% for AGIs $25k-50k)
Percentage of individuals using paid preparers for their 2020 taxes: 95.1%
Here:
95%
State:
93%
(% for various income ranges: 93.5% for AGIs below $25k, 95.7% for AGIs $25k-50k, 100.0% for AGIs $50k-75k, 85.7% for AGIs $75k-100k, 100.0% for AGIs $100k-200k)
Averages for the 2012 tax year for zip code 65263, filed in 2013:
Average Adjusted Gross Income (AGI) in 2012: $38,192 (Individual Income Tax Returns)
Here:
$38,192
State:
$55,896
Salary/wage: $35,008 (reported on 78.7% of returns)
Here:
$35,008
State:
$46,205
(% of AGI for various income ranges: 66.1% for AGIs below $25k, 78.0% for AGIs $25k-50k, 78.3% for AGIs $50k-75k, 74.3% for AGIs $75k-100k, 58.1% for AGIs $100k-200k)
Taxable interest for individuals: $692 (reported on 32.0% of returns)
This zip code:
$692
Missouri:
$1,559
(% of AGI for various income ranges: 2.0% for AGIs below $25k, 0.4% for AGIs $25k-50k, 0.5% for AGIs $50k-75k, 0.2% for AGIs $75k-100k, 0.3% for AGIs $100k-200k)
Ordinary dividends: $858 (reported on 16.0% of returns)
Here:
$858
State:
$7,410
(% of AGI for various income ranges: 1.7% for AGIs below $25k, 0.2% for AGIs $25k-50k, 0.2% for AGIs $50k-75k, 0.2% for AGIs $75k-100k)
Net capital gain/loss in AGI: +$5,964 (reported on 18.7% of returns)
Here:
+$5,964
State:
+$11,579
(% of AGI for various income ranges: 2.7% for AGIs below $25k, 1.2% for AGIs $25k-50k, 1.6% for AGIs $50k-75k, 8.7% for AGIs $75k-100k)
Profit/loss from business: +$4,485 (reported on 17.3% of returns)
Here:
+$4,485
State:
+$11,688
(% of AGI for various income ranges: 6.5% for AGIs below $25k, 4.8% for AGIs $25k-50k)
Taxable individual retirement arrangement distribution: $8,314 (reported on 9.3% of returns)
65263:
$8,314
Missouri:
$14,773
(% of AGI for various income ranges: 2.4% for AGIs below $25k, 3.0% for AGIs $25k-50k, 4.3% for AGIs $50k-75k)
Total itemized deductions: $17,317 (26% of AGI, reported on 16.0% of returns)
Here:
$17,317
State:
$22,730
Here:
25.6% of AGI
State:
19.2% of AGI
(% of AGI for various income ranges: 15.2% for AGIs $25k-50k, 9.7% for AGIs $75k-100k, 8.5% for AGIs $100k-200k)
Charity contributions: $3,471 (reported on 9.3% of returns)
Here:
$3,471
State:
$4,745
Taxes paid: $4,225 (reported on 16.0% of returns)
65263:
$4,225
State:
$8,399
(% of AGI for various income ranges: 2.6% for AGIs $25k-50k, 2.1% for AGIs $75k-100k, 3.9% for AGIs $100k-200k)
Earned income credit: $1,993 (reported on 20.0% of returns)
Here:
$1,993
State:
$2,288
(% of AGI for various income ranges: 4.8% for AGIs below $25k, 1.6% for AGIs $25k-50k)
Percentage of individuals using paid preparers for their 2012 taxes: 70.7%
Here:
71%
State:
55%
(% for various income ranges: 66.7% for AGIs below $25k, 70.0% for AGIs $25k-50k, 72.7% for AGIs $50k-75k, 85.7% for AGIs $75k-100k, 75.0% for AGIs $100k-200k)
Averages for the 2004 tax year for zip code 65263, filed in 2005:
Average Adjusted Gross Income (AGI) in 2004: $30,997 (Individual Income Tax Returns)
Here:
$30,997
State:
$44,591
Salary/wage: $29,397 (reported on 82.6% of returns)
Here:
$29,397
State:
$38,941
(% of AGI for various income ranges: 104.6% for AGIs below $10k, 76.0% for AGIs $10k-25k, 82.5% for AGIs $25k-50k, 81.1% for AGIs $50k-75k, 76.0% for AGIs $75k-100k, 56.1% for AGIs over 100k)
Taxable interest for individuals: $1,006 (reported on 41.7% of returns)
This zip code:
$1,006
Missouri:
$1,801
(% of AGI for various income ranges: 9.3% for AGIs below $10k, 2.4% for AGIs $10k-25k, 1.0% for AGIs $25k-50k, 1.0% for AGIs $50k-75k, 0.6% for AGIs $75k-100k, 0.4% for AGIs over 100k)
Taxable dividends: $615 (reported on 18.7% of returns)
Here:
$615
State:
$3,677
(% of AGI for various income ranges: 5.6% for AGIs below $10k, 0.4% for AGIs $10k-25k, 0.1% for AGIs $25k-50k, 0.1% for AGIs $50k-75k, 1.0% for AGIs $75k-100k)
Net capital gain/loss: +$5,755 (reported on 19.3% of returns)
Here:
+$5,755
State:
+$8,915
(% of AGI for various income ranges: 0.5% for AGIs below $10k, 0.7% for AGIs $10k-25k, 1.5% for AGIs $25k-50k, 5.5% for AGIs $50k-75k, 15.6% for AGIs $75k-100k)
Profit/loss from business: +$4,654 (reported on 17.8% of returns)
Here:
+$4,654
State:
+$9,793
(% of AGI for various income ranges: 10.6% for AGIs below $10k, 4.6% for AGIs $10k-25k, 3.9% for AGIs $25k-50k, 1.0% for AGIs $50k-75k)
Total itemized deductions: $13,963 (28% of AGI, reported on 14.0% of returns)
Here:
$13,963
State:
$18,261
Here:
28.5% of AGI
State:
20.5% of AGI
(% of AGI for various income ranges: 7.2% for AGIs $10k-25k, 5.8% for AGIs $25k-50k, 7.0% for AGIs $50k-75k, 12.7% for AGIs $75k-100k)
Charity contributions deductions: $2,390 (5% of AGI, reported on 10.1% of returns)
Here:
$2,390
State:
$3,665
Here:
4.6% of AGI
State:
3.9% of AGI
(% of AGI for various income ranges: 0.9% for AGIs $10k-25k, 0.7% for AGIs $25k-50k, 0.9% for AGIs $50k-75k, 1.6% for AGIs $75k-100k)
Total tax: $3,313 (reported on 70.0% of returns)
65263:
$3,313
State:
$6,999
(% of AGI for various income ranges: 4.2% for AGIs below $10k, 4.0% for AGIs $10k-25k, 6.2% for AGIs $25k-50k, 7.4% for AGIs $50k-75k, 12.0% for AGIs $75k-100k, 14.8% for AGIs over 100k)
Earned income credit: $1,579 (reported on 18.3% of returns)
Here:
$1,579
State:
$1,728
Percentage of individuals using paid preparers for their 2004 taxes: 74.4%
Here:
74%
State:
62%
(% for various income ranges: 67.3% for AGIs below $10k, 79.4% for AGIs $10k-25k, 74.2% for AGIs $25k-50k, 72.0% for AGIs $50k-75k, 73.1% for AGIs $75k-100k, 92.9% for AGIs over 100k)
Household received Food Stamps/SNAP in the past 12 months: 21 Household did not receive Food Stamps/SNAP in the past 12 months: 548
Women who had a birth in the past 12 months: 19 (9 now married, 10 unmarried) Women who did not have a birth in the past 12 months: 263 (111 now married, 151 unmarried)
Housing units in zip code 65263 with a mortgage: 159 (5 second mortgage, 5 both second mortgage and home equity loan) Median monthly owner costs for units with a mortgage: $929 Median monthly owner costs for units without a mortgage: $391
Residents with income below the poverty level in 2022:
This zip code:
19.8%
Whole state:
13.2%
Residents with income below 50% of the poverty level in 2022:
This zip code:
14.2%
Whole state:
6.8%
Median number of rooms in houses and condos:
Here:
5.9
State:
6.4
Median number of rooms in apartments:
Here:
4.5
State:
4.4
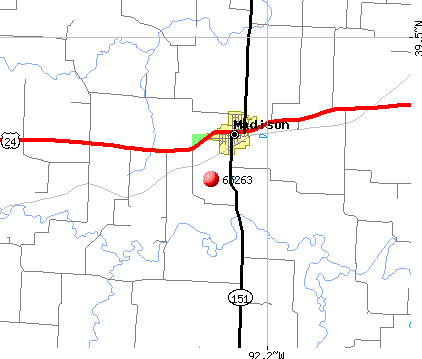
Notable locations in this zip code not listed on our city pages
Churches in zip code 65263 include: Hickory Grove Church (A), Mount Pleasant Church (B), Oak Grove Church (C), Pleasant Green Church (D). Display/hide their locations on the map
Cemeteries: Dunaway Cemetery (1), Hughes Cemetery (2), Old Prairie Cemetery (3), Atterberry Cemetery (4), Sunset Hill Cemetery (5), Swindell Cemetery (6), Capp Cemetery (7). Display/hide their locations on the map
Streams, rivers, and creeks: Coon Creek (A), Pedee Branch (B), Bee Branch (C), Bear Branch (D), Baker Branch (E), Allen Creek (F), Mud Creek (G), Reese Fork (H), Hardin Creek (I). Display/hide their locations on the map
In group quarters: 34 (-1 institutionalized population)
Size of family households: 178 2-persons, 91 3-persons, 44 4-persons, 22 5-persons, 8 6-persons, 16 7-or-more-persons
Size of nonfamily households: 193 1-person, 14 2-persons
165 married couples with children.
54 single-parent households (3 men, 51 women).
97.2% of residents of 65263 zip code speak English at home.
1.3% of residents speak Spanish at home (58% very well, 42% well).
1.7% of residents speak other Indo-European language at home (100% very well).
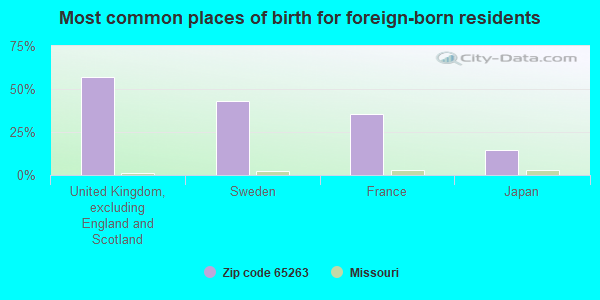
Foreign born population: 14 (1.0%) (100.0% of them are naturalized citizens)
This zip code:
1.0%
Whole state:
4.1%
57%United Kingdom, excluding England and Scotland
43%Sweden
36%France
14%Japan
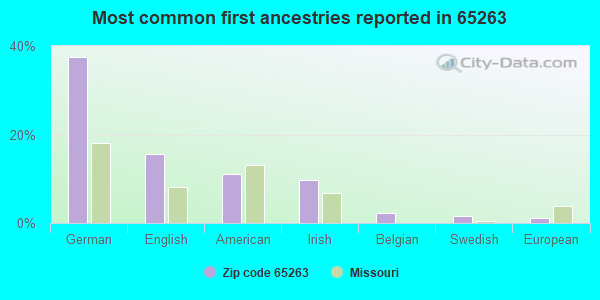
38%German
16%English
11%American
10%Irish
2%Belgian
1%Swedish
1%European
Year of entry for the foreign-born population
02010 or later
122000 to 2009
01990 to 1999
6Before 1990
Facilities with environmental interests located in this zip code:
C & D FARM SUPPLY INC (207 S. MAIN in MADISON, MO)
STATE MASTER (Missouri monitoring and compilance) - PCS-MOR240534, NPDES NON-MAJOR National Pollutant Discharge Elimination System NON-MAJOR (Tracking pollutant discharge elimination systems) - permit Business SIC classification: FARM SUPPLIES Alternative names: C & D FARM SUPPLY-DRY PLA
JAMES ROSLIEN (13429 ROUTE YY in MADISON, MO)
National Pollutant Discharge Elimination System NON-MAJOR (Tracking pollutant discharge elimination systems) - permit National Pollutant Discharge Elimination System NON-MAJOR (Tracking pollutant discharge elimination systems) - permit Business SIC classification: HOGS; HEAVY CONSTRUCTION
C & D FARM SUPPLY (AKA MADISON FEED & SUPPLY) (201 SOUTH MAIN STREET in MADISON, MO)
STATE MASTER (Missouri monitoring and compilance) - NCDB-I07#19861126MO-0217, COMPLIANCE ACTIVITY COMPLIANCE ACTIVITY (Tracking inspections of insecticide, fungicide, and rodenticide, and toxic substances) Alternative names: C & D FARM SUPPLY-DRY PLA, C & D FARM SUPPLY-LIQUID
Housing units lacking complete plumbing facilities: 4.0% Housing units lacking complete kitchen facilities: 1.4%
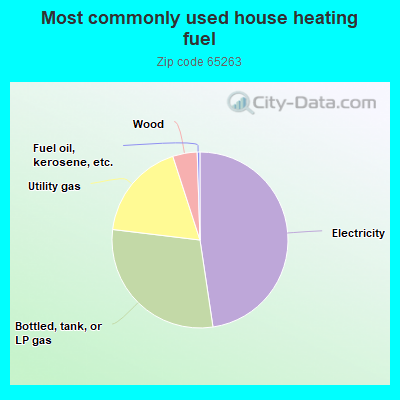
47.7%Electricity
29.3%Bottled, tank, or LP gas
18.1%Utility gas
4.5%Wood
0.5%Fuel oil, kerosene, etc.
Population in 1990: 2,000.
Place of birth for U.S.-born residents:
This state: 1,110
Northeast: 22
Midwest: 220
South: 72
West: 77
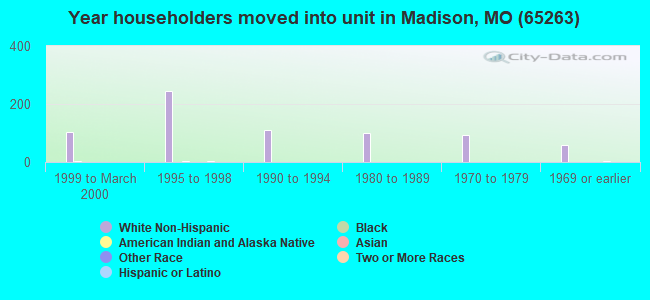
54% of the 65263 zip code residents lived in the same house 5 years ago. Out of people who lived in different houses, 51% lived in this county. Out of people who lived in different counties, 50% lived in Missouri.
96% of the 65263 zip code residents lived in the same house 1 year ago. Out of people who lived in different houses, 11% moved from this county. Out of people who lived in different houses, 74% moved from different county within same state. Out of people who lived in different houses, 26% moved from different state.
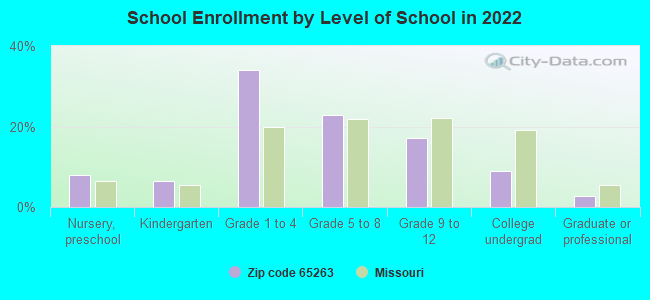
Private vs. public school enrollment:
Students in private schools in grades 1 to 8 (elementary and middle school): 9
Here:
7.8%
Missouri:
15.4%
Students in private schools in grades 9 to 12 (high school): 3
Here:
8.5%
Missouri:
13.9%
Students in private undergraduate colleges:
Here:
4.6%
Missouri:
22.6%
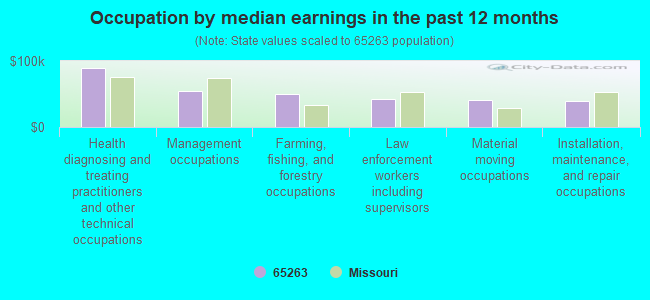
Occupation by median earnings in the past 12 months ($)
89,562Health diagnosing and treating practitioners and other technical occupations
54,540Management occupations
49,915Farming, fishing, and forestry occupations
43,091Law enforcement workers including supervisors
41,649Material moving occupations
40,013Installation, maintenance, and repair occupations
Top industries in this zip code by the number of employees in 2005:
Health Care and Social Assistance: Nursing Care Facilities (10-19: 1)
Other Services (except Public Administration): Religious Organizations (1-4: 4)
Accommodation and Food Services: Full-Service Restaurants (5-9: 1)
Construction: Water and Sewer Line and Related Structures Construction (1-4: 1)
Other Services (except Public Administration): Beauty Salons (1-4: 1)
Health Care and Social Assistance: Other Community Housing Services (1-4: 1)
People in group quarters in 2000:
26 people in nursing homes
Fatal accident statistics in 2014:
Fatal accident count: 1
Vehicles involved in fatal accidents: 1
Fatal accidents caused by drunken drivers: 0
Fatalities: 1
Persons involved in fatal accidents: 1
Pedestrians involved in fatal accidents: 0
Fatal accident statistics in 2011:
Fatal accident count: 1
Vehicles involved in fatal accidents: 1
Fatal accidents caused by drunken drivers: 0
Fatalities: 1
Persons involved in fatal accidents: 1
Pedestrians involved in fatal accidents: 0
2002 - 2018 National Fire Incident Reporting System (NFIRS) incidents
According to the data from the years 2002 - 2018 the average number of fire incidents per year is 6. The highest number of reported fires - 36 took place in 2007, and the least - 0 in 2003. The data has a growing trend.
When looking into fire subcategories, the most incidents belonged to: Outside Fires (51.5%), and Structure Fires (39.8%).
Fire incident types reported to NFIRS in Zip Code 65263

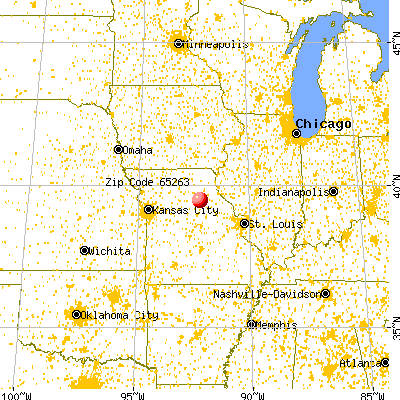


 Nearest zip codes: 65258, 65270, 65260, 63450, 65239, 65278.
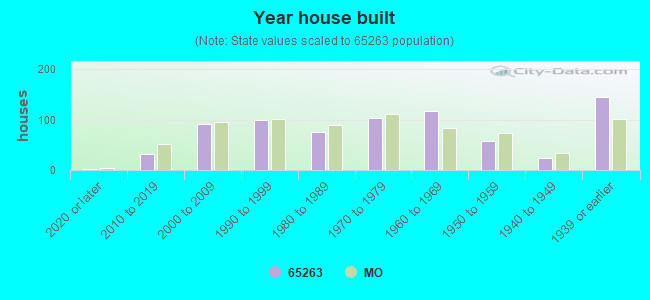


 According to the data from the years 2002 - 2018 the average number of fire incidents per year is 6. The highest number of reported fires - 36 took place in 2007, and the least - 0 in 2003. The data has a growing trend.
 When looking into fire subcategories, the most incidents belonged to: Outside Fires (51.5%), and Structure Fires (39.8%).