Estimated zip code population in 2022: 1,910 Zip code population in 2010: 1,822 Zip code population in 2000: 1,564
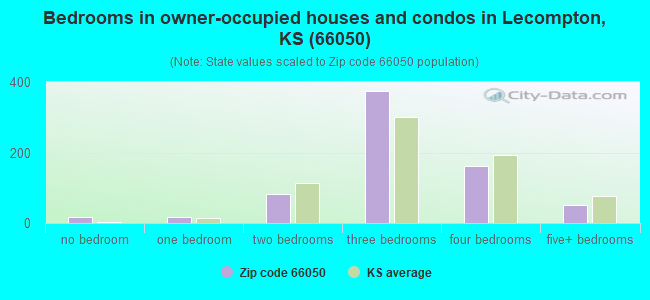
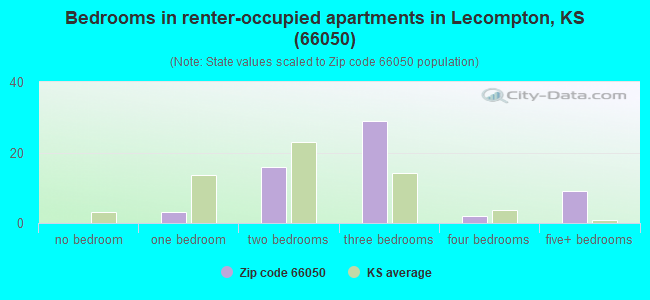
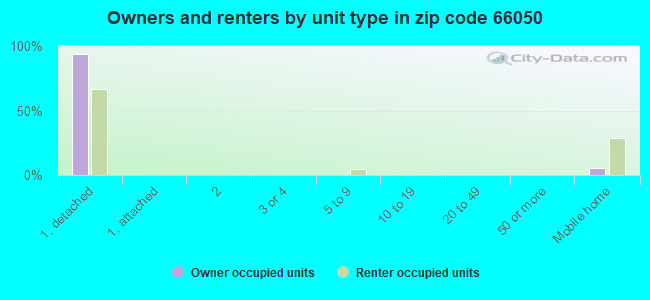
Houses and condos: 812 Renter-occupied apartments: 59
% of renters here:
8%
State:
32%
March 2022 cost of living index in zip code 66050: 80.3 (low, U.S. average is 100)
Land area: 43.2 sq. mi. Water area: 0.6 sq. mi.
Population density: 44 people per square mile
(very low).
OSM Map
General Map
Google Map
MSN Map
OSM Map
General Map
Google Map
MSN Map
OSM Map
General Map
Google Map
MSN Map
OSM Map
General Map
Google Map
MSN Map
Please wait while loading the map...
Real estate property taxes paid for housing units in 2022:
This zip code:
1.2% ($3,001)
Kansas:
1.2% ($2,578)
Median real estate property taxes paid for housing units with mortgages in 2022: $3,045 (1.1%) Median real estate property taxes paid for housing units with no mortgage in 2022: $2,915 (1.4%)
Business Search- 14 Million verified businesses
Males: 956
(50.0%)
Females: 954
(50.0%)
For population 25 years and over in 66050:
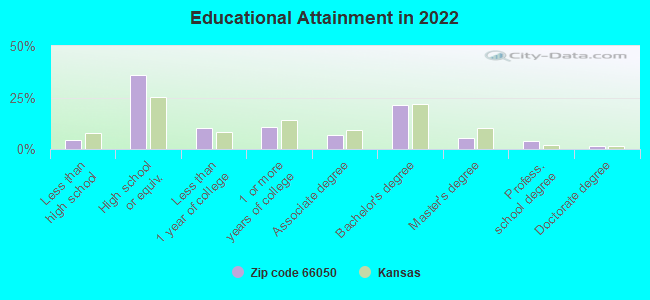
High school or higher: 94.9%
Bachelor's degree or higher: 31.9%
Graduate or professional degree: 10.8%
Unemployed: 4.6%
Mean travel time to work (commute): 31.2 minutes
For population 15 years and over in 66050:
Never married: 20.2%
Now married: 61.9%
Separated: 0.7%
Widowed: 6.0%
Divorced: 11.3%
Zip code 66050 compared to state average:
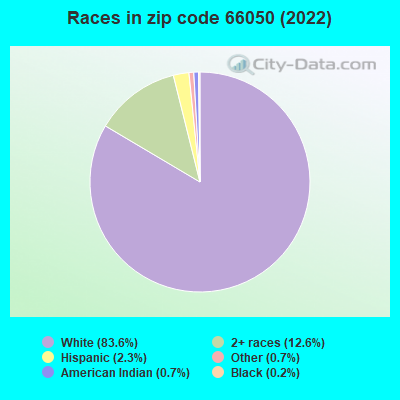
Black race population percentage significantly below state average.
Hispanic race population percentage significantly below state average.
Median age significantly above state average.
Foreign-born population percentage significantly below state average.
Renting percentage significantly below state average.
Length of stay since moving in significantly above state average.
Number of college students significantly below state average.
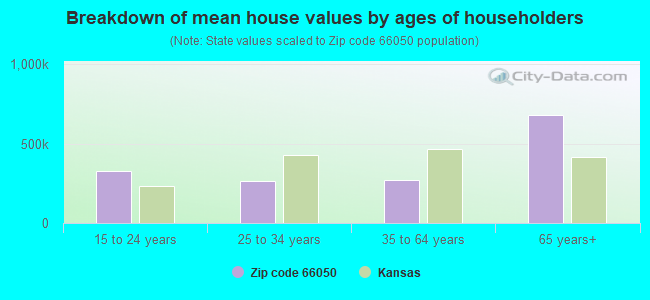
Estimated median house/condo value in 2022: $252,329
66050:
$252,329
Kansas:
$206,600
According to our research of Kansas and other state lists, there were 3 registered sex offenders living in 66050 zip code as of June 16, 2024. The ratio of all residents to sex offenders in zip code 66050 is 682 to 1. The ratio of registered sex offenders to all residents in this zip code is much lower than the state average.
Median resident age:
This zip code:
48.8 years
Kansas median age:
37.6 years
Average household size:
This zip code:
2.6 people
Kansas:
2.4 people
Averages for the 2020 tax year for zip code 66050, filed in 2021:
Average Adjusted Gross Income (AGI) in 2020: $68,173 (Individual Income Tax Returns)
Here:
$68,173
State:
$72,721
Salary/wage: $59,439 (reported on 75.8% of returns)
Here:
$59,439
State:
$58,641
(% of AGI for various income ranges: 1123.5% for AGIs below $25k, 3652.1% for AGIs $25k-50k, 6901.0% for AGIs $50k-75k, 9470.0% for AGIs $75k-100k, 12908.0% for AGIs $100k-200k)
Taxable interest for individuals: $1,168 (reported on 37.4% of returns)
This zip code:
$1,168
Kansas:
$1,625
(% of AGI for various income ranges: 57.6% for AGIs below $25k, 60.7% for AGIs $25k-50k, 69.0% for AGIs $50k-75k, 52.0% for AGIs $75k-100k, 68.0% for AGIs $100k-200k)
Ordinary dividends: $4,918 (reported on 24.2% of returns)
Here:
$4,918
State:
$7,290
(% of AGI for various income ranges: 33.5% for AGIs below $25k, 60.7% for AGIs $25k-50k, 103.0% for AGIs $50k-75k, 180.0% for AGIs $75k-100k, 154.0% for AGIs $100k-200k)
Net capital gain/loss in AGI: +$13,760 (reported on 22.0% of returns)
Here:
+$13,760
State:
+$20,511
(% of AGI for various income ranges: 24.7% for AGIs below $25k, 56.4% for AGIs $25k-50k, 67.0% for AGIs $50k-75k, 332.0% for AGIs $75k-100k, 423.0% for AGIs $100k-200k)
Profit/loss from business: +$5,731 (reported on 17.6% of returns)
Here:
+$5,731
State:
+$13,852
(% of AGI for various income ranges: 92.4% for AGIs below $25k, 134.3% for AGIs $25k-50k, 140.0% for AGIs $50k-75k, 582.0% for AGIs $75k-100k, 66.0% for AGIs $100k-200k)
Taxable individual retirement arrangement distribution: $14,033 (reported on 16.5% of returns)
66050:
$14,033
Kansas:
$19,921
(% of AGI for various income ranges: 166.5% for AGIs below $25k, 204.3% for AGIs $25k-50k, 601.0% for AGIs $50k-75k, 935.0% for AGIs $100k-200k)
Total itemized deductions: $42,133 (reported on 6.6% of returns)
Here:
$42,133
State:
$36,939
(% of AGI for various income ranges: 330.0% for AGIs below $25k, 833.0% for AGIs $100k-200k)
Charity contributions: $20,160 (reported on 5.5% of returns)
Here:
$20,160
State:
$15,443
(% of AGI for various income ranges: 1008.0% for AGIs $100k-200k)
Taxes paid: $9,350 (reported on 6.6% of returns)
66050:
$9,350
State:
$8,001
(% of AGI for various income ranges: 79.4% for AGIs below $25k, 226.0% for AGIs $100k-200k)
Earned income credit: $2,040 (reported on 11.0% of returns)
Here:
$2,040
State:
$2,267
(% of AGI for various income ranges: 75.9% for AGIs below $25k, 53.6% for AGIs $25k-50k)
Percentage of individuals using paid preparers for their 2020 taxes: 93.4%
Here:
93%
State:
95%
(% for various income ranges: 92.6% for AGIs below $25k, 95.0% for AGIs $25k-50k, 93.8% for AGIs $50k-75k, 88.9% for AGIs $75k-100k, 92.9% for AGIs $100k-200k, 100.0% for AGIs over 200k)
Averages for the 2012 tax year for zip code 66050, filed in 2013:
Average Adjusted Gross Income (AGI) in 2012: $56,874 (Individual Income Tax Returns)
Here:
$56,874
State:
$60,095
Salary/wage: $46,654 (reported on 82.8% of returns)
Here:
$46,654
State:
$48,770
(% of AGI for various income ranges: 63.8% for AGIs below $25k, 70.1% for AGIs $25k-50k, 68.6% for AGIs $50k-75k, 80.1% for AGIs $75k-100k, 96.3% for AGIs $100k-200k)
Taxable interest for individuals: $1,279 (reported on 37.9% of returns)
This zip code:
$1,279
Kansas:
$1,506
(% of AGI for various income ranges: 1.9% for AGIs below $25k, 1.6% for AGIs $25k-50k, 0.6% for AGIs $50k-75k, 1.2% for AGIs $75k-100k, 0.6% for AGIs $100k-200k)
Ordinary dividends: $3,810 (reported on 24.1% of returns)
Here:
$3,810
State:
$6,093
(% of AGI for various income ranges: 1.6% for AGIs below $25k, 0.6% for AGIs $25k-50k, 1.7% for AGIs $50k-75k, 1.1% for AGIs $75k-100k, 3.3% for AGIs $100k-200k)
Net capital gain/loss in AGI: +$9,382 (reported on 19.5% of returns)
Here:
+$9,382
State:
+$14,598
(% of AGI for various income ranges: 0.7% for AGIs below $25k, 0.7% for AGIs $25k-50k, 0.2% for AGIs $50k-75k, 2.0% for AGIs $75k-100k, 10.0% for AGIs $100k-200k)
Profit/loss from business: +$6,650 (reported on 16.1% of returns)
Here:
+$6,650
State:
+$12,554
(% of AGI for various income ranges: 8.1% for AGIs below $25k, 2.7% for AGIs $25k-50k, 4.1% for AGIs $50k-75k, 0.4% for AGIs $100k-200k)
Taxable individual retirement arrangement distribution: $11,777 (reported on 14.9% of returns)
66050:
$11,777
Kansas:
$14,098
(% of AGI for various income ranges: 5.3% for AGIs below $25k, 4.3% for AGIs $25k-50k, 7.8% for AGIs $50k-75k, 2.1% for AGIs $100k-200k)
Total itemized deductions: $23,103 (24% of AGI, reported on 35.6% of returns)
Here:
$23,103
State:
$23,678
Here:
24.2% of AGI
State:
18.9% of AGI
(% of AGI for various income ranges: 14.6% for AGIs below $25k, 8.9% for AGIs $25k-50k, 12.8% for AGIs $50k-75k, 14.6% for AGIs $75k-100k, 26.6% for AGIs $100k-200k)
Charity contributions: $6,100 (reported on 28.7% of returns)
Here:
$6,100
State:
$5,321
(% of AGI for various income ranges: 1.4% for AGIs $25k-50k, 1.1% for AGIs $50k-75k, 1.9% for AGIs $75k-100k, 8.7% for AGIs $100k-200k)
Taxes paid: $7,600 (reported on 35.6% of returns)
66050:
$7,600
State:
$9,548
(% of AGI for various income ranges: 2.1% for AGIs below $25k, 2.1% for AGIs $25k-50k, 3.9% for AGIs $50k-75k, 5.1% for AGIs $75k-100k, 9.9% for AGIs $100k-200k)
Earned income credit: $1,900 (reported on 13.8% of returns)
Here:
$1,900
State:
$2,212
(% of AGI for various income ranges: 4.7% for AGIs below $25k, 0.8% for AGIs $25k-50k)
Percentage of individuals using paid preparers for their 2012 taxes: 52.9%
Here:
53%
State:
56%
(% for various income ranges: 44.8% for AGIs below $25k, 52.4% for AGIs $25k-50k, 60.0% for AGIs $50k-75k, 50.0% for AGIs $75k-100k, 80.0% for AGIs $100k-200k)
Averages for the 2004 tax year for zip code 66050, filed in 2005:
Average Adjusted Gross Income (AGI) in 2004: $48,345 (Individual Income Tax Returns)
Here:
$48,345
State:
$45,726
Salary/wage: $44,089 (reported on 83.5% of returns)
Here:
$44,089
State:
$40,112
(% of AGI for various income ranges: 133.9% for AGIs below $10k, 72.0% for AGIs $10k-25k, 77.6% for AGIs $25k-50k, 83.7% for AGIs $50k-75k, 80.3% for AGIs $75k-100k, 66.2% for AGIs over 100k)
Taxable interest for individuals: $1,507 (reported on 48.7% of returns)
This zip code:
$1,507
Kansas:
$1,749
(% of AGI for various income ranges: 15.1% for AGIs below $10k, 4.9% for AGIs $10k-25k, 1.5% for AGIs $25k-50k, 1.2% for AGIs $50k-75k, 1.5% for AGIs $75k-100k, 0.6% for AGIs over 100k)
Taxable dividends: $3,167 (reported on 24.1% of returns)
Here:
$3,167
State:
$3,066
(% of AGI for various income ranges: 3.4% for AGIs below $10k, 1.3% for AGIs $10k-25k, 1.0% for AGIs $25k-50k, 1.0% for AGIs $50k-75k, 0.7% for AGIs $75k-100k, 2.8% for AGIs over 100k)
Net capital gain/loss: +$6,180 (reported on 19.9% of returns)
Here:
+$6,180
State:
+$7,555
(% of AGI for various income ranges: -3.2% for AGIs below $10k, 0.6% for AGIs $10k-25k, 0.5% for AGIs $25k-50k, 0.3% for AGIs $50k-75k, 0.1% for AGIs $75k-100k, 7.4% for AGIs over 100k)
Profit/loss from business: +$4,396 (reported on 17.2% of returns)
Here:
+$4,396
State:
+$9,571
(% of AGI for various income ranges: -10.0% for AGIs below $10k, 8.4% for AGIs $10k-25k, 4.4% for AGIs $25k-50k, 1.2% for AGIs $50k-75k, 1.4% for AGIs $75k-100k, -1.1% for AGIs over 100k)
IRA payment deduction: $2,118 (reported on 2.0% of returns)
66050:
$2,118
Kansas:
$2,922
Total itemized deductions: $18,792 (22% of AGI, reported on 34.4% of returns)
Here:
$18,792
State:
$18,779
Here:
21.9% of AGI
State:
20.5% of AGI
(% of AGI for various income ranges: 13.9% for AGIs $10k-25k, 8.5% for AGIs $25k-50k, 12.6% for AGIs $50k-75k, 17.0% for AGIs $75k-100k, 16.0% for AGIs over 100k)
Charity contributions deductions: $4,725 (5% of AGI, reported on 28.5% of returns)
Here:
$4,725
State:
$3,892
Here:
5.2% of AGI
State:
4.0% of AGI
(% of AGI for various income ranges: 1.4% for AGIs $10k-25k, 1.2% for AGIs $25k-50k, 1.3% for AGIs $50k-75k, 2.5% for AGIs $75k-100k, 5.6% for AGIs over 100k)
Total tax: $6,799 (reported on 79.1% of returns)
66050:
$6,799
State:
$7,203
(% of AGI for various income ranges: 3.4% for AGIs below $10k, 4.7% for AGIs $10k-25k, 6.5% for AGIs $25k-50k, 7.7% for AGIs $50k-75k, 10.1% for AGIs $75k-100k, 18.9% for AGIs over 100k)
Earned income credit: $1,531 (reported on 11.1% of returns)
Here:
$1,531
State:
$1,674
Percentage of individuals using paid preparers for their 2004 taxes: 59.0%
Here:
59%
State:
63%
(% for various income ranges: 51.6% for AGIs below $10k, 55.6% for AGIs $10k-25k, 58.4% for AGIs $25k-50k, 64.7% for AGIs $50k-75k, 63.6% for AGIs $75k-100k, 68.2% for AGIs over 100k)
Household received Food Stamps/SNAP in the past 12 months: 27 Household did not receive Food Stamps/SNAP in the past 12 months: 722
Women who had a birth in the past 12 months: 32 (17 now married, 14 unmarried) Women who did not have a birth in the past 12 months: 306 (149 now married, 156 unmarried)
Housing units in zip code 66050 with a mortgage: 331 (21 second mortgage, 18 both second mortgage and home equity loan) Houses without a mortgage: 21
Median monthly owner costs for units with a mortgage: $1,891 Median monthly owner costs for units without a mortgage: $675
Residents with income below the poverty level in 2022:
This zip code:
10.5%
Whole state:
12.0%
Residents with income below 50% of the poverty level in 2022:
This zip code:
6.0%
Whole state:
6.4%
Median number of rooms in houses and condos:
Here:
6.5
State:
6.9
Median number of rooms in apartments:
Here:
5.9
State:
4.4
Notable locations in this zip code not listed on our city pages
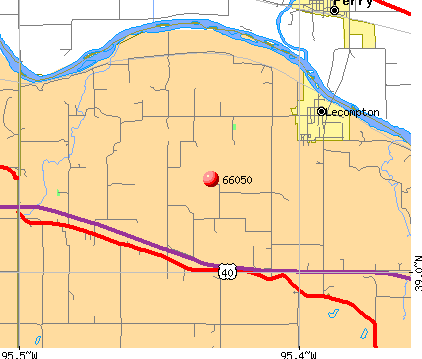
Notable locations in zip code 66050: Lecompton Sewage Treatment Plant (A), KJTY - FM (Topeka) (B), Kansas Territorial Capital - Lane Museum (C), Lecompton Township Fire / Rescue / Emergency Medical Services Station 2 (D), Lecompton Township Fire / Rescue / Emergency Medical Services Station 1 (E). Display/hide their locations on the map
Cemeteries: Maple Grove Cemetery (1), East View - Big Springs Cemetery (2), Saint Peters Cemetery (3), Stull Cemetery (4). Display/hide their locations on the map
Size of family households: 331 2-persons, 38 3-persons, 90 4-persons, 27 5-persons, 47 6-persons
Size of nonfamily households: 190 1-person, 25 2-persons, 3 3-persons
277 married couples with children.
66 single-parent households (11 men, 55 women).
98.6% of residents of 66050 zip code speak English at home.
0.9% of residents speak Spanish at home (100% very well).
0.4% of residents speak Asian or Pacific Island language at home (100% not well).
Foreign born population: 0 (0.0%)
:
0.0%
Whole state:
7.1%
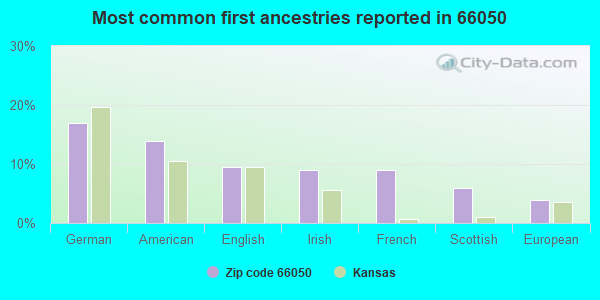
17%German
14%American
9%English
9%Irish
9%French
6%Scottish
4%European
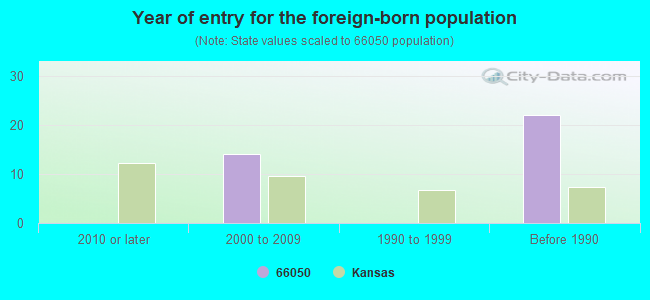
Year of entry for the foreign-born population
02010 or later
142000 to 2009
01990 to 1999
22Before 1990
Facilities with environmental interests located in this zip code:
N.R. HAMM QUARRY, INC. (S3-T13S-R18E in LECOMPTON, KS)
AIR SYNTHETIC MINOR (AIRS/AFS) STATE MASTER (Kansas Facility Profiler) - ISTEPS-04500038, AIR MINOR CRITERIA AND HAZARDOUS AIR POLLUTANT INVENTORY (Inventory of air pollution sources) Business SIC and NAICS classification: CRUSHED AND BROKEN LIMESTONE
LECOMPTON ELEM (626 WHITFIELD ST in LECOMPTON, KS)
(National Center for Education Statistics) - STATE ID-4022 Organizations: PERRY PUBLIC SCHOOLS (SCHOOL DISTRICT)
BUD NEWELL ASSOC (W EDGE OF BIG SPRING N SIDE in LECOMPTON, KS)
(Resource Conservation and Recovery Act (tracking hazardous waste))
LECOMPTON CITY OF STP (333 ELMORE STREET in LECOMPTON, KS)
National Pollutant Discharge Elimination System NON-MAJOR (Tracking pollutant discharge elimination systems) - permit Business SIC classification: SEWERAGE SYSTEMS Organizations: LECOMPTON WASTEWATER PLANT (CONTACT/OWNER)
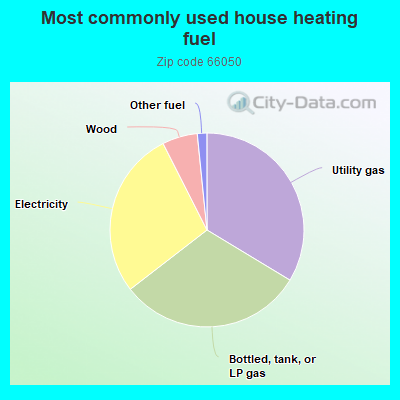
33.8%Utility gas
31.0%Bottled, tank, or LP gas
28.1%Electricity
5.9%Wood
1.6%Other fuel
Population in 1990: 2,701.
Place of birth for U.S.-born residents:
This state: 1,240
Northeast: 34
Midwest: 330
South: 130
West: 133
65% of the 66050 zip code residents lived in the same house 5 years ago. Out of people who lived in different houses, 57% lived in this county. Out of people who lived in different counties, 50% lived in Kansas.
98% of the 66050 zip code residents lived in the same house 1 year ago. Out of people who lived in different houses, 120% moved from this county.
Private vs. public school enrollment:
Students in private schools in grades 1 to 8 (elementary and middle school): 10
Here:
5.6%
Kansas:
14.1%
Students in private schools in grades 9 to 12 (high school): 1
Here:
1.4%
Kansas:
10.8%
Students in private undergraduate colleges: 6
Here:
26.4%
Kansas:
15.4%
Occupation by median earnings in the past 12 months ($)
107,623Architecture and engineering occupations
71,432Production occupations
65,656Business and financial operations occupations
63,925Health diagnosing and treating practitioners and other technical occupations
58,463Management occupations
54,875Education, training, and library occupations
Top industries in this zip code by the number of employees in 2005:
Construction: New Single-Family Housing Construction (except Operative Builders) (5-9 employees: 2 establishments, 1-4 employees: 2 establishments)
Mining: Crushed and Broken Limestone Mining and Quarrying (10-19: 1)
Construction: Electrical Contractors (10-19: 1)
Construction: Commercial and Institutional Building Construction (10-19: 1)
Wholesale Trade: Motor Vehicle Supplies and New Parts Merchant Wholesalers (5-9: 1)
Administrative and Support and Waste Management and Remediation Services: Carpet and Upholstery Cleaning Services (5-9: 1)
Finance and Insurance: Insurance Agencies and Brokerages (1-4: 1)
Health Care and Social Assistance: Child Day Care Services (1-4: 1)
Health Care and Social Assistance: All Other Miscellaneous Ambulatory Health Care Services (1-4: 1)
Fatal accident statistics in 2012:
Fatal accident count: 1
Vehicles involved in fatal accidents: 1
Fatal accidents caused by drunken drivers: 1
Fatalities: 1
Persons involved in fatal accidents: 6
Pedestrians involved in fatal accidents: 0
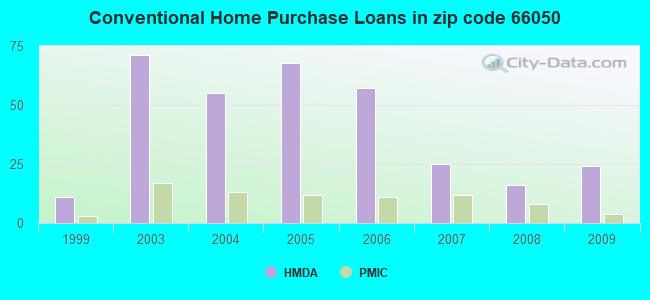
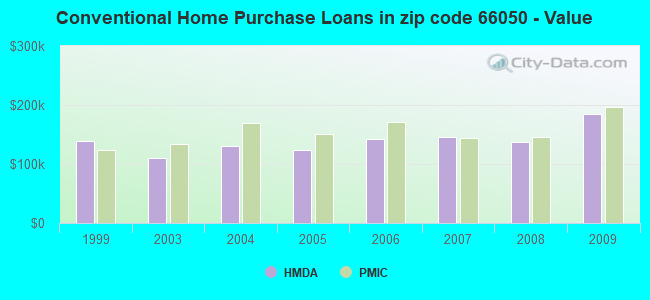
Home Mortgage Disclosure Act Aggregated Statistics For Year 2009 (Based on 2 partial tracts)
A) FHA, FSA/RHS & VA Home Purchase Loans
B) Conventional Home Purchase Loans
C) Refinancings
D) Home Improvement Loans
F) Non-occupant Loans on < 5 Family Dwellings (A B C & D)
G) Loans On Manufactured Home Dwelling (A B C & D)
Number
Average Value
Number
Average Value
Number
Average Value
Number
Average Value
Number
Average Value
Number
Average Value
LOANS ORIGINATED
21
$152,552
24
$185,203
88
$172,891
1
$14,630
7
$142,543
1
$13,300
APPLICATIONS APPROVED, NOT ACCEPTED
1
$182,260
3
$173,397
8
$156,489
1
$30,600
0
$0
0
$0
APPLICATIONS DENIED
3
$122,840
7
$152,996
28
$163,924
1
$143,680
1
$337,920
1
$14,630
APPLICATIONS WITHDRAWN
4
$135,700
3
$134,813
15
$171,355
0
$0
0
$0
0
$0
FILES CLOSED FOR INCOMPLETENESS
0
$0
3
$80,710
1
$126,390
0
$0
0
$0
1
$14,630
Aggregated Statistics For Year 2008 (Based on 2 partial tracts)
A) FHA, FSA/RHS & VA Home Purchase Loans
B) Conventional Home Purchase Loans
C) Refinancings
D) Home Improvement Loans
F) Non-occupant Loans on < 5 Family Dwellings (A B C & D)
G) Loans On Manufactured Home Dwelling (A B C & D)
Number
Average Value
Number
Average Value
Number
Average Value
Number
Average Value
Number
Average Value
Number
Average Value
LOANS ORIGINATED
4
$145,680
16
$137,946
67
$130,756
12
$39,912
7
$81,534
3
$75,833
APPLICATIONS APPROVED, NOT ACCEPTED
1
$210,200
4
$124,060
8
$86,642
0
$0
0
$0
0
$0
APPLICATIONS DENIED
0
$0
7
$55,497
24
$152,830
3
$5,320
1
$30,600
3
$65,190
APPLICATIONS WITHDRAWN
0
$0
3
$64,303
12
$120,290
0
$0
0
$0
0
$0
FILES CLOSED FOR INCOMPLETENESS
0
$0
0
$0
3
$96,677
0
$0
0
$0
0
$0
Aggregated Statistics For Year 2007 (Based on 2 partial tracts)
A) FHA, FSA/RHS & VA Home Purchase Loans
B) Conventional Home Purchase Loans
C) Refinancings
D) Home Improvement Loans
F) Non-occupant Loans on < 5 Family Dwellings (A B C & D)
G) Loans On Manufactured Home Dwelling (A B C & D)
Number
Average Value
Number
Average Value
Number
Average Value
Number
Average Value
Number
Average Value
Number
Average Value
LOANS ORIGINATED
4
$121,400
25
$146,238
73
$104,865
15
$73,261
11
$98,813
3
$59,867
APPLICATIONS APPROVED, NOT ACCEPTED
1
$164,970
1
$30,600
4
$124,725
0
$0
0
$0
1
$164,970
APPLICATIONS DENIED
3
$112,197
3
$192,463
41
$155,689
11
$59,505
0
$0
4
$87,475
APPLICATIONS WITHDRAWN
0
$0
1
$212,860
19
$136,611
1
$79,820
0
$0
0
$0
FILES CLOSED FOR INCOMPLETENESS
0
$0
4
$149,670
11
$280,835
0
$0
1
$85,150
0
$0
Aggregated Statistics For Year 2006 (Based on 2 partial tracts)
A) FHA, FSA/RHS & VA Home Purchase Loans
B) Conventional Home Purchase Loans
C) Refinancings
D) Home Improvement Loans
F) Non-occupant Loans on < 5 Family Dwellings (A B C & D)
G) Loans On Manufactured Home Dwelling (A B C & D)
Number
Average Value
Number
Average Value
Number
Average Value
Number
Average Value
Number
Average Value
Number
Average Value
LOANS ORIGINATED
3
$133,483
57
$142,096
76
$121,381
21
$42,193
11
$124,695
12
$98,893
APPLICATIONS APPROVED, NOT ACCEPTED
0
$0
5
$136,232
8
$126,554
0
$0
0
$0
0
$0
APPLICATIONS DENIED
1
$170,290
5
$110,690
51
$145,014
3
$17,740
4
$139,360
9
$69,329
APPLICATIONS WITHDRAWN
1
$192,910
11
$152,028
25
$160,446
5
$118,140
4
$114,748
0
$0
FILES CLOSED FOR INCOMPLETENESS
0
$0
1
$239,470
5
$199,826
0
$0
1
$164,970
0
$0
Aggregated Statistics For Year 2005 (Based on 2 partial tracts)
A) FHA, FSA/RHS & VA Home Purchase Loans
B) Conventional Home Purchase Loans
C) Refinancings
D) Home Improvement Loans
F) Non-occupant Loans on < 5 Family Dwellings (A B C & D)
G) Loans On Manufactured Home Dwelling (A B C & D)
Number
Average Value
Number
Average Value
Number
Average Value
Number
Average Value
Number
Average Value
Number
Average Value
LOANS ORIGINATED
5
$165,768
68
$122,905
96
$147,771
11
$48,136
16
$78,078
8
$59,369
APPLICATIONS APPROVED, NOT ACCEPTED
0
$0
8
$89,136
27
$104,510
3
$26,607
0
$0
3
$42,573
APPLICATIONS DENIED
0
$0
9
$90,023
71
$139,598
5
$30,866
0
$0
8
$78,992
APPLICATIONS WITHDRAWN
0
$0
8
$191,578
32
$216,148
3
$33,260
3
$99,780
0
$0
FILES CLOSED FOR INCOMPLETENESS
0
$0
3
$231,933
19
$139,622
1
$39,910
0
$0
0
$0
Aggregated Statistics For Year 2004 (Based on 2 partial tracts)
A) FHA, FSA/RHS & VA Home Purchase Loans
B) Conventional Home Purchase Loans
C) Refinancings
D) Home Improvement Loans
F) Non-occupant Loans on < 5 Family Dwellings (A B C & D)
G) Loans On Manufactured Home Dwelling (A B C & D)
Number
Average Value
Number
Average Value
Number
Average Value
Number
Average Value
Number
Average Value
Number
Average Value
LOANS ORIGINATED
1
$202,220
55
$130,428
101
$132,144
17
$30,443
9
$84,998
7
$79,824
APPLICATIONS APPROVED, NOT ACCEPTED
0
$0
5
$208,340
29
$120,103
1
$66,520
0
$0
1
$141,020
APPLICATIONS DENIED
1
$256,770
7
$111,183
52
$104,488
12
$62,196
3
$88,250
3
$22,173
APPLICATIONS WITHDRAWN
0
$0
5
$116,810
24
$136,976
3
$88,250
3
$90,023
4
$83,150
FILES CLOSED FOR INCOMPLETENESS
0
$0
0
$0
12
$124,503
1
$29,270
0
$0
1
$121,070
Aggregated Statistics For Year 2003 (Based on 2 partial tracts)
A) FHA, FSA/RHS & VA Home Purchase Loans
B) Conventional Home Purchase Loans
C) Refinancings
D) Home Improvement Loans
F) Non-occupant Loans on < 5 Family Dwellings (A B C & D)
Number
Average Value
Number
Average Value
Number
Average Value
Number
Average Value
Number
Average Value
LOANS ORIGINATED
8
$132,708
71
$110,348
204
$118,503
5
$71,576
19
$92,568
APPLICATIONS APPROVED, NOT ACCEPTED
0
$0
4
$321,625
15
$243,641
0
$0
0
$0
APPLICATIONS DENIED
0
$0
11
$60,956
57
$186,139
1
$39,910
4
$97,120
APPLICATIONS WITHDRAWN
0
$0
7
$112,324
24
$146,510
1
$15,960
3
$57,650
FILES CLOSED FOR INCOMPLETENESS
1
$192,910
0
$0
5
$154,326
1
$21,290
1
$175,610
Aggregated Statistics For Year 1999 (Based on 1 partial tract)
A) FHA, FSA/RHS & VA Home Purchase Loans
B) Conventional Home Purchase Loans
C) Refinancings
D) Home Improvement Loans
F) Non-occupant Loans on < 5 Family Dwellings (A B C & D)
Detailed PMIC statistics for the following Tracts:0015.00
2002 - 2018 National Fire Incident Reporting System (NFIRS) incidents
According to the data from the years 2002 - 2018 the average number of fire incidents per year is 45. The highest number of reported fires - 74 took place in 2015, and the least - 2 in 2009. The data has a declining trend.
When looking into fire subcategories, the most incidents belonged to: Outside Fires (55.7%), and Structure Fires (25.0%).
Fire incident types reported to NFIRS in Zip Code 66050

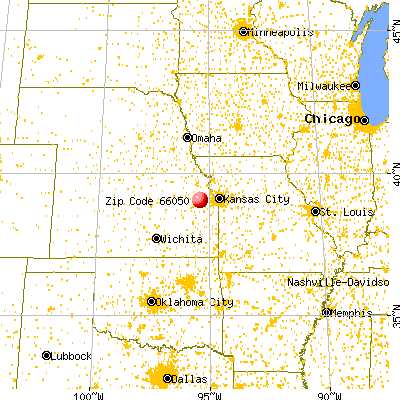


 Nearest zip codes: 66542, 66073, 66049, 66429, 66409, 66047.


 According to the data from the years 2002 - 2018 the average number of fire incidents per year is 45. The highest number of reported fires - 74 took place in 2015, and the least - 2 in 2009. The data has a declining trend.
 When looking into fire subcategories, the most incidents belonged to: Outside Fires (55.7%), and Structure Fires (25.0%).