Estimated zip code population in 2022: 2,504 Zip code population in 2010: 2,103 Zip code population in 2000: 2,319
Houses and condos: 1,148 Renter-occupied apartments: 251
% of renters here:
25%
State:
32%
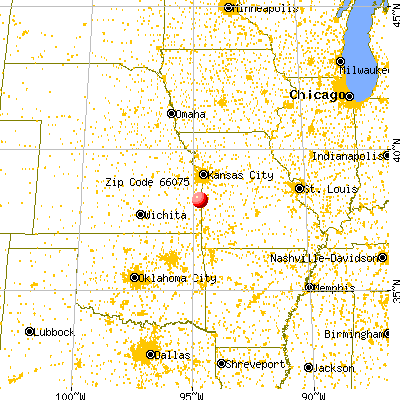
March 2022 cost of living index in zip code 66075: 78.1 (low, U.S. average is 100)
Land area: 105.1 sq. mi. Water area: 3.2 sq. mi.
Population density: 24 people per square mile
(very low).
OSM Map
General Map
Google Map
MSN Map
OSM Map
General Map
Google Map
MSN Map
OSM Map
General Map
Google Map
MSN Map
OSM Map
General Map
Google Map
MSN Map
Please wait while loading the map...
Real estate property taxes paid for housing units in 2022:
This zip code:
1.4% ($1,828)
Kansas:
1.2% ($2,578)
Median real estate property taxes paid for housing units with mortgages in 2022: $1,989 (1.8%) Median real estate property taxes paid for housing units with no mortgage in 2022: $1,627 (1.0%)
Business Search- 14 Million verified businesses
Males: 1,132
(45.2%)
Females: 1,372
(54.8%)
For population 25 years and over in 66075:
High school or higher: 91.1%
Bachelor's degree or higher: 21.4%
Graduate or professional degree: 6.0%
Unemployed: 3.6%
Mean travel time to work (commute): 32.6 minutes
For population 15 years and over in 66075:
Never married: 24.5%
Now married: 55.6%
Separated: 1.8%
Widowed: 7.3%
Divorced: 10.9%
Zip code 66075 compared to state average:
Median house value below state average.
Black race population percentage significantly below state average.
Hispanic race population percentage significantly below state average.
Foreign-born population percentage significantly below state average.
Length of stay since moving in significantly above state average.
Percentage of population with a bachelor's degree or higher below state average.
Estimated median house/condo value in 2022: $128,784
66075:
$128,784
Kansas:
$206,600
According to our research of Kansas and other state lists, there were 8 registered sex offenders living in 66075 zip code as of June 16, 2024. The ratio of all residents to sex offenders in zip code 66075 is 255 to 1. The ratio of registered sex offenders to all residents in this zip code is near the state average.
Median resident age:
This zip code:
40.8 years
Kansas median age:
37.6 years
Average household size:
This zip code:
2.5 people
Kansas:
2.4 people
Averages for the 2020 tax year for zip code 66075, filed in 2021:
Average Adjusted Gross Income (AGI) in 2020: $48,102 (Individual Income Tax Returns)
Here:
$48,102
State:
$72,721
Salary/wage: $45,823 (reported on 78.7% of returns)
Here:
$45,823
State:
$58,641
(% of AGI for various income ranges: 1298.3% for AGIs below $25k, 3582.5% for AGIs $25k-50k, 6722.0% for AGIs $50k-75k, 9520.0% for AGIs $75k-100k, 22648.0% for AGIs $100k-200k)
Taxable interest for individuals: $554 (reported on 29.8% of returns)
This zip code:
$554
Kansas:
$1,625
(% of AGI for various income ranges: 15.7% for AGIs below $25k, 18.0% for AGIs $25k-50k, 26.0% for AGIs $50k-75k, 41.7% for AGIs $75k-100k, 64.0% for AGIs $100k-200k)
Ordinary dividends: $1,833 (reported on 12.8% of returns)
Here:
$1,833
State:
$7,290
(% of AGI for various income ranges: 15.2% for AGIs below $25k, 18.0% for AGIs $25k-50k, 62.0% for AGIs $50k-75k, 174.0% for AGIs $100k-200k)
Net capital gain/loss in AGI: +$12,600 (reported on 11.7% of returns)
Here:
+$12,600
State:
+$20,511
(% of AGI for various income ranges: 23.9% for AGIs below $25k, 5.0% for AGIs $25k-50k, 289.0% for AGIs $50k-75k, 2064.0% for AGIs $100k-200k)
Profit/loss from business: +$2,300 (reported on 13.8% of returns)
Here:
+$2,300
State:
+$13,852
(% of AGI for various income ranges: 80.9% for AGIs below $25k, 127.0% for AGIs $25k-50k, 30.0% for AGIs $50k-75k)
Taxable individual retirement arrangement distribution: $20,575 (reported on 8.5% of returns)
66075:
$20,575
Kansas:
$19,921
(% of AGI for various income ranges: 368.0% for AGIs $25k-50k, 1516.7% for AGIs $75k-100k)
Earned income credit: $2,500 (reported on 19.1% of returns)
Here:
$2,500
State:
$2,267
(% of AGI for various income ranges: 123.5% for AGIs below $25k, 83.0% for AGIs $25k-50k)
Percentage of individuals using paid preparers for their 2020 taxes: 96.8%
Here:
97%
State:
95%
(% for various income ranges: 94.4% for AGIs below $25k, 96.0% for AGIs $25k-50k, 100.0% for AGIs $50k-75k, 100.0% for AGIs $75k-100k, 100.0% for AGIs $100k-200k)
Averages for the 2012 tax year for zip code 66075, filed in 2013:
Average Adjusted Gross Income (AGI) in 2012: $38,276 (Individual Income Tax Returns)
Here:
$38,276
State:
$60,095
Salary/wage: $35,248 (reported on 80.2% of returns)
Here:
$35,248
State:
$48,770
(% of AGI for various income ranges: 69.6% for AGIs below $25k, 73.2% for AGIs $25k-50k, 85.5% for AGIs $50k-75k, 79.9% for AGIs $75k-100k, 63.1% for AGIs $100k-200k)
Taxable interest for individuals: $846 (reported on 27.9% of returns)
This zip code:
$846
Kansas:
$1,506
(% of AGI for various income ranges: 1.9% for AGIs below $25k, 1.2% for AGIs $25k-50k, 0.1% for AGIs $50k-75k, 0.3% for AGIs $75k-100k)
Ordinary dividends: $1,450 (reported on 14.0% of returns)
Here:
$1,450
State:
$6,093
(% of AGI for various income ranges: 1.9% for AGIs below $25k, 0.7% for AGIs $25k-50k, 0.6% for AGIs $75k-100k)
Net capital gain/loss in AGI: +$6,789 (reported on 10.5% of returns)
Here:
+$6,789
State:
+$14,598
(% of AGI for various income ranges: 0.2% for AGIs below $25k, 2.0% for AGIs $25k-50k, 9.4% for AGIs $75k-100k)
Profit/loss from business: +$5,977 (reported on 15.1% of returns)
Here:
+$5,977
State:
+$12,554
(% of AGI for various income ranges: 8.7% for AGIs below $25k, 2.5% for AGIs $25k-50k, 2.2% for AGIs $50k-75k)
Taxable individual retirement arrangement distribution: $15,222 (reported on 10.5% of returns)
66075:
$15,222
Kansas:
$14,098
(% of AGI for various income ranges: 3.6% for AGIs below $25k, 4.4% for AGIs $25k-50k, 11.6% for AGIs $50k-75k)
Total itemized deductions: $18,718 (23% of AGI, reported on 19.8% of returns)
Here:
$18,718
State:
$23,678
Here:
23.1% of AGI
State:
18.9% of AGI
(% of AGI for various income ranges: 6.6% for AGIs below $25k, 8.3% for AGIs $25k-50k, 9.9% for AGIs $50k-75k, 14.0% for AGIs $75k-100k, 9.9% for AGIs $100k-200k)
Charity contributions: $2,750 (reported on 11.6% of returns)
Here:
$2,750
State:
$5,321
(% of AGI for various income ranges: 1.8% for AGIs below $25k, 1.0% for AGIs $50k-75k, 0.9% for AGIs $75k-100k, 0.8% for AGIs $100k-200k)
Taxes paid: $5,747 (reported on 19.8% of returns)
66075:
$5,747
State:
$9,548
(% of AGI for various income ranges: 1.0% for AGIs below $25k, 1.6% for AGIs $25k-50k, 2.7% for AGIs $50k-75k, 4.5% for AGIs $75k-100k, 4.6% for AGIs $100k-200k)
Earned income credit: $2,485 (reported on 23.3% of returns)
Here:
$2,485
State:
$2,212
(% of AGI for various income ranges: 7.8% for AGIs below $25k, 1.6% for AGIs $25k-50k)
Percentage of individuals using paid preparers for their 2012 taxes: 65.1%
Here:
65%
State:
56%
(% for various income ranges: 60.5% for AGIs below $25k, 63.2% for AGIs $25k-50k, 75.0% for AGIs $50k-75k, 66.7% for AGIs $75k-100k, 83.3% for AGIs $100k-200k)
Averages for the 2004 tax year for zip code 66075, filed in 2005:
Average Adjusted Gross Income (AGI) in 2004: $32,315 (Individual Income Tax Returns)
Here:
$32,315
State:
$45,726
Salary/wage: $32,205 (reported on 81.5% of returns)
Here:
$32,205
State:
$40,112
(% of AGI for various income ranges: 94.4% for AGIs below $10k, 72.0% for AGIs $10k-25k, 82.3% for AGIs $25k-50k, 91.8% for AGIs $50k-75k, 86.2% for AGIs $75k-100k, 45.9% for AGIs over 100k)
Taxable interest for individuals: $1,288 (reported on 40.0% of returns)
This zip code:
$1,288
Kansas:
$1,749
(% of AGI for various income ranges: 10.9% for AGIs below $10k, 3.1% for AGIs $10k-25k, 1.4% for AGIs $25k-50k, 0.4% for AGIs $50k-75k, 0.7% for AGIs $75k-100k, 2.6% for AGIs over 100k)
Taxable dividends: $1,007 (reported on 16.7% of returns)
Here:
$1,007
State:
$3,066
(% of AGI for various income ranges: 3.6% for AGIs below $10k, 0.8% for AGIs $10k-25k, 0.5% for AGIs $25k-50k, 0.1% for AGIs $50k-75k, 0.5% for AGIs $75k-100k, 0.6% for AGIs over 100k)
Net capital gain/loss: +$8,197 (reported on 13.2% of returns)
Here:
+$8,197
State:
+$7,555
(% of AGI for various income ranges: 0.1% for AGIs below $10k, 1.0% for AGIs $10k-25k, 2.4% for AGIs $25k-50k, -0.1% for AGIs $50k-75k, 2.1% for AGIs $75k-100k, 23.9% for AGIs over 100k)
Profit/loss from business: +$3,244 (reported on 17.6% of returns)
Here:
+$3,244
State:
+$9,571
(% of AGI for various income ranges: 8.7% for AGIs below $10k, 6.2% for AGIs $10k-25k, 1.5% for AGIs $25k-50k, 0.9% for AGIs $50k-75k)
IRA payment deduction: $3,611 (reported on 2.0% of returns)
66075:
$3,611
Kansas:
$2,922
Total itemized deductions: $15,107 (25% of AGI, reported on 19.0% of returns)
Here:
$15,107
State:
$18,779
Here:
25.1% of AGI
State:
20.5% of AGI
(% of AGI for various income ranges: 5.8% for AGIs $10k-25k, 7.9% for AGIs $25k-50k, 9.7% for AGIs $50k-75k, 11.6% for AGIs $75k-100k, 11.7% for AGIs over 100k)
Charity contributions deductions: $2,336 (4% of AGI, reported on 14.8% of returns)
Here:
$2,336
State:
$3,892
Here:
3.6% of AGI
State:
4.0% of AGI
(% of AGI for various income ranges: 3.6% for AGIs below $10k, 0.7% for AGIs $25k-50k, 1.1% for AGIs $50k-75k, 2.1% for AGIs $75k-100k, 1.1% for AGIs over 100k)
Total tax: $3,475 (reported on 70.4% of returns)
66075:
$3,475
State:
$7,203
(% of AGI for various income ranges: 4.5% for AGIs below $10k, 4.1% for AGIs $10k-25k, 5.6% for AGIs $25k-50k, 7.7% for AGIs $50k-75k, 10.1% for AGIs $75k-100k, 15.3% for AGIs over 100k)
Earned income credit: $1,759 (reported on 19.2% of returns)
Here:
$1,759
State:
$1,674
Percentage of individuals using paid preparers for their 2004 taxes: 68.1%
Here:
68%
State:
63%
(% for various income ranges: 63.8% for AGIs below $10k, 70.0% for AGIs $10k-25k, 70.5% for AGIs $25k-50k, 65.6% for AGIs $50k-75k, 68.3% for AGIs $75k-100k, 77.8% for AGIs over 100k)
Likely homosexual households (counted as self-reported same-sex unmarried-partner households)
Lesbian couples: 0.0% of all households
Gay men: 4.1% of all households
Household received Food Stamps/SNAP in the past 12 months: 125 Household did not receive Food Stamps/SNAP in the past 12 months: 869
Women who had a birth in the past 12 months: 27 (0 now married, 27 unmarried) Women who did not have a birth in the past 12 months: 512 (282 now married, 229 unmarried)
Housing units in zip code 66075 with a mortgage: 278 (13 second mortgage, 13 both second mortgage and home equity loan) Median monthly owner costs for units with a mortgage: $1,085 Median monthly owner costs for units without a mortgage: $545
Residents with income below the poverty level in 2022:
This zip code:
10.6%
Whole state:
12.0%
Residents with income below 50% of the poverty level in 2022:
This zip code:
6.0%
Whole state:
6.4%
Median number of rooms in houses and condos:
Here:
6.1
State:
6.9
Median number of rooms in apartments:
Here:
4.4
State:
4.4
Notable locations in this zip code not listed on our city pages
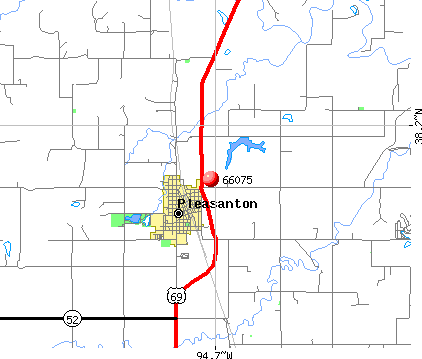
Notable locations in zip code 66075: Linn County Speedway (A), Pleasanton Industrial Park (B), Pleasanton Wastewater Treatment Facility (C), Green Valley School (D), Pleasanton Police Department (E), Pleasanton Fire Department (F), Linn County Rural Fire District 1 Station 920 (G), Linn County Health Department (H), Pleasanton Lincoln Library (I), Trading Post Museum (J), Linn County Historical Museum (K), Pleasanton City Hall (L). Display/hide their locations on the map
Churches in zip code 66075 include: Bykota Southern Baptist Church (A), First Baptist Church (B), First Christian Church (C), Pleasanton United Methodist Church (D), Pleasanton Church of the Nazarene (E), First Presbyterian Church (F), Pleasanton Assembly of God Church (G), Fairmount Church (H). Display/hide their locations on the map
Cemeteries: Trading Post Cemetery (1), Richland Cemetery (2), Fisher Cemetery (3), Holmes Cemetery (4), Littell Cemetery (5), Pleasanton Cemetery (6), Eureka Cemetery (7). Display/hide their locations on the map
Parks in zip code 66075 include: Mine Creek Battlefield Park (1), Massacre Memorial State Park (2), Lakeside Park (3), Marais des Cygnes Massacre State Historic Site (4). Display/hide their locations on the map
Size of family households: 334 2-persons, 129 3-persons, 78 4-persons, 72 5-persons, 24 6-persons, 15 7-or-more-persons
Size of nonfamily households: 232 1-person, 102 2-persons
431 married couples with children.
87 single-parent households (57 men, 30 women).
99.0% of residents of 66075 zip code speak English at home.
0.2% of residents speak other Indo-European language at home (100% very well).
0.8% of residents speak Asian or Pacific Island language at home (100% very well).
Foreign born population: 2 (0.1%) (0.0% of them are naturalized citizens)
:
0.1%
Whole state:
7.1%
50%Malaysia
37%German
19%American
11%English
6%Irish
2%Scottish
2%Celtic
1%British
Year of entry for the foreign-born population
22010 or later
52000 to 2009
01990 to 1999
0Before 1990
Facilities with environmental interests located in this zip code:
AVIPATH, LLC (18354 EAST 1100 ROAD in PLEASANTON, KS)
AIR MINOR (AIRS/AFS) STATE MASTER (Kansas Facility Profiler) - ISTEPS-10700029, AIR PROGRAM, CAFO-13019, LIVE STOCK WASTE CONTROL Business SIC classification: POULTRY AND EGGS Business NAICS classification: OTHER POULTRY PRODUCTION. Organizations: AVIPATH LLC (OWNER/OPERATOR)
MASCHINO LUMBER & READY-MIX (10TH & CENTER in PLEASANTON, KS)
AIR MINOR (AIRS/AFS) STATE MASTER (Kansas Facility Profiler) - ISTEPS-10700011, AIR PROGRAM, WWT-I-MC35-PR01, WASTEWATER FACILITY Business SIC classification: READY-MIXED CONCRETE Business NAICS classification: READY-MIX CONCRETE MANUFACTURING. Alternative names: COSENS LUMBER & READY MIX INCORPORATED FLOYD, FLOYD COSENS LUMBER & READY MIX
ASH GROVE AGGREGATES, INC. (2 MILES WEST OF PLEASANTON in PLEASANTON, KS)
AIR SYNTHETIC MINOR (AIRS/AFS) STATE MASTER (Kansas Facility Profiler) - ISTEPS-10700018, AIR MINOR CRITERIA AND HAZARDOUS AIR POLLUTANT INVENTORY (Inventory of air pollution sources) Business SIC and NAICS classification: CRUSHED AND BROKEN LIMESTONE
WADE QUARRIES (S27-T22S-R24E in PLEASANTON, KS)
AIR SYNTHETIC MINOR (AIRS/AFS) STATE MASTER (Kansas Facility Profiler) - ISTEPS-10700026, AIR MINOR CRITERIA AND HAZARDOUS AIR POLLUTANT INVENTORY (Inventory of air pollution sources) Business SIC and NAICS classification: CRUSHED AND BROKEN LIMESTONE
APAC-KANSAS, INC., KANSAS CITY DIVISION (S27-T22S-R24E in PLEASANTON, KS)
AIR SYNTHETIC MINOR (AIRS/AFS) Business SIC classification: CRUSHED AND BROKEN LIMESTONE
MIDWESTERN FERTILIZER DBA DREXEL ELEV (1006 S DEPTO in PLEASANTON, KS)
COMPLIANCE ACTIVITY (Tracking inspections of insecticide, fungicide, and rodenticide, and toxic substances)
Housing units lacking complete plumbing facilities: 8.4% Housing units lacking complete kitchen facilities: 8.0%
41.4%Utility gas
39.5%Electricity
17.8%Bottled, tank, or LP gas
1.4%Wood
Population in 1990: 2,050. Population change in the 1990s: +269 (+13.1%).
Place of birth for U.S.-born residents:
This state: 1,574
Northeast: 9
Midwest: 485
South: 270
West: 150
58% of the 66075 zip code residents lived in the same house 5 years ago. Out of people who lived in different houses, 48% lived in this county. Out of people who lived in different counties, 50% lived in Kansas.
93% of the 66075 zip code residents lived in the same house 1 year ago. Out of people who lived in different houses, 51% moved from this county. Out of people who lived in different houses, 18% moved from different county within same state. Out of people who lived in different houses, 34% moved from different state.
Private vs. public school enrollment:
Students in private schools in grades 1 to 8 (elementary and middle school): 2
Here:
1.0%
Kansas:
14.1%
Students in private schools in grades 9 to 12 (high school):
Here:
0.0%
Kansas:
10.8%
Students in private undergraduate colleges:
Here:
0.0%
Kansas:
15.4%
Occupation by median earnings in the past 12 months ($)
87,857Health diagnosing and treating practitioners and other technical occupations
86,818Business and financial operations occupations
46,554Construction and extraction occupations
45,423Production occupations
37,549Office and administrative support occupations
37,117Transportation occupations
Top industries in this zip code by the number of employees in 2005:
Accommodation and Food Services: Full-Service Restaurants (10-19 employees: 1 establishment)
Health Care and Social Assistance: Homes for the Elderly (10-19: 1)
Health Care and Social Assistance: Outpatient Mental Health and Substance Abuse Centers (10-19: 1)
Construction: Other Building Equipment Contractors (10-19: 1)
Finance and Insurance: Commercial Banking (5-9: 2)
Fatal accident statistics in 2014:
Fatal accident count: 2
Vehicles involved in fatal accidents: 3
Fatal accidents caused by drunken drivers: 1
Fatalities: 2
Persons involved in fatal accidents: 3
Pedestrians involved in fatal accidents: 0
Fatal accident statistics in 2013:
Fatal accident count: 1
Vehicles involved in fatal accidents: 2
Fatal accidents caused by drunken drivers: 0
Fatalities: 1
Persons involved in fatal accidents: 2
Pedestrians involved in fatal accidents: 0
2002 - 2018 National Fire Incident Reporting System (NFIRS) incidents
Based on the data from the years 2002 - 2018 the average number of fires per year is 34. The highest number of reported fire incidents - 66 took place in 2014, and the least - 14 in 2004. The data has a growing trend.
When looking into fire subcategories, the most reports belonged to: Outside Fires (56.5%), and Structure Fires (22.3%).
Fire incident types reported to NFIRS in Zip Code 66075


 Nearest zip codes: 66767, 66056, 66040, 64722, 64752, 66738.


 Based on the data from the years 2002 - 2018 the average number of fires per year is 34. The highest number of reported fire incidents - 66 took place in 2014, and the least - 14 in 2004. The data has a growing trend.
 When looking into fire subcategories, the most reports belonged to: Outside Fires (56.5%), and Structure Fires (22.3%).