Estimated zip code population in 2022: 10,839 Zip code population in 2010: 9,080 Zip code population in 2000: 6,789
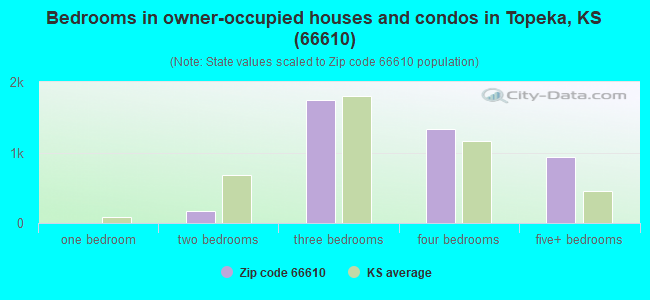
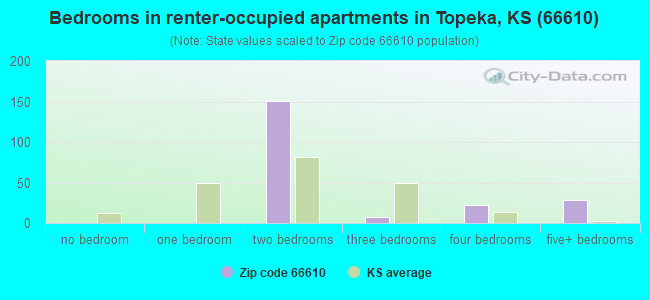
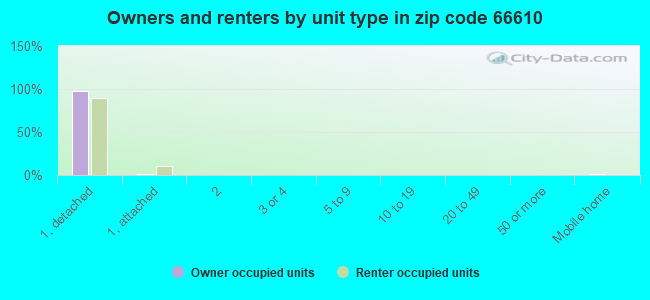
Houses and condos: 4,369 Renter-occupied apartments: 213
% of renters here:
5%
State:
32%
March 2022 cost of living index in zip code 66610: 82.6 (low, U.S. average is 100)
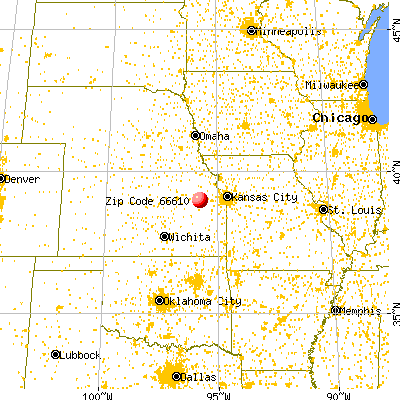
Land area: 38.3 sq. mi. Water area: 0.9 sq. mi.
Population density: 283 people per square mile
(very low).
OSM Map
General Map
Google Map
MSN Map
OSM Map
General Map
Google Map
MSN Map
OSM Map
General Map
Google Map
MSN Map
OSM Map
General Map
Google Map
MSN Map
Please wait while loading the map...
Real estate property taxes paid for housing units in 2022:
This zip code:
1.5% ($4,651)
Kansas:
1.2% ($2,578)
Median real estate property taxes paid for housing units with mortgages in 2022: $4,725 (1.5%) Median real estate property taxes paid for housing units with no mortgage in 2022: $4,500 (1.5%)
Business Search- 14 Million verified businesses
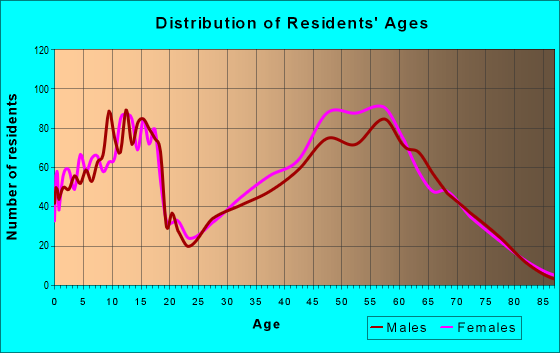
Males: 5,266
(48.6%)
Females: 5,573
(51.4%)
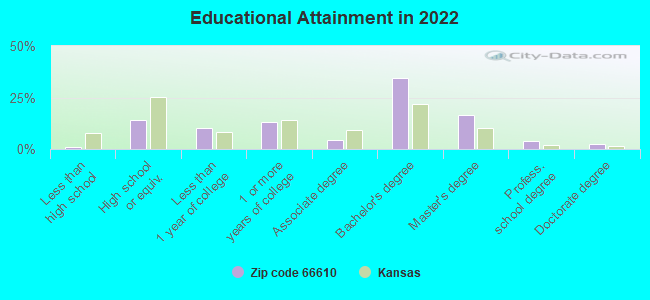
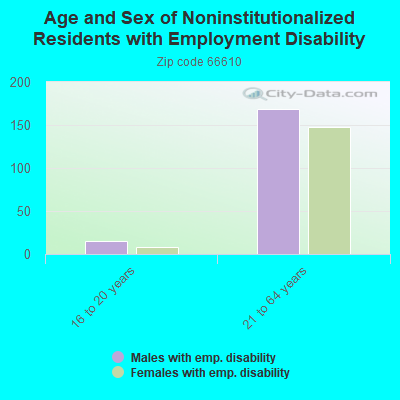
For population 25 years and over in 66610:
High school or higher: 100.4%
Bachelor's degree or higher: 57.9%
Graduate or professional degree: 23.0%
Unemployed: 2.6%
Mean travel time to work (commute): 20.9 minutes
For population 15 years and over in 66610:
Never married: 17.8%
Now married: 67.8%
Separated: 0.5%
Widowed: 5.3%
Divorced: 8.6%
Zip code 66610 compared to state average:
Median household income above state average.
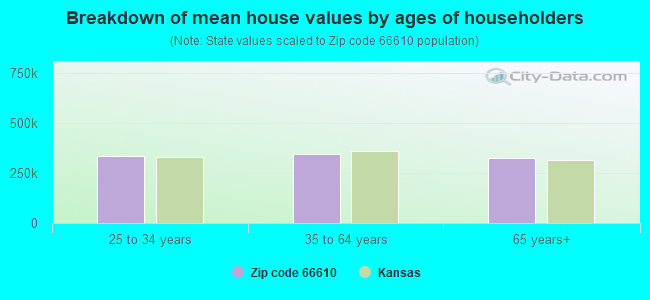
Median house value above state average.
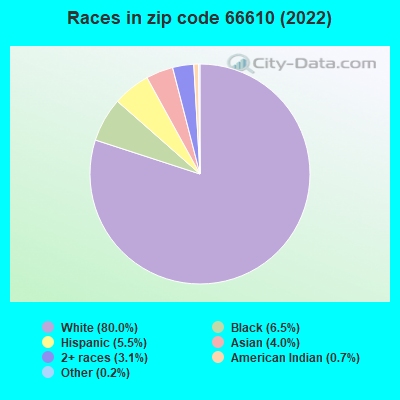
Hispanic race population percentage below state average.
Median age significantly above state average.
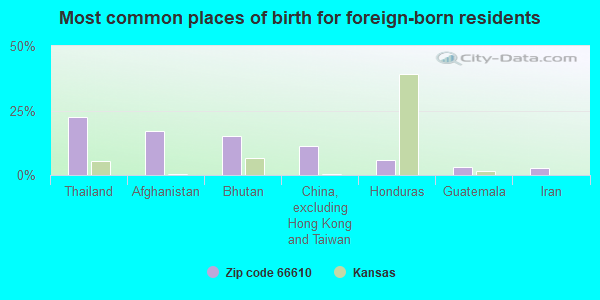
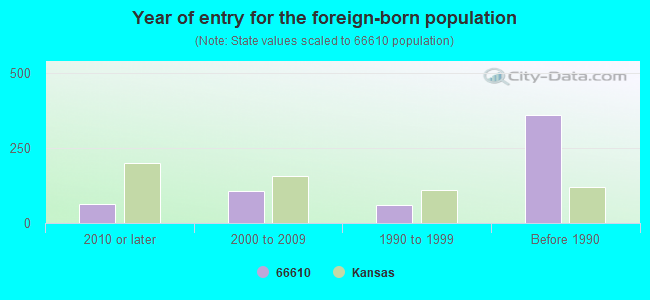
Foreign-born population percentage below state average.
Renting percentage significantly below state average.
Length of stay since moving in significantly above state average.
Number of rooms per house above state average.
House age significantly below state average.
Number of college students below state average.
Percentage of population with a bachelor's degree or higher above state average.
Estimated median house/condo value in 2022: $310,282
66610:
$310,282
Kansas:
$206,600
According to our research of Kansas and other state lists, there were 12 registered sex offenders living in 66610 zip code as of June 16, 2024. The ratio of all residents to sex offenders in zip code 66610 is 825 to 1. The ratio of registered sex offenders to all residents in this zip code is much lower than the state average.
Median resident age:
This zip code:
48.0 years
Kansas median age:
37.6 years
Average household size:
This zip code:
2.5 people
Kansas:
2.4 people
Averages for the 2020 tax year for zip code 66610, filed in 2021:
Average Adjusted Gross Income (AGI) in 2020: $119,061 (Individual Income Tax Returns)
Here:
$119,061
State:
$72,721
Salary/wage: $94,046 (reported on 78.7% of returns)
Here:
$94,046
State:
$58,641
(% of AGI for various income ranges: 1132.4% for AGIs below $25k, 3328.7% for AGIs $25k-50k, 5896.8% for AGIs $50k-75k, 8412.5% for AGIs $75k-100k, 17401.8% for AGIs $100k-200k, 80575.0% for AGIs over 200k)
Taxable interest for individuals: $1,994 (reported on 52.4% of returns)
This zip code:
$1,994
Kansas:
$1,625
(% of AGI for various income ranges: 23.4% for AGIs below $25k, 51.5% for AGIs $25k-50k, 119.3% for AGIs $50k-75k, 167.5% for AGIs $75k-100k, 181.5% for AGIs $100k-200k, 1172.0% for AGIs over 200k)
Ordinary dividends: $8,668 (reported on 36.1% of returns)
Here:
$8,668
State:
$7,290
(% of AGI for various income ranges: 71.1% for AGIs below $25k, 97.2% for AGIs $25k-50k, 219.8% for AGIs $50k-75k, 293.3% for AGIs $75k-100k, 459.9% for AGIs $100k-200k, 4629.0% for AGIs over 200k)
Net capital gain/loss in AGI: +$17,041 (reported on 32.7% of returns)
Here:
+$17,041
State:
+$20,511
(% of AGI for various income ranges: 27.0% for AGIs below $25k, 101.9% for AGIs $25k-50k, 199.0% for AGIs $50k-75k, 220.8% for AGIs $75k-100k, 544.4% for AGIs $100k-200k, 10725.0% for AGIs over 200k)
Profit/loss from business: +$20,094 (reported on 16.3% of returns)
Here:
+$20,094
State:
+$13,852
(% of AGI for various income ranges: 69.2% for AGIs below $25k, 127.6% for AGIs $25k-50k, 336.8% for AGIs $50k-75k, 260.0% for AGIs $75k-100k, 613.8% for AGIs $100k-200k, 4149.0% for AGIs over 200k)
Taxable individual retirement arrangement distribution: $28,195 (reported on 16.7% of returns)
66610:
$28,195
Kansas:
$19,921
(% of AGI for various income ranges: 82.7% for AGIs below $25k, 229.1% for AGIs $25k-50k, 487.8% for AGIs $50k-75k, 618.6% for AGIs $75k-100k, 1322.1% for AGIs $100k-200k, 3850.0% for AGIs over 200k)
Self-employed (Keogh) retirement plans: $26,567 (reported on 1.2% of returns)
66610:
$26,567
Kansas:
$25,388
(% of AGI for various income ranges: 797.0% for AGIs over 200k)
Total itemized deductions: $36,964 (reported on 14.5% of returns)
Here:
$36,964
State:
$36,939
(% of AGI for various income ranges: 145.1% for AGIs below $25k, 267.2% for AGIs $25k-50k, 325.6% for AGIs $50k-75k, 670.6% for AGIs $75k-100k, 946.2% for AGIs $100k-200k, 6742.5% for AGIs over 200k)
Charity contributions: $16,608 (reported on 12.9% of returns)
Here:
$16,608
State:
$15,443
(% of AGI for various income ranges: 29.3% for AGIs $25k-50k, 59.8% for AGIs $50k-75k, 145.3% for AGIs $75k-100k, 314.5% for AGIs $100k-200k, 3703.5% for AGIs over 200k)
Taxes paid: $8,640 (reported on 14.5% of returns)
66610:
$8,640
State:
$8,001
(% of AGI for various income ranges: 22.1% for AGIs below $25k, 46.7% for AGIs $25k-50k, 101.7% for AGIs $50k-75k, 196.7% for AGIs $75k-100k, 273.6% for AGIs $100k-200k, 1345.0% for AGIs over 200k)
Earned income credit: $2,064 (reported on 5.0% of returns)
Here:
$2,064
State:
$2,267
(% of AGI for various income ranges: 40.6% for AGIs below $25k, 42.2% for AGIs $25k-50k)
Percentage of individuals using paid preparers for their 2020 taxes: 94.6%
Here:
95%
State:
95%
(% for various income ranges: 92.6% for AGIs below $25k, 94.6% for AGIs $25k-50k, 96.8% for AGIs $50k-75k, 94.5% for AGIs $75k-100k, 94.8% for AGIs $100k-200k, 95.3% for AGIs over 200k)
Averages for the 2012 tax year for zip code 66610, filed in 2013:
Average Adjusted Gross Income (AGI) in 2012: $108,207 (Individual Income Tax Returns)
Here:
$108,207
State:
$60,095
Salary/wage: $84,669 (reported on 82.9% of returns)
Here:
$84,669
State:
$48,770
(% of AGI for various income ranges: 74.3% for AGIs below $25k, 70.0% for AGIs $25k-50k, 68.0% for AGIs $50k-75k, 69.8% for AGIs $75k-100k, 70.7% for AGIs $100k-200k, 58.6% for AGIs over 200k)
Taxable interest for individuals: $2,179 (reported on 55.0% of returns)
This zip code:
$2,179
Kansas:
$1,506
(% of AGI for various income ranges: 2.2% for AGIs below $25k, 1.3% for AGIs $25k-50k, 0.8% for AGIs $50k-75k, 0.8% for AGIs $75k-100k, 0.8% for AGIs $100k-200k, 1.4% for AGIs over 200k)
Ordinary dividends: $6,774 (reported on 36.8% of returns)
Here:
$6,774
State:
$6,093
(% of AGI for various income ranges: 3.7% for AGIs below $25k, 2.0% for AGIs $25k-50k, 1.8% for AGIs $50k-75k, 1.6% for AGIs $75k-100k, 1.8% for AGIs $100k-200k, 2.8% for AGIs over 200k)
Net capital gain/loss in AGI: +$15,999 (reported on 30.9% of returns)
Here:
+$15,999
State:
+$14,598
(% of AGI for various income ranges: 0.5% for AGIs below $25k, 0.6% for AGIs $50k-75k, 0.7% for AGIs $75k-100k, 1.8% for AGIs $100k-200k, 8.6% for AGIs over 200k)
Profit/loss from business: +$22,065 (reported on 17.5% of returns)
Here:
+$22,065
State:
+$12,554
(% of AGI for various income ranges: 4.5% for AGIs below $25k, 2.1% for AGIs $25k-50k, 3.0% for AGIs $50k-75k, 2.9% for AGIs $75k-100k, 4.5% for AGIs $100k-200k, 3.4% for AGIs over 200k)
Taxable individual retirement arrangement distribution: $25,140 (reported on 15.8% of returns)
66610:
$25,140
Kansas:
$14,098
(% of AGI for various income ranges: 4.1% for AGIs below $25k, 4.5% for AGIs $25k-50k, 4.9% for AGIs $50k-75k, 4.2% for AGIs $75k-100k, 4.0% for AGIs $100k-200k, 3.0% for AGIs over 200k)
Self-employment retirement plans: $20,975 (reported on 1.8% of returns)
66610:
$20,975
Kansas:
$19,780
(% of AGI for various income ranges: 0.4% for AGIs $100k-200k, 0.5% for AGIs over 200k)
Total itemized deductions: $29,427 (18% of AGI, reported on 56.1% of returns)
Here:
$29,427
State:
$23,678
Here:
17.8% of AGI
State:
18.9% of AGI
(% of AGI for various income ranges: 17.0% for AGIs below $25k, 14.2% for AGIs $25k-50k, 15.5% for AGIs $50k-75k, 16.0% for AGIs $75k-100k, 16.4% for AGIs $100k-200k, 14.4% for AGIs over 200k)
Charity contributions: $5,736 (reported on 48.9% of returns)
Here:
$5,736
State:
$5,321
(% of AGI for various income ranges: 1.1% for AGIs below $25k, 1.7% for AGIs $25k-50k, 2.1% for AGIs $50k-75k, 2.3% for AGIs $75k-100k, 2.7% for AGIs $100k-200k, 2.8% for AGIs over 200k)
Taxes paid: $14,807 (reported on 56.1% of returns)
66610:
$14,807
State:
$9,548
(% of AGI for various income ranges: 4.7% for AGIs below $25k, 4.9% for AGIs $25k-50k, 5.7% for AGIs $50k-75k, 6.6% for AGIs $75k-100k, 7.6% for AGIs $100k-200k, 8.8% for AGIs over 200k)
Earned income credit: $1,742 (reported on 5.3% of returns)
Here:
$1,742
State:
$2,212
(% of AGI for various income ranges: 2.5% for AGIs below $25k, 0.5% for AGIs $25k-50k)
Percentage of individuals using paid preparers for their 2012 taxes: 55.7%
Here:
56%
State:
56%
(% for various income ranges: 47.9% for AGIs below $25k, 50.7% for AGIs $25k-50k, 55.6% for AGIs $50k-75k, 56.1% for AGIs $75k-100k, 58.7% for AGIs $100k-200k, 75.0% for AGIs over 200k)
Averages for the 2004 tax year for zip code 66610, filed in 2005:
Average Adjusted Gross Income (AGI) in 2004: $83,946 (Individual Income Tax Returns)
Here:
$83,946
State:
$45,726
Salary/wage: $69,274 (reported on 82.8% of returns)
Here:
$69,274
State:
$40,112
(% of AGI for various income ranges: 860.5% for AGIs below $10k, 62.6% for AGIs $10k-25k, 68.5% for AGIs $25k-50k, 72.6% for AGIs $50k-75k, 76.7% for AGIs $75k-100k, 64.4% for AGIs over 100k)
Taxable interest for individuals: $2,277 (reported on 66.5% of returns)
This zip code:
$2,277
Kansas:
$1,749
(% of AGI for various income ranges: 59.9% for AGIs below $10k, 3.8% for AGIs $10k-25k, 1.8% for AGIs $25k-50k, 1.7% for AGIs $50k-75k, 1.1% for AGIs $75k-100k, 1.8% for AGIs over 100k)
Taxable dividends: $4,231 (reported on 44.2% of returns)
Here:
$4,231
State:
$3,066
(% of AGI for various income ranges: 62.8% for AGIs below $10k, 3.5% for AGIs $10k-25k, 1.9% for AGIs $25k-50k, 1.4% for AGIs $50k-75k, 1.5% for AGIs $75k-100k, 2.4% for AGIs over 100k)
Net capital gain/loss: +$10,153 (reported on 38.4% of returns)
Here:
+$10,153
State:
+$7,555
(% of AGI for various income ranges: -25.9% for AGIs below $10k, 0.5% for AGIs $10k-25k, 0.9% for AGIs $25k-50k, 0.9% for AGIs $50k-75k, 1.2% for AGIs $75k-100k, 6.7% for AGIs over 100k)
Profit/loss from business: +$22,991 (reported on 18.8% of returns)
Here:
+$22,991
State:
+$9,571
(% of AGI for various income ranges: -34.9% for AGIs below $10k, 5.0% for AGIs $10k-25k, 4.7% for AGIs $25k-50k, 4.3% for AGIs $50k-75k, 3.4% for AGIs $75k-100k, 5.8% for AGIs over 100k)
IRA payment deduction: $3,752 (reported on 3.6% of returns)
66610:
$3,752
Kansas:
$2,922
(% of AGI for various income ranges: 0.4% for AGIs $10k-25k, 0.4% for AGIs $25k-50k, 0.2% for AGIs $50k-75k, 0.2% for AGIs $75k-100k, 0.1% for AGIs over 100k)
Self-employed pension: $17,000 (reported on 2.6% of returns)
Here:
$17,000
Kansas:
$14,209
Total itemized deductions: $23,707 (18% of AGI, reported on 57.1% of returns)
Here:
$23,707
State:
$18,779
Here:
18.4% of AGI
State:
20.5% of AGI
(% of AGI for various income ranges: 157.4% for AGIs below $10k, 18.6% for AGIs $10k-25k, 19.3% for AGIs $25k-50k, 18.0% for AGIs $50k-75k, 17.7% for AGIs $75k-100k, 14.8% for AGIs over 100k)
Charity contributions deductions: $4,652 (3% of AGI, reported on 51.9% of returns)
Here:
$4,652
State:
$3,892
Here:
3.5% of AGI
State:
4.0% of AGI
(% of AGI for various income ranges: 3.7% for AGIs below $10k, 2.0% for AGIs $10k-25k, 2.2% for AGIs $25k-50k, 2.3% for AGIs $50k-75k, 2.7% for AGIs $75k-100k, 3.1% for AGIs over 100k)
Total tax: $15,974 (reported on 83.6% of returns)
66610:
$15,974
State:
$7,203
(% of AGI for various income ranges: 24.1% for AGIs below $10k, 4.7% for AGIs $10k-25k, 6.9% for AGIs $25k-50k, 8.7% for AGIs $50k-75k, 10.0% for AGIs $75k-100k, 19.9% for AGIs over 100k)
Earned income credit: $1,296 (reported on 4.1% of returns)
Here:
$1,296
State:
$1,674
Percentage of individuals using paid preparers for their 2004 taxes: 58.9%
Here:
59%
State:
63%
(% for various income ranges: 46.7% for AGIs below $10k, 57.3% for AGIs $10k-25k, 60.5% for AGIs $25k-50k, 59.5% for AGIs $50k-75k, 58.2% for AGIs $75k-100k, 68.2% for AGIs over 100k)
Household received Food Stamps/SNAP in the past 12 months: 18 Household did not receive Food Stamps/SNAP in the past 12 months: 4,329
Women who had a birth in the past 12 months: 90 (91 now married, 0 unmarried) Women who did not have a birth in the past 12 months: 1,933 (1,017 now married, 913 unmarried)
Housing units in zip code 66610 with a mortgage: 2,494 (138 second mortgage, 113 both second mortgage and home equity loan) Houses without a mortgage: 134
Median monthly owner costs for units with a mortgage: $1,963 Median monthly owner costs for units without a mortgage: $862
Residents with income below the poverty level in 2022:
This zip code:
4.9%
Whole state:
12.0%
Residents with income below 50% of the poverty level in 2022:
This zip code:
1.4%
Whole state:
6.4%
Median number of rooms in houses and condos:
Here:
7.9
State:
6.9
Median number of rooms in apartments:
Here:
6.9
State:
4.4
Notable locations in this zip code not listed on our city pages
Notable locations in zip code 66610: Berkshire Country Club (A), Dover Industrial Park (B), Prairie View Golf Club (C), Auburn - Washburn Unified School District 437 Police Office (D), Shawnee County Fire District 4 Dover Station (E), Metzger Nursery (F). Display/hide their locations on the map
In group quarters: 15 (-1 institutionalized population)
Size of family households: 1,810 2-persons, 603 3-persons, 452 4-persons, 262 5-persons, 149 6-persons, 95 7-or-more-persons
Size of nonfamily households: 853 1-person, 107 2-persons
1,984 married couples with children.
405 single-parent households (171 men, 234 women).
96.4% of residents of 66610 zip code speak English at home.
1.1% of residents speak Spanish at home (92% very well, 8% well).
1.1% of residents speak other Indo-European language at home (48% very well, 35% well, 17% not well).
1.8% of residents speak Asian or Pacific Island language at home (25% very well, 49% well, 26% not well).
Foreign born population: 394 (3.6%) (77.1% of them are naturalized citizens)
Facilities with environmental interests located in this zip code:
USD #437 JAY SHIDELER (AUBURN-WASHBURN) (4948 SW WANAMAKER RD in TOPEKA, KS)
STATE MASTER (Kansas Facility Profiler) - TANKS-80146, UNDERGROUND STORAGE TANK PROGRAM STATE MASTER (Kansas Facility Profiler) - WWT-M-KS72-OO11, WASTEWATER FACILITY (National Center for Education Statistics) - STATE ID-6530 National Pollutant Discharge Elimination System NON-MAJOR (Tracking pollutant discharge elimination systems) - permit (Resource Conservation and Recovery Act (tracking hazardous waste)) Business SIC classification: ELEMENTARY AND SECONDARY SCHOOLS Organizations: USD 437, AUBURN-WASHBURN (CONTACT/OWNER)
, USD #437 AUBURN-WASHBURN (CONTACT/OWNER)
, USD 437 - AUBURN/WASHBURN (OWNER/OPERATOR)
, AUBURN WASHBURN (SCHOOL DISTRICT)
Alternative names: JAY SHIDELER ELEMENTARY SCHOOL, JAY SHIDELER JR HIGH SCHOOL, USD 437 AUBURN WASHBURN, USD 437, AUBURN/WASHBURN DIST
USD #437 (AUBURN-WASHBURN) (5928 SW 53RD ST in TOPEKA, KS)
STATE MASTER (Kansas Facility Profiler) - WWT-M-KS72-OO16, WASTEWATER FACILITY, TANKS-06007, UNDERGROUND STORAGE TANK PROGRAM, TANKS-25884, COMPLIANCE ACTIVITY (Tracking inspections of insecticide, fungicide, and rodenticide, and toxic substances) Business SIC classification: ELEMENTARY AND SECONDARY SCHOOLS Alternative names: AUBURN-WASHBURN USD 437
JOEL LEUENBERGER (6752 SOUTHWEST DANCASTER RD in TOPEKA, KS)
COMPLIANCE ACTIVITY (Tracking inspections of insecticide, fungicide, and rodenticide, and toxic substances)
Housing units lacking complete plumbing facilities: 0.5% Housing units lacking complete kitchen facilities: 0.5%
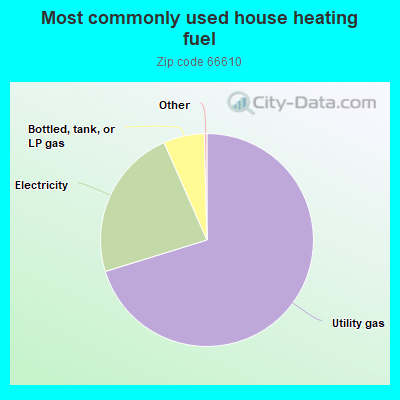
70.3%Utility gas
23.2%Electricity
6.2%Bottled, tank, or LP gas
Population in 1990: 4,656. Population change in the 1990s: +2,133 (+45.8%).
Place of birth for U.S.-born residents:
This state: 7,542
Northeast: 221
Midwest: 1,228
South: 743
West: 461
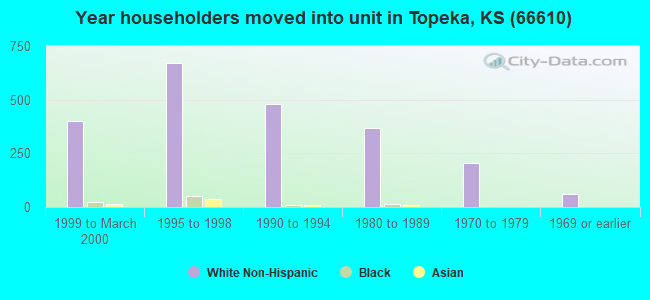
56% of the 66610 zip code residents lived in the same house 5 years ago. Out of people who lived in different houses, 56% lived in this county. Out of people who lived in different counties, 50% lived in Kansas.
96% of the 66610 zip code residents lived in the same house 1 year ago. Out of people who lived in different houses, 53% moved from this county. Out of people who lived in different houses, 40% moved from different county within same state. Out of people who lived in different houses, 18% moved from different state.
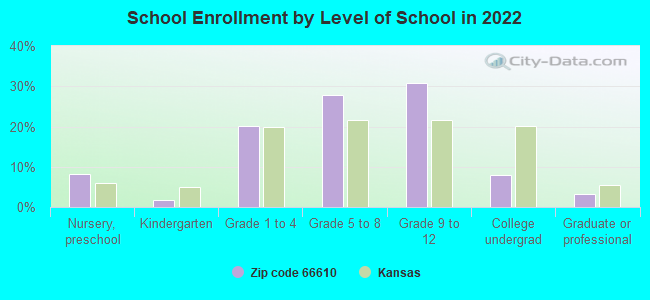
Private vs. public school enrollment:
Students in private schools in grades 1 to 8 (elementary and middle school): 168
Here:
15.6%
Kansas:
14.1%
Students in private schools in grades 9 to 12 (high school): 148
Here:
21.2%
Kansas:
10.8%
Students in private undergraduate colleges: 19
Here:
11.2%
Kansas:
15.4%
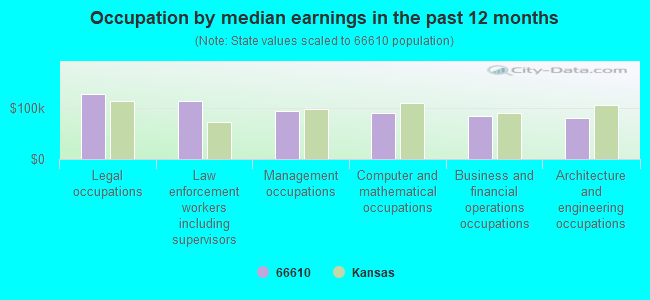
Occupation by median earnings in the past 12 months ($)
127,452Legal occupations
112,835Law enforcement workers including supervisors
92,938Management occupations
89,389Computer and mathematical occupations
83,687Business and financial operations occupations
79,864Architecture and engineering occupations
Companies with federal contracts located in this zip code:
BERBERICH, TRAHAN & CO PA (3630 SW BURLINGAME RD in TOPEKA, KS; small business) : $139,353 in 3 contractsin 2003
$60,873 with U.S. Army Corps of Engineers - civil program financing only for ADP Software. Taking place in NE. Signed on 2003-02-11. Completion date: 2003-02-21.
$50,000 with U.S. Army Corps of Engineers - civil program financing only for Accounting Services (NOTE: New code created for Financial Services See R710 below). Taking place in NE. Signed on 2003-09-22. Completion date: 2003-11-30.
$28,480 with U.S. Army Corps of Engineers - civil program financing only for ADP Software. Taking place in NE. Signed on 2003-06-05. Completion date: 2003-02-21.
CCC, INC (3920 SW CHELMSFORD RD in TOPEKA, KS; small business)
$2,500 with Army for Custodial Janitorial Services. Signed on 2003-07-31. Completion date: 2003-08-15.
Top industries in this zip code by the number of employees in 2005:
Accommodation and Food Services: Limited-Service Restaurants (50-99 employees: 2 establishments)
Professional, Scientific, and Technical Services: Offices of Certified Public Accountants (20-49: 1)
Arts, Entertainment, and Recreation: All Other Amusement and Recreation Industries (10-19: 1, 5-9: 2)
Finance and Insurance: Insurance Agencies and Brokerages (10-19: 1, 5-9: 1, 1-4: 2)
Construction: New Single-Family Housing Construction (except Operative Builders) (10-19: 1, 1-4: 3)
Construction: Drywall and Insulation Contractors (10-19: 1)
Other Services (except Public Administration): Human Rights Organizations (10-19: 1)
Accommodation and Food Services: Hotels (except Casino Hotels) and Motels (10-19: 1)
People in group quarters in 2000:
4 people in hospitals or wards for drug/alcohol abuse
Fatal accident statistics in 2012:
Fatal accident count: 1
Vehicles involved in fatal accidents: 1
Fatal accidents caused by drunken drivers: 0
Fatalities: 1
Persons involved in fatal accidents: 1
Pedestrians involved in fatal accidents: 0
Fatal accident statistics in 2010:
Fatal accident count: 1
Vehicles involved in fatal accidents: 1
Fatal accidents caused by drunken drivers: 1
Fatalities: 1
Persons involved in fatal accidents: 2
Pedestrians involved in fatal accidents: 1
Home Mortgage Disclosure Act Aggregated Statistics For Year 2009 (Based on 8 partial tracts)
A) FHA, FSA/RHS & VA Home Purchase Loans
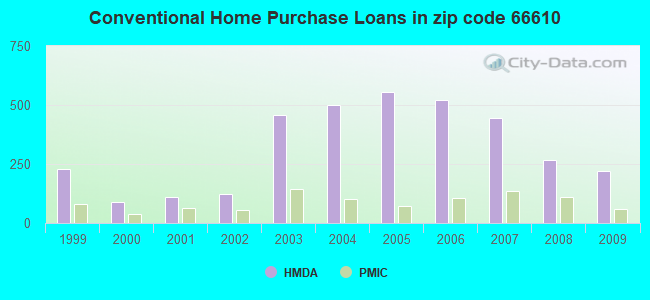
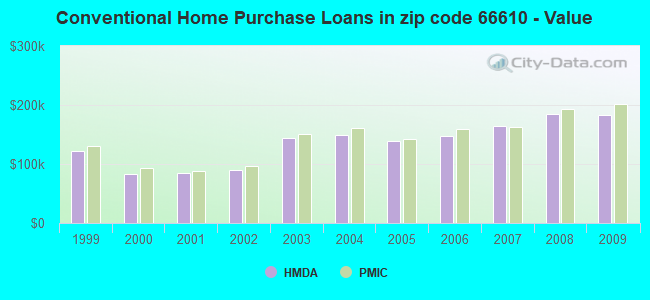
B) Conventional Home Purchase Loans
C) Refinancings
D) Home Improvement Loans
E) Loans on Dwellings For 5+ Families
F) Non-occupant Loans on < 5 Family Dwellings (A B C & D)
G) Loans On Manufactured Home Dwelling (A B C & D)
Number
Average Value
Number
Average Value
Number
Average Value
Number
Average Value
Number
Average Value
Number
Average Value
Number
Average Value
LOANS ORIGINATED
109
$164,670
221
$183,488
774
$178,708
42
$81,991
2
$168,425
37
$151,814
3
$151,430
APPLICATIONS APPROVED, NOT ACCEPTED
9
$169,440
19
$247,895
85
$178,164
1
$36,880
0
$0
3
$150,227
1
$37,700
APPLICATIONS DENIED
6
$112,542
19
$146,082
153
$189,490
4
$48,660
0
$0
5
$161,574
5
$61,456
APPLICATIONS WITHDRAWN
12
$152,515
19
$169,587
131
$183,937
5
$29,082
0
$0
3
$113,377
2
$17,635
FILES CLOSED FOR INCOMPLETENESS
2
$165,780
4
$177,850
26
$201,895
1
$162,250
0
$0
1
$392,350
0
$0
Aggregated Statistics For Year 2008 (Based on 8 partial tracts)
A) FHA, FSA/RHS & VA Home Purchase Loans
B) Conventional Home Purchase Loans
C) Refinancings
D) Home Improvement Loans
F) Non-occupant Loans on < 5 Family Dwellings (A B C & D)
G) Loans On Manufactured Home Dwelling (A B C & D)
Number
Average Value
Number
Average Value
Number
Average Value
Number
Average Value
Number
Average Value
Number
Average Value
LOANS ORIGINATED
77
$147,766
269
$185,169
320
$164,944
50
$44,877
65
$154,064
4
$137,900
APPLICATIONS APPROVED, NOT ACCEPTED
5
$118,304
28
$196,599
27
$187,838
4
$61,480
1
$49,500
0
$0
APPLICATIONS DENIED
11
$143,538
20
$163,178
117
$155,679
22
$64,314
8
$181,910
1
$108,830
APPLICATIONS WITHDRAWN
6
$142,877
26
$179,765
70
$146,601
16
$103,482
4
$95,745
0
$0
FILES CLOSED FOR INCOMPLETENESS
3
$172,213
0
$0
18
$193,177
2
$22,045
3
$192,070
0
$0
Aggregated Statistics For Year 2007 (Based on 8 partial tracts)
A) FHA, FSA/RHS & VA Home Purchase Loans
B) Conventional Home Purchase Loans
C) Refinancings
D) Home Improvement Loans
E) Loans on Dwellings For 5+ Families
F) Non-occupant Loans on < 5 Family Dwellings (A B C & D)
G) Loans On Manufactured Home Dwelling (A B C & D)
Number
Average Value
Number
Average Value
Number
Average Value
Number
Average Value
Number
Average Value
Number
Average Value
Number
Average Value
LOANS ORIGINATED
31
$144,227
444
$164,330
308
$152,735
67
$64,563
2
$35,265
41
$101,907
2
$65,725
APPLICATIONS APPROVED, NOT ACCEPTED
0
$0
50
$182,375
50
$140,497
7
$47,927
0
$0
5
$106,362
0
$0
APPLICATIONS DENIED
8
$118,038
36
$221,671
135
$171,771
34
$67,176
0
$0
10
$153,952
2
$58,185
APPLICATIONS WITHDRAWN
0
$0
19
$197,324
90
$149,657
8
$174,681
0
$0
2
$187,165
0
$0
FILES CLOSED FOR INCOMPLETENESS
2
$171,070
6
$169,802
22
$158,347
4
$30,888
0
$0
4
$102,525
0
$0
Aggregated Statistics For Year 2006 (Based on 8 partial tracts)
A) FHA, FSA/RHS & VA Home Purchase Loans
B) Conventional Home Purchase Loans
C) Refinancings
D) Home Improvement Loans
F) Non-occupant Loans on < 5 Family Dwellings (A B C & D)
G) Loans On Manufactured Home Dwelling (A B C & D)
Number
Average Value
Number
Average Value
Number
Average Value
Number
Average Value
Number
Average Value
Number
Average Value
LOANS ORIGINATED
41
$131,750
522
$147,192
329
$138,306
73
$38,258
59
$102,633
1
$142,270
APPLICATIONS APPROVED, NOT ACCEPTED
0
$0
47
$177,636
60
$105,752
9
$46,471
7
$83,941
0
$0
APPLICATIONS DENIED
3
$119,700
36
$123,237
213
$133,402
38
$70,817
9
$60,356
1
$88,180
APPLICATIONS WITHDRAWN
6
$164,813
30
$156,226
135
$133,104
7
$68,906
5
$159,570
0
$0
FILES CLOSED FOR INCOMPLETENESS
0
$0
5
$394,506
24
$126,526
0
$0
1
$314,180
0
$0
Aggregated Statistics For Year 2005 (Based on 8 partial tracts)
A) FHA, FSA/RHS & VA Home Purchase Loans
B) Conventional Home Purchase Loans
C) Refinancings
D) Home Improvement Loans
F) Non-occupant Loans on < 5 Family Dwellings (A B C & D)
G) Loans On Manufactured Home Dwelling (A B C & D)
Number
Average Value
Number
Average Value
Number
Average Value
Number
Average Value
Number
Average Value
Number
Average Value
LOANS ORIGINATED
40
$123,895
556
$138,759
437
$148,939
76
$75,107
43
$98,042
1
$112,760
APPLICATIONS APPROVED, NOT ACCEPTED
1
$62,940
21
$177,382
67
$149,684
14
$25,552
1
$324,500
1
$83,590
APPLICATIONS DENIED
1
$74,410
51
$123,660
208
$130,598
40
$44,901
8
$104,622
3
$64,520
APPLICATIONS WITHDRAWN
0
$0
44
$139,817
162
$142,248
16
$128,219
7
$128,324
1
$72,770
FILES CLOSED FOR INCOMPLETENESS
0
$0
8
$110,765
36
$135,459
0
$0
0
$0
0
$0
Aggregated Statistics For Year 2004 (Based on 8 partial tracts)
A) FHA, FSA/RHS & VA Home Purchase Loans
B) Conventional Home Purchase Loans
C) Refinancings
D) Home Improvement Loans
E) Loans on Dwellings For 5+ Families
F) Non-occupant Loans on < 5 Family Dwellings (A B C & D)
G) Loans On Manufactured Home Dwelling (A B C & D)
Number
Average Value
Number
Average Value
Number
Average Value
Number
Average Value
Number
Average Value
Number
Average Value
Number
Average Value
LOANS ORIGINATED
35
$123,738
499
$148,864
566
$148,033
92
$60,597
1
$16,230
56
$123,158
3
$42,903
APPLICATIONS APPROVED, NOT ACCEPTED
0
$0
44
$139,254
82
$150,319
7
$51,367
0
$0
5
$106,904
0
$0
APPLICATIONS DENIED
0
$0
28
$170,242
218
$139,458
43
$65,548
0
$0
8
$93,838
0
$0
APPLICATIONS WITHDRAWN
0
$0
38
$133,966
160
$133,604
27
$142,558
0
$0
9
$36,672
0
$0
FILES CLOSED FOR INCOMPLETENESS
2
$44,670
6
$109,030
44
$142,542
2
$28,930
0
$0
2
$104,935
0
$0
Aggregated Statistics For Year 2003 (Based on 8 partial tracts)
A) FHA, FSA/RHS & VA Home Purchase Loans
B) Conventional Home Purchase Loans
C) Refinancings
D) Home Improvement Loans
E) Loans on Dwellings For 5+ Families
F) Non-occupant Loans on < 5 Family Dwellings (A B C & D)
Number
Average Value
Number
Average Value
Number
Average Value
Number
Average Value
Number
Average Value
Number
Average Value
LOANS ORIGINATED
46
$98,892
459
$143,662
1,232
$137,726
32
$50,241
2
$5,615,210
55
$98,685
APPLICATIONS APPROVED, NOT ACCEPTED
0
$0
30
$218,817
109
$137,268
2
$47,805
0
$0
4
$105,228
APPLICATIONS DENIED
0
$0
20
$115,628
243
$143,843
13
$41,717
0
$0
3
$51,867
APPLICATIONS WITHDRAWN
4
$116,492
29
$124,525
165
$141,820
3
$20,837
0
$0
2
$119,230
FILES CLOSED FOR INCOMPLETENESS
1
$115,050
11
$156,111
30
$148,762
2
$22,430
0
$0
4
$137,120
Aggregated Statistics For Year 2002 (Based on 4 partial tracts)
A) FHA, FSA/RHS & VA Home Purchase Loans
B) Conventional Home Purchase Loans
C) Refinancings
D) Home Improvement Loans
E) Loans on Dwellings For 5+ Families
F) Non-occupant Loans on < 5 Family Dwellings (A B C & D)
Number
Average Value
Number
Average Value
Number
Average Value
Number
Average Value
Number
Average Value
Number
Average Value
LOANS ORIGINATED
32
$82,047
125
$90,400
206
$87,319
19
$19,523
2
$71,315
24
$75,067
APPLICATIONS APPROVED, NOT ACCEPTED
0
$0
9
$96,896
21
$94,378
5
$18,176
0
$0
2
$46,240
APPLICATIONS DENIED
1
$80,310
10
$77,128
63
$79,509
8
$12,180
0
$0
2
$103,450
APPLICATIONS WITHDRAWN
0
$0
5
$84,440
42
$96,788
2
$7,835
0
$0
0
$0
FILES CLOSED FOR INCOMPLETENESS
2
$66,615
0
$0
39
$86,138
0
$0
0
$0
0
$0
Aggregated Statistics For Year 2001 (Based on 4 partial tracts)
A) FHA, FSA/RHS & VA Home Purchase Loans
B) Conventional Home Purchase Loans
C) Refinancings
D) Home Improvement Loans
F) Non-occupant Loans on < 5 Family Dwellings (A B C & D)
Number
Average Value
Number
Average Value
Number
Average Value
Number
Average Value
Number
Average Value
LOANS ORIGINATED
63
$83,706
112
$83,982
171
$89,491
31
$14,820
22
$62,714
APPLICATIONS APPROVED, NOT ACCEPTED
0
$0
6
$108,532
16
$72,581
4
$22,818
2
$22,520
APPLICATIONS DENIED
2
$101,095
13
$56,027
58
$74,683
13
$13,077
0
$0
APPLICATIONS WITHDRAWN
2
$102,560
5
$65,518
59
$86,001
4
$21,550
2
$75,360
FILES CLOSED FOR INCOMPLETENESS
0
$0
3
$91,840
17
$88,574
0
$0
0
$0
Aggregated Statistics For Year 2000 (Based on 4 partial tracts)
A) FHA, FSA/RHS & VA Home Purchase Loans
B) Conventional Home Purchase Loans
C) Refinancings
D) Home Improvement Loans
F) Non-occupant Loans on < 5 Family Dwellings (A B C & D)
Number
Average Value
Number
Average Value
Number
Average Value
Number
Average Value
Number
Average Value
LOANS ORIGINATED
30
$80,994
89
$83,602
38
$97,840
29
$14,472
8
$66,216
APPLICATIONS APPROVED, NOT ACCEPTED
0
$0
2
$163,245
10
$66,860
6
$21,387
0
$0
APPLICATIONS DENIED
2
$72,100
9
$49,139
34
$68,328
25
$17,623
0
$0
APPLICATIONS WITHDRAWN
2
$88,300
3
$90,580
17
$63,536
2
$14,215
0
$0
FILES CLOSED FOR INCOMPLETENESS
0
$0
0
$0
5
$104,406
0
$0
0
$0
Aggregated Statistics For Year 1999 (Based on 4 partial tracts)
A) FHA, FSA/RHS & VA Home Purchase Loans
B) Conventional Home Purchase Loans
C) Refinancings
D) Home Improvement Loans
E) Loans on Dwellings For 5+ Families
F) Non-occupant Loans on < 5 Family Dwellings (A B C & D)
2002 - 2018 National Fire Incident Reporting System (NFIRS) incidents
Based on the data from the years 2002 - 2018 the average number of fire incidents per year is 39. The highest number of fires - 69 took place in 2002, and the least - 26 in 2014. The data has a declining trend.
When looking into fire subcategories, the most reports belonged to: Outside Fires (66.9%), and Structure Fires (20.7%).
Fire incident types reported to NFIRS in Zip Code 66610


 Nearest zip codes: 66614, 66402, 66615, 66622, 66604, 66546.
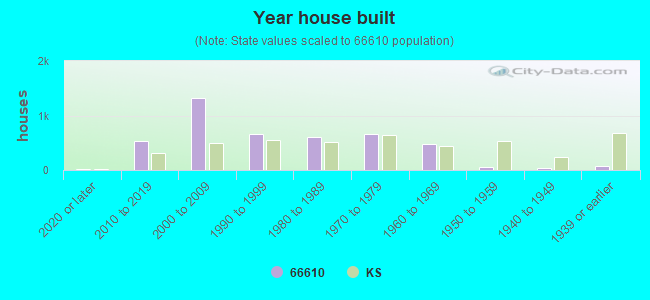


 Based on the data from the years 2002 - 2018 the average number of fire incidents per year is 39. The highest number of fires - 69 took place in 2002, and the least - 26 in 2014. The data has a declining trend.
 When looking into fire subcategories, the most reports belonged to: Outside Fires (66.9%), and Structure Fires (20.7%).