Estimated zip code population in 2022: 386 Zip code population in 2010: 410 Zip code population in 2000: 349
Houses and condos: 133 Renter-occupied apartments: 35
% of renters here:
26%
State:
32%
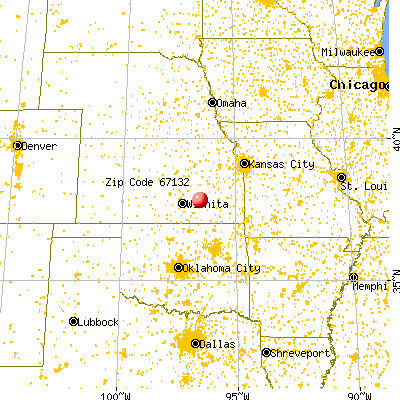
March 2022 cost of living index in zip code 67132: 78.9 (low, U.S. average is 100)
Land area: 86.8 sq. mi. Water area: 0.5 sq. mi.
Population density: 4 people per square mile
(very low).
OSM Map
General Map
Google Map
MSN Map
OSM Map
General Map
Google Map
MSN Map
OSM Map
General Map
Google Map
MSN Map
OSM Map
General Map
Google Map
MSN Map
Please wait while loading the map...
Real estate property taxes paid for housing units in 2022:
This zip code:
1.3% ($2,379)
Kansas:
1.2% ($2,578)
Median real estate property taxes paid for housing units with mortgages in 2022: $2,442 (1.3%) Median real estate property taxes paid for housing units with no mortgage in 2022: $2,186 (1.5%)
Business Search- 14 Million verified businesses
Males: 188
(48.9%)
Females: 197
(51.1%)
For population 25 years and over in 67132:
High school or higher: 98.8%
Bachelor's degree or higher: 25.4%
Graduate or professional degree: 2.6%
Mean travel time to work (commute): 45.7 minutes
For population 15 years and over in 67132:
Never married: 20.7%
Now married: 71.2%
Separated: 1.6%
Widowed: 2.6%
Divorced: 3.9%
Zip code 67132 compared to state average:
Unemployed percentage significantly below state average.
Black race population percentage significantly below state average.
Hispanic race population percentage significantly below state average.
Median age below state average.
Foreign-born population percentage significantly below state average.
Estimated median house/condo value in 2022: $182,808
67132:
$182,808
Kansas:
$206,600
According to our research of Kansas and other state lists, there was 1 registered sex offender living in 67132 zip code as of June 15, 2024. The ratio of all residents to sex offenders in zip code 67132 is 527 to 1. The ratio of registered sex offenders to all residents in this zip code is lower than the state average.
Median resident age:
This zip code:
30.2 years
Kansas median age:
37.6 years
Average household size:
This zip code:
2.9 people
Kansas:
2.4 people
Averages for the 2020 tax year for zip code 67132, filed in 2021:
Average Adjusted Gross Income (AGI) in 2020: $56,757 (Individual Income Tax Returns)
Here:
$56,757
State:
$72,721
Salary/wage: $49,715 (reported on 92.9% of returns)
Here:
$49,715
State:
$58,641
(% of AGI for various income ranges: 1043.3% for AGIs below $25k, 4206.7% for AGIs $25k-50k, 6147.5% for AGIs $50k-75k)
Taxable interest for individuals: $150 (reported on 28.6% of returns)
This zip code:
$150
Kansas:
$1,625
(% of AGI for various income ranges: 15.0% for AGIs $50k-75k)
Percentage of individuals using paid preparers for their 2020 taxes: 100.0%
Here:
100%
State:
95%
(% for various income ranges: 100.0% for AGIs below $25k, 100.0% for AGIs $25k-50k, 100.0% for AGIs $50k-75k, 100.0% for AGIs $100k-200k)
Averages for the 2012 tax year for zip code 67132, filed in 2013:
Average Adjusted Gross Income (AGI) in 2012: $47,115 (Individual Income Tax Returns)
Here:
$47,115
State:
$60,095
Salary/wage: $42,008 (reported on 92.3% of returns)
Here:
$42,008
State:
$48,770
(% of AGI for various income ranges: 68.7% for AGIs below $25k, 77.9% for AGIs $25k-50k, 87.8% for AGIs $50k-75k, 84.3% for AGIs $75k-100k)
Taxable interest for individuals: $225 (reported on 30.8% of returns)
This zip code:
$225
Kansas:
$1,506
Total itemized deductions: $14,550 (22% of AGI, reported on 30.8% of returns)
Here:
$14,550
State:
$23,678
Here:
22.4% of AGI
State:
18.9% of AGI
Taxes paid: $5,200 (reported on 30.8% of returns)
67132:
$5,200
State:
$9,548
Earned income credit: $2,350 (reported on 15.4% of returns)
Here:
$2,350
State:
$2,212
(% of AGI for various income ranges: 7.8% for AGIs below $25k)
Percentage of individuals using paid preparers for their 2012 taxes: 69.2%
Here:
69%
State:
56%
(% for various income ranges: 60.0% for AGIs below $25k, 133.3% for AGIs $25k-50k, 66.7% for AGIs $75k-100k)
Averages for the 2004 tax year for zip code 67132, filed in 2005:
Average Adjusted Gross Income (AGI) in 2004: $36,053 (Individual Income Tax Returns)
Here:
$36,053
State:
$45,726
Salary/wage: $34,748 (reported on 86.2% of returns)
Here:
$34,748
State:
$40,112
(% of AGI for various income ranges: 92.3% for AGIs below $10k, 76.9% for AGIs $10k-25k, 84.9% for AGIs $25k-50k, 89.8% for AGIs $50k-75k, 74.1% for AGIs $75k-100k)
Taxable interest for individuals: $672 (reported on 42.1% of returns)
This zip code:
$672
Kansas:
$1,749
Taxable dividends: $242 (reported on 21.7% of returns)
Here:
$242
State:
$3,066
Net capital gain/loss: +$115 (reported on 17.1% of returns)
Here:
+$115
State:
+$7,555
Total itemized deductions: $12,676 (24% of AGI, reported on 24.3% of returns)
Here:
$12,676
State:
$18,779
Here:
23.9% of AGI
State:
20.5% of AGI
Charity contributions deductions: $917 (2% of AGI, reported on 15.8% of returns)
Here:
$917
State:
$3,892
Here:
1.7% of AGI
State:
4.0% of AGI
Total tax: $3,440 (reported on 71.7% of returns)
67132:
$3,440
State:
$7,203
(% of AGI for various income ranges: 2.9% for AGIs $10k-25k, 5.6% for AGIs $25k-50k, 7.1% for AGIs $50k-75k, 10.5% for AGIs $75k-100k)
Earned income credit: $1,643 (reported on 9.2% of returns)
Here:
$1,643
State:
$1,674
Percentage of individuals using paid preparers for their 2004 taxes: 69.1%
Here:
69%
State:
63%
(% for various income ranges: 71.4% for AGIs below $10k, 60.6% for AGIs $10k-25k, 75.5% for AGIs $25k-50k, 64.3% for AGIs $50k-75k, 71.4% for AGIs $75k-100k)
Household received Food Stamps/SNAP in the past 12 months: 11 Household did not receive Food Stamps/SNAP in the past 12 months: 123
Women who had a birth in the past 12 months: 14 (14 now married, 0 unmarried) Women who did not have a birth in the past 12 months: 84 (52 now married, 31 unmarried)
Housing units in zip code 67132 with a mortgage: 74 (12 second mortgage, 12 both second mortgage and home equity loan) Houses without a mortgage: 9
Median monthly owner costs for units with a mortgage: $1,553 Median monthly owner costs for units without a mortgage: $597
Residents with income below the poverty level in 2022:
This zip code:
6.3%
Whole state:
12.0%
Residents with income below 50% of the poverty level in 2022:
This zip code:
6.3%
Whole state:
6.4%
Median number of rooms in houses and condos:
Here:
6.2
State:
6.9
Median number of rooms in apartments:
Here:
5.3
State:
4.4
Notable locations in this zip code not listed on our city pages
Size of family households: 40 2-persons, 18 3-persons, 33 4-persons, 14 5-persons, 4 6-persons
Size of nonfamily households: 20 1-person
115 married couples with children.
20 single-parent households (7 men, 13 women).
99.7% of residents of 67132 zip code speak English at home.
Foreign born population: 0 (0.0%)
:
0.0%
Whole state:
7.1%
79%American
12%German
5%Italian
2%Scotch-Irish
1%Irish
Facilities with environmental interests located in this zip code:
MOBIL PIPE LINE CO (RURAL in ROSALIA, KS)
(Resource Conservation and Recovery Act (tracking hazardous waste)) Organizations: MOBIL PIPE LINE CO. (CONTACT/OWNER)
LLOYD WILLHITE (RURAL ROUTE 1 in ROSALIA, KS)
National Pollutant Discharge Elimination System NON-MAJOR (Tracking pollutant discharge elimination systems) - permit Business SIC classification: HOGS Alternative names: WILLHITE, LLOYD
57.7%Bottled, tank, or LP gas
32.3%Electricity
11.5%Wood
Population in 1990: 545.
Place of birth for U.S.-born residents:
This state: 332
Northeast: 13
Midwest: 18
South: 14
West: 7
60% of the 67132 zip code residents lived in the same house 5 years ago. Out of people who lived in different houses, 63% lived in this county. Out of people who lived in different counties, 50% lived in Kansas.
98% of the 67132 zip code residents lived in the same house 1 year ago. Out of people who lived in different houses, 20% moved from this county. Out of people who lived in different houses, 100% moved from different county within same state.
Private vs. public school enrollment:
Students in private schools in grades 1 to 8 (elementary and middle school): 3
Here:
7.3%
Kansas:
14.1%
Students in private schools in grades 9 to 12 (high school): 3
Here:
9.1%
Kansas:
10.8%
Students in private undergraduate colleges: 11
Here:
68.7%
Kansas:
15.4%
Occupation by median earnings in the past 12 months ($)
148,946Production occupations
91,568Sales and related occupations
87,617Installation, maintenance, and repair occupations
76,953Construction and extraction occupations
46,847Office and administrative support occupations
33,428Education, training, and library occupations
Companies with federal contracts located in this zip code:
RITTER ENGINEERING (2583 SE GRANT RD in ROSALIA, KS; small business)
$2,790 with Army for Land Surveys, Cadastral Services (non-construction). Taking place in AR. Signed on 2004-08-16. Completion date: 2004-08-23.
Top industries in this zip code by the number of employees in 2005:
Administrative and Support and Waste Management and Remediation Services: Landscaping Services (1-4 employees: 1 establishment)
Professional, Scientific, and Technical Services: Engineering Services (1-4: 1)
Real Estate and Rental and Leasing: Lessors of Residential Buildings and Dwellings (1-4: 1)
Accommodation and Food Services: Full-Service Restaurants (1-4: 1)
Home Mortgage Disclosure Act Aggregated Statistics For Year 2009 (Based on 2 partial tracts)
A) FHA, FSA/RHS & VA Home Purchase Loans
B) Conventional Home Purchase Loans
C) Refinancings
D) Home Improvement Loans
F) Non-occupant Loans on < 5 Family Dwellings (A B C & D)
G) Loans On Manufactured Home Dwelling (A B C & D)
Number
Average Value
Number
Average Value
Number
Average Value
Number
Average Value
Number
Average Value
Number
Average Value
LOANS ORIGINATED
3
$112,580
4
$79,292
17
$105,182
6
$15,453
2
$46,625
4
$53,240
APPLICATIONS APPROVED, NOT ACCEPTED
0
$0
1
$100,470
2
$114,630
1
$14,430
0
$0
1
$73,750
APPLICATIONS DENIED
1
$39,010
1
$14,430
8
$143,119
2
$19,505
0
$0
2
$124,380
APPLICATIONS WITHDRAWN
1
$54,510
1
$32,600
3
$127,633
0
$0
0
$0
1
$59,850
FILES CLOSED FOR INCOMPLETENESS
0
$0
1
$281,360
0
$0
0
$0
0
$0
0
$0
Aggregated Statistics For Year 2008 (Based on 2 partial tracts)
A) FHA, FSA/RHS & VA Home Purchase Loans
B) Conventional Home Purchase Loans
C) Refinancings
D) Home Improvement Loans
F) Non-occupant Loans on < 5 Family Dwellings (A B C & D)
G) Loans On Manufactured Home Dwelling (A B C & D)
Number
Average Value
Number
Average Value
Number
Average Value
Number
Average Value
Number
Average Value
Number
Average Value
LOANS ORIGINATED
7
$99,437
10
$102,899
19
$313,102
8
$28,324
2
$65,730
9
$72,144
APPLICATIONS APPROVED, NOT ACCEPTED
0
$0
2
$49,835
1
$88,710
1
$4,010
0
$0
2
$49,835
APPLICATIONS DENIED
1
$63,330
4
$82,900
9
$104,504
2
$113,295
1
$49,430
4
$81,162
APPLICATIONS WITHDRAWN
0
$0
1
$118,640
5
$110,514
1
$135,740
0
$0
1
$49,970
FILES CLOSED FOR INCOMPLETENESS
0
$0
0
$0
1
$60,390
0
$0
0
$0
0
$0
Aggregated Statistics For Year 2007 (Based on 2 partial tracts)
A) FHA, FSA/RHS & VA Home Purchase Loans
B) Conventional Home Purchase Loans
C) Refinancings
D) Home Improvement Loans
F) Non-occupant Loans on < 5 Family Dwellings (A B C & D)
G) Loans On Manufactured Home Dwelling (A B C & D)
Number
Average Value
Number
Average Value
Number
Average Value
Number
Average Value
Number
Average Value
Number
Average Value
LOANS ORIGINATED
1
$118,100
14
$95,696
11
$85,261
7
$33,591
3
$82,477
6
$65,998
APPLICATIONS APPROVED, NOT ACCEPTED
0
$0
3
$58,070
2
$90,715
2
$30,595
1
$34,470
2
$66,535
APPLICATIONS DENIED
1
$45,160
6
$78,512
12
$105,700
3
$58,783
1
$32,870
5
$71,076
APPLICATIONS WITHDRAWN
0
$0
2
$59,720
5
$99,558
1
$52,100
0
$0
1
$47,290
FILES CLOSED FOR INCOMPLETENESS
0
$0
0
$0
1
$81,760
0
$0
0
$0
0
$0
Aggregated Statistics For Year 2006 (Based on 2 partial tracts)
A) FHA, FSA/RHS & VA Home Purchase Loans
B) Conventional Home Purchase Loans
C) Refinancings
D) Home Improvement Loans
F) Non-occupant Loans on < 5 Family Dwellings (A B C & D)
G) Loans On Manufactured Home Dwelling (A B C & D)
Number
Average Value
Number
Average Value
Number
Average Value
Number
Average Value
Number
Average Value
Number
Average Value
LOANS ORIGINATED
5
$98,704
12
$93,498
17
$69,174
5
$26,240
3
$63,237
4
$63,060
APPLICATIONS APPROVED, NOT ACCEPTED
0
$0
2
$75,485
4
$89,245
1
$28,060
0
$0
1
$58,520
APPLICATIONS DENIED
1
$44,890
6
$68,893
15
$93,306
4
$33,532
0
$0
5
$53,868
APPLICATIONS WITHDRAWN
0
$0
2
$137,205
6
$92,585
1
$8,550
1
$75,880
1
$73,750
FILES CLOSED FOR INCOMPLETENESS
0
$0
0
$0
2
$104,075
0
$0
0
$0
0
$0
Aggregated Statistics For Year 2005 (Based on 2 partial tracts)
A) FHA, FSA/RHS & VA Home Purchase Loans
B) Conventional Home Purchase Loans
C) Refinancings
D) Home Improvement Loans
F) Non-occupant Loans on < 5 Family Dwellings (A B C & D)
G) Loans On Manufactured Home Dwelling (A B C & D)
Number
Average Value
Number
Average Value
Number
Average Value
Number
Average Value
Number
Average Value
Number
Average Value
LOANS ORIGINATED
2
$107,950
14
$68,269
20
$81,844
6
$35,092
3
$129,147
6
$63,995
APPLICATIONS APPROVED, NOT ACCEPTED
0
$0
4
$91,515
3
$104,297
1
$13,090
0
$0
1
$61,460
APPLICATIONS DENIED
1
$36,870
7
$66,761
22
$97,710
6
$35,092
0
$0
5
$90,634
APPLICATIONS WITHDRAWN
1
$43,020
3
$79,180
11
$109,066
2
$128,655
1
$56,380
1
$79,890
FILES CLOSED FOR INCOMPLETENESS
0
$0
1
$131,730
2
$103,675
0
$0
0
$0
1
$63,590
Aggregated Statistics For Year 2004 (Based on 2 partial tracts)
A) FHA, FSA/RHS & VA Home Purchase Loans
B) Conventional Home Purchase Loans
C) Refinancings
D) Home Improvement Loans
F) Non-occupant Loans on < 5 Family Dwellings (A B C & D)
G) Loans On Manufactured Home Dwelling (A B C & D)
Number
Average Value
Number
Average Value
Number
Average Value
Number
Average Value
Number
Average Value
Number
Average Value
LOANS ORIGINATED
1
$99,130
12
$90,425
23
$103,046
6
$39,233
2
$100,335
3
$55,400
APPLICATIONS APPROVED, NOT ACCEPTED
0
$0
2
$52,240
5
$92,558
1
$33,400
0
$0
3
$58,963
APPLICATIONS DENIED
0
$0
5
$42,272
19
$94,617
4
$27,790
0
$0
7
$63,517
APPLICATIONS WITHDRAWN
0
$0
1
$134,940
8
$94,789
1
$28,320
0
$0
1
$47,560
FILES CLOSED FOR INCOMPLETENESS
0
$0
1
$78,560
4
$96,992
0
$0
0
$0
0
$0
Aggregated Statistics For Year 2003 (Based on 2 partial tracts)
A) FHA, FSA/RHS & VA Home Purchase Loans
B) Conventional Home Purchase Loans
C) Refinancings
D) Home Improvement Loans
F) Non-occupant Loans on < 5 Family Dwellings (A B C & D)
Number
Average Value
Number
Average Value
Number
Average Value
Number
Average Value
Number
Average Value
LOANS ORIGINATED
2
$112,360
14
$81,649
40
$83,674
6
$20,530
2
$29,660
APPLICATIONS APPROVED, NOT ACCEPTED
0
$0
2
$76,420
8
$81,061
2
$15,765
0
$0
APPLICATIONS DENIED
0
$0
7
$57,753
22
$87,107
2
$29,525
1
$11,490
APPLICATIONS WITHDRAWN
0
$0
1
$48,360
9
$90,937
0
$0
1
$32,330
FILES CLOSED FOR INCOMPLETENESS
0
$0
0
$0
2
$111,020
0
$0
0
$0
Aggregated Statistics For Year 2002 (Based on 2 partial tracts)
A) FHA, FSA/RHS & VA Home Purchase Loans
B) Conventional Home Purchase Loans
C) Refinancings
D) Home Improvement Loans
F) Non-occupant Loans on < 5 Family Dwellings (A B C & D)
Number
Average Value
Number
Average Value
Number
Average Value
Number
Average Value
Number
Average Value
LOANS ORIGINATED
3
$79,003
14
$71,495
31
$83,556
6
$20,218
3
$34,737
APPLICATIONS APPROVED, NOT ACCEPTED
0
$0
3
$61,367
8
$90,380
1
$12,830
0
$0
APPLICATIONS DENIED
0
$0
7
$43,630
15
$81,175
1
$13,360
1
$25,920
APPLICATIONS WITHDRAWN
1
$38,210
1
$99,670
7
$80,121
1
$10,150
0
$0
FILES CLOSED FOR INCOMPLETENESS
0
$0
1
$72,680
2
$91,650
0
$0
0
$0
Aggregated Statistics For Year 2001 (Based on 2 partial tracts)
A) FHA, FSA/RHS & VA Home Purchase Loans
B) Conventional Home Purchase Loans
C) Refinancings
D) Home Improvement Loans
F) Non-occupant Loans on < 5 Family Dwellings (A B C & D)
Number
Average Value
Number
Average Value
Number
Average Value
Number
Average Value
Number
Average Value
LOANS ORIGINATED
2
$94,855
12
$67,134
38
$75,104
7
$18,666
3
$28,057
APPLICATIONS APPROVED, NOT ACCEPTED
0
$0
4
$84,635
3
$90,847
1
$30,460
0
$0
APPLICATIONS DENIED
1
$54,510
8
$51,570
13
$65,813
3
$17,990
0
$0
APPLICATIONS WITHDRAWN
0
$0
2
$96,860
9
$91,056
1
$6,680
0
$0
FILES CLOSED FOR INCOMPLETENESS
0
$0
1
$29,930
2
$77,890
0
$0
0
$0
Aggregated Statistics For Year 2000 (Based on 2 partial tracts)
A) FHA, FSA/RHS & VA Home Purchase Loans
B) Conventional Home Purchase Loans
C) Refinancings
D) Home Improvement Loans
F) Non-occupant Loans on < 5 Family Dwellings (A B C & D)
Number
Average Value
Number
Average Value
Number
Average Value
Number
Average Value
Number
Average Value
LOANS ORIGINATED
2
$86,305
12
$62,324
12
$69,918
6
$20,263
1
$62,790
APPLICATIONS APPROVED, NOT ACCEPTED
0
$0
4
$54,710
3
$65,910
2
$28,190
0
$0
APPLICATIONS DENIED
1
$71,340
12
$41,015
10
$49,405
5
$13,680
1
$19,510
APPLICATIONS WITHDRAWN
0
$0
1
$43,550
6
$68,803
0
$0
0
$0
FILES CLOSED FOR INCOMPLETENESS
0
$0
0
$0
1
$56,910
0
$0
0
$0
Aggregated Statistics For Year 1999 (Based on 1 partial tract)
A) FHA, FSA/RHS & VA Home Purchase Loans
B) Conventional Home Purchase Loans
C) Refinancings
D) Home Improvement Loans
F) Non-occupant Loans on < 5 Family Dwellings (A B C & D)
Detailed PMIC statistics for the following Tracts:0201.00
2002 - 2018 National Fire Incident Reporting System (NFIRS) incidents
Based on the data from the years 2002 - 2018 the average number of fire incidents per year is 7. The highest number of reported fire incidents - 33 took place in 2006, and the least - 0 in 2009. The data has a dropping trend.
When looking into fire subcategories, the most incidents belonged to: Outside Fires (81.2%), and Structure Fires (10.3%).
Fire incident types reported to NFIRS in Zip Code 67132


 Nearest zip codes: 66842, 67012, 67042, 67074, 67045, 67122.


 Based on the data from the years 2002 - 2018 the average number of fire incidents per year is 7. The highest number of reported fire incidents - 33 took place in 2006, and the least - 0 in 2009. The data has a dropping trend.
 When looking into fire subcategories, the most incidents belonged to: Outside Fires (81.2%), and Structure Fires (10.3%).