Estimated zip code population in 2022: 434 Zip code population in 2010: 485 Zip code population in 2000: 497
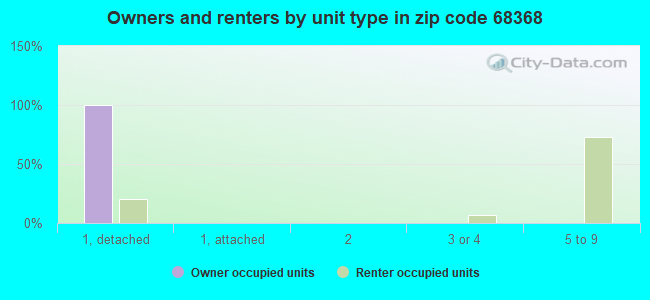
Houses and condos: 168 Renter-occupied apartments: 15
% of renters here:
10%
State:
34%
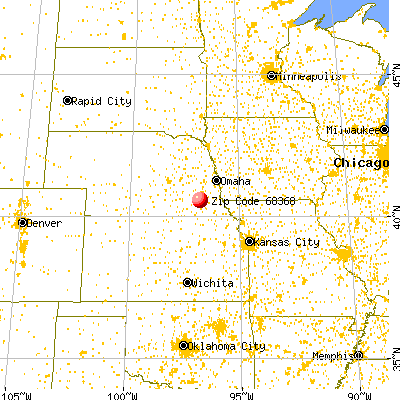
March 2022 cost of living index in zip code 68368: 75.8 (low, U.S. average is 100)
Land area: 35.6 sq. mi. Water area: 0.3 sq. mi.
Population density: 12 people per square mile
(very low).
OSM Map
General Map
Google Map
MSN Map
OSM Map
General Map
Google Map
MSN Map
OSM Map
General Map
Google Map
MSN Map
OSM Map
General Map
Google Map
MSN Map
Please wait while loading the map...
Real estate property taxes paid for housing units in 2022:
This zip code:
1.8% ($5,721)
Nebraska:
1.4% ($3,313)
Median real estate property taxes paid for housing units with mortgages in 2022: $5,612 (1.8%) Median real estate property taxes paid for housing units with no mortgage in 2022: $5,892 (1.3%)
Business Search- 14 Million verified businesses
Males: 250
(57.5%)
Females: 184
(42.5%)
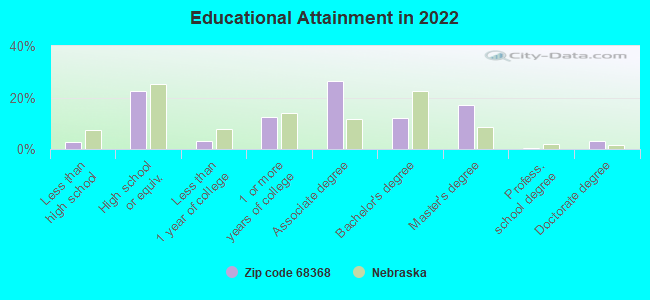
For population 25 years and over in 68368:
High school or higher: 98.6%
Bachelor's degree or higher: 33.3%
Graduate or professional degree: 21.2%
Mean travel time to work (commute): 30.7 minutes
For population 15 years and over in 68368:
Never married: 18.3%
Now married: 74.5%
Separated: 0.0%
Widowed: 0.5%
Divorced: 6.6%
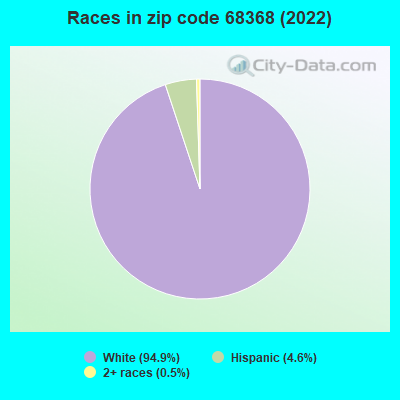
Zip code 68368 compared to state average:
Unemployed percentage significantly below state average.
Black race population percentage significantly below state average.
Hispanic race population percentage below state average.
Foreign-born population percentage significantly below state average.
Renting percentage significantly below state average.
Length of stay since moving in significantly above state average.
Number of college students significantly below state average.
Averages for the 2020 tax year for zip code 68368, filed in 2021:
Average Adjusted Gross Income (AGI) in 2020: $73,842 (Individual Income Tax Returns)
Here:
$73,842
State:
$73,874
Salary/wage: $63,239 (reported on 88.5% of returns)
Here:
$63,239
State:
$58,268
(% of AGI for various income ranges: 1350.0% for AGIs below $25k, 2918.0% for AGIs $25k-50k, 7140.0% for AGIs $50k-75k, 10486.7% for AGIs $75k-100k, 24193.3% for AGIs $100k-200k)
Taxable interest for individuals: $400 (reported on 42.3% of returns)
This zip code:
$400
Nebraska:
$1,748
(% of AGI for various income ranges: 50.0% for AGIs $25k-50k, 23.3% for AGIs $50k-75k, 40.0% for AGIs $100k-200k)
Ordinary dividends: $860 (reported on 19.2% of returns)
Here:
$860
State:
$7,841
(% of AGI for various income ranges: 30.0% for AGIs $25k-50k, 93.3% for AGIs $100k-200k)
Net capital gain/loss in AGI: +$3,467 (reported on 23.1% of returns)
Here:
+$3,467
State:
+$21,703
(% of AGI for various income ranges: 84.0% for AGIs $25k-50k, 553.3% for AGIs $75k-100k)
Profit/loss from business: +$9,100 (reported on 19.2% of returns)
Here:
+$9,100
State:
+$11,239
(% of AGI for various income ranges: 430.0% for AGIs below $25k, 943.3% for AGIs $50k-75k)
Percentage of individuals using paid preparers for their 2020 taxes: 100.0%
Here:
100%
State:
95%
(% for various income ranges: 100.0% for AGIs below $25k, 100.0% for AGIs $25k-50k, 100.0% for AGIs $50k-75k, 100.0% for AGIs $75k-100k, 100.0% for AGIs $100k-200k)
Averages for the 2012 tax year for zip code 68368, filed in 2013:
Average Adjusted Gross Income (AGI) in 2012: $61,661 (Individual Income Tax Returns)
Here:
$61,661
State:
$60,572
Salary/wage: $49,124 (reported on 91.3% of returns)
Here:
$49,124
State:
$47,046
(% of AGI for various income ranges: 77.7% for AGIs below $25k, 67.1% for AGIs $25k-50k, 83.5% for AGIs $50k-75k, 91.3% for AGIs $75k-100k, 58.3% for AGIs $100k-200k)
Taxable interest for individuals: $560 (reported on 43.5% of returns)
This zip code:
$560
Nebraska:
$1,535
(% of AGI for various income ranges: 1.1% for AGIs $25k-50k, 0.4% for AGIs $50k-75k, 0.4% for AGIs $100k-200k)
Ordinary dividends: $817 (reported on 26.1% of returns)
Here:
$817
State:
$5,776
Net capital gain/loss in AGI: +$2,150 (reported on 17.4% of returns)
Here:
+$2,150
State:
+$16,171
Profit/loss from business: +$8,320 (reported on 21.7% of returns)
Here:
+$8,320
State:
+$9,897
Total itemized deductions: $20,400 (21% of AGI, reported on 39.1% of returns)
Here:
$20,400
State:
$23,343
Here:
20.8% of AGI
State:
18.7% of AGI
(% of AGI for various income ranges: 28.5% for AGIs $25k-50k, 14.6% for AGIs $75k-100k, 15.5% for AGIs $100k-200k)
Charity contributions: $3,143 (reported on 30.4% of returns)
Here:
$3,143
State:
$4,921
Taxes paid: $8,767 (reported on 39.1% of returns)
68368:
$8,767
State:
$9,758
(% of AGI for various income ranges: 11.5% for AGIs $25k-50k, 5.8% for AGIs $75k-100k, 7.2% for AGIs $100k-200k)
Percentage of individuals using paid preparers for their 2012 taxes: 69.6%
Here:
70%
State:
57%
(% for various income ranges: 66.7% for AGIs below $25k, 66.7% for AGIs $25k-50k, 60.0% for AGIs $50k-75k, 100.0% for AGIs $75k-100k, 66.7% for AGIs $100k-200k)
Averages for the 2004 tax year for zip code 68368, filed in 2005:
Average Adjusted Gross Income (AGI) in 2004: $47,761 (Individual Income Tax Returns)
Here:
$47,761
State:
$44,271
Salary/wage: $48,261 (reported on 88.3% of returns)
Here:
$48,261
State:
$38,230
(% of AGI for various income ranges: 85.0% for AGIs below $10k, 78.8% for AGIs $10k-25k, 80.9% for AGIs $25k-50k, 95.3% for AGIs $50k-75k, 91.9% for AGIs $75k-100k, 89.1% for AGIs over 100k)
Taxable interest for individuals: $434 (reported on 57.3% of returns)
This zip code:
$434
Nebraska:
$1,759
(% of AGI for various income ranges: 2.1% for AGIs $10k-25k, 0.6% for AGIs $25k-50k, 0.3% for AGIs $50k-75k, 0.5% for AGIs $75k-100k, 0.3% for AGIs over 100k)
Taxable dividends: $326 (reported on 21.6% of returns)
Here:
$326
State:
$2,804
(% of AGI for various income ranges: 0.6% for AGIs $10k-25k, 0.1% for AGIs $50k-75k, 0.4% for AGIs $75k-100k)
Net capital gain/loss: +$3,026 (reported on 18.3% of returns)
Here:
+$3,026
State:
+$7,887
Profit/loss from business: +$3,342 (reported on 17.8% of returns)
Here:
+$3,342
State:
+$7,743
Total itemized deductions: $20,096 (28% of AGI, reported on 39.0% of returns)
Here:
$20,096
State:
$18,692
Here:
28.2% of AGI
State:
21.1% of AGI
(% of AGI for various income ranges: 32.3% for AGIs $25k-50k, 17.9% for AGIs $50k-75k, 11.1% for AGIs $75k-100k, 12.8% for AGIs over 100k)
Charity contributions deductions: $2,238 (3% of AGI, reported on 29.6% of returns)
Here:
$2,238
State:
$3,500
Here:
2.8% of AGI
State:
3.8% of AGI
(% of AGI for various income ranges: 1.6% for AGIs $25k-50k, 1.1% for AGIs $50k-75k, 1.9% for AGIs $75k-100k, 1.6% for AGIs over 100k)
Total tax: $5,779 (reported on 80.8% of returns)
68368:
$5,779
State:
$6,550
(% of AGI for various income ranges: 2.0% for AGIs below $10k, 5.4% for AGIs $10k-25k, 5.8% for AGIs $25k-50k, 6.9% for AGIs $50k-75k, 9.4% for AGIs $75k-100k, 20.0% for AGIs over 100k)
Earned income credit: $1,600 (reported on 7.0% of returns)
Here:
$1,600
State:
$1,643
Percentage of individuals using paid preparers for their 2004 taxes: 71.4%
Here:
71%
State:
62%
(% for various income ranges: 50.0% for AGIs below $10k, 73.8% for AGIs $10k-25k, 78.4% for AGIs $25k-50k, 68.1% for AGIs $50k-75k, 110.0% for AGIs $75k-100k)
Household received Food Stamps/SNAP in the past 12 months: 0 Household did not receive Food Stamps/SNAP in the past 12 months: 151
Women who had a birth in the past 12 months: 5 (0 now married, 4 unmarried) Women who did not have a birth in the past 12 months: 74 (64 now married, 10 unmarried)
Housing units in zip code 68368 with a mortgage: 116 (6 second mortgage, 4 both second mortgage and home equity loan) Median monthly owner costs for units with a mortgage: $1,925 Median monthly owner costs for units without a mortgage: $847
Residents with income below the poverty level in 2022:
This zip code:
4.8%
Whole state:
11.2%
Residents with income below 50% of the poverty level in 2022:
This zip code:
1.9%
Whole state:
6.1%
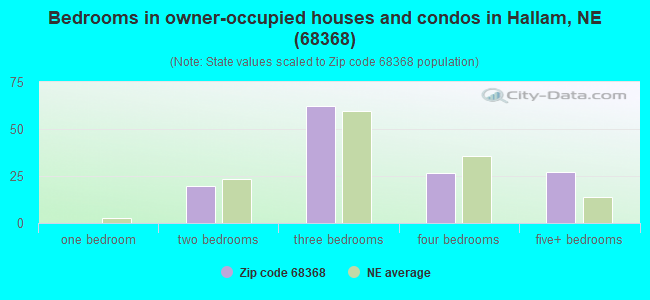
Median number of rooms in houses and condos:
Here:
7.1
State:
7.1
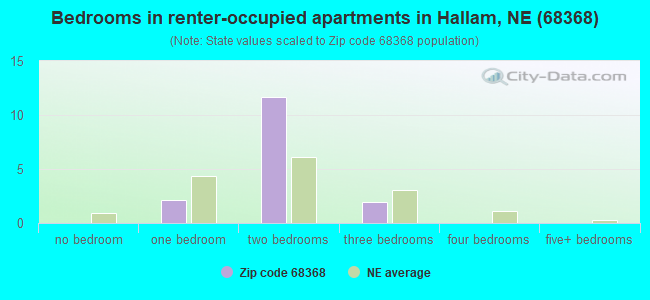
Median number of rooms in apartments:
Here:
2.9
State:
4.2
Notable locations in this zip code not listed on our city pages
Notable locations in zip code 68368: Hallam (A), Hallam Grain Company Elevator (B), Sheldon (C), Area Two Campground (D), Area One Campground (E), Hallam Volunteer Fire and Rescue Department (F). Display/hide their locations on the map
Churches in zip code 68368 include: United Methodist Church of Hallam (A), Congregational United Church of Christ (B). Display/hide their locations on the map
Reservoirs: Salt Creek Reservoir 6-A (A), Salt Creek Reservoir 14-A (B), Salt Creek Reservoir 6-4 (C), Salt Creek Reservoir 13-B (D), Salt Creek Reservoir 13-A (E), Salt Creek Reservoir 14-1 (F), Olive Creek Lake (G). Display/hide their locations on the map
Size of family households: 46 2-persons, 33 3-persons, 50 4-persons, 2 5-persons, 1 6-persons
Size of nonfamily households: 13 1-person, 3 2-persons
72 married couples with children.
21 single-parent households (20 men, 1 women).
98.0% of residents of 68368 zip code speak English at home.
1.5% of residents speak Spanish at home (100% very well).
Foreign born population: 1 (0.4%) (0.0% of them are naturalized citizens)
:
0.4%
Whole state:
7.2%
50%Honduras
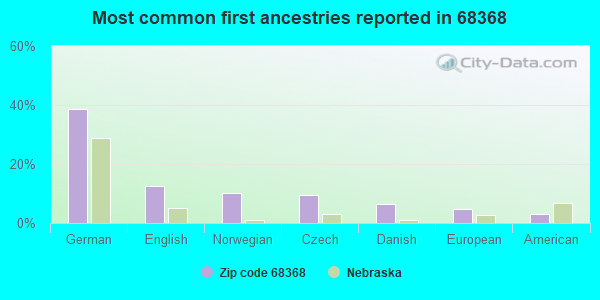
39%German
13%English
10%Norwegian
9%Czech
6%Danish
5%European
3%American
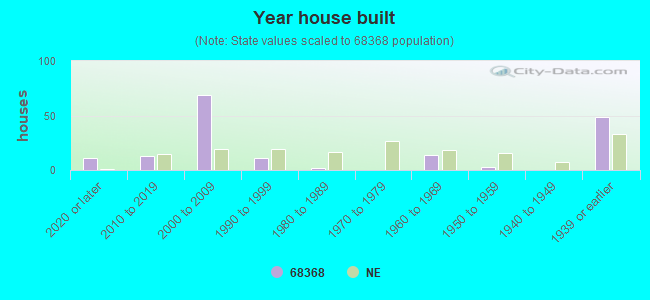
Year of entry for the foreign-born population
02010 or later
12000 to 2009
01990 to 1999
7Before 1990
Facilities with environmental interests located in this zip code:
HALLAM WASTEWATER TREATMENT (1/4 MI S OF HALLAM ON RR RD in HALLAM, NE)
STATE MASTER (Nebraska tracking) - OPERATOR CERTIFICATION, National Pollutant Discharge Elimination System Permit, WASTEWATER FACILITY National Pollutant Discharge Elimination System NON-MAJOR (Tracking pollutant discharge elimination systems) - permit Business SIC classification: SEWERAGE SYSTEMS Organizations: DAN EBBERS, UTILITY SUPER (CONTACT/OPERATOR)
Alternative names: HALLAM WWTF
MCCABE INDUSTRIAL MINERALS INCORPORATED (4500 SOUTH PELLA ROAD in HALLAM, NE)
AIR MINOR (AIRS/AFS) STATE MASTER (Nebraska tracking) - AIR PROGRAM CRITERIA AND HAZARDOUS AIR POLLUTANT INVENTORY (Inventory of air pollution sources) Business SIC classification: MINERALS AND EARTHS, GROUND OR OTHERWISE TREATED Business NAICS classification: GROUND OR TREATED MINERAL AND EARTH MANUFACTURING.
HALLAM GRAIN CO (400 MAIN ST in HALLAM, NE)
COMPLIANCE ACTIVITY (Tracking inspections of insecticide, fungicide, and rodenticide, and toxic substances) STATE MASTER (Nebraska tracking) - AIR PROGRAM, -061499-99-0009, LEAKING STORAGE TANK, -AP6019,
FARMERS CO-OP (415 MAIN ST in HALLAM, NE)
AIR MINOR (AIRS/AFS) CRITERIA AND HAZARDOUS AIR POLLUTANT INVENTORY (Inventory of air pollution sources) Business SIC classification: GRAIN AND FIELD BEANS Alternative names: HALLAM GRAIN COMPANY, MELVIN HOLSING
MAYER AREA SPRAY (W HWY 77 in HALLAM, NE)
(Resource Conservation and Recovery Act (tracking hazardous waste)) Business NAICS classification: SOIL PREPARATION, PLANTING, AND CULTIVATING.
HALLAM GRAIN CO (RR in HALLAM, NE)
COMPLIANCE ACTIVITY (Tracking inspections of insecticide, fungicide, and rodenticide, and toxic substances)
HALLAM NUCLEAR POWER FACILITY (NE 1/4 SEC 19 T7N R6E in HALLAM, NE)
SUPERFUND (Superfund database)
Housing units lacking complete kitchen facilities: 4.1%
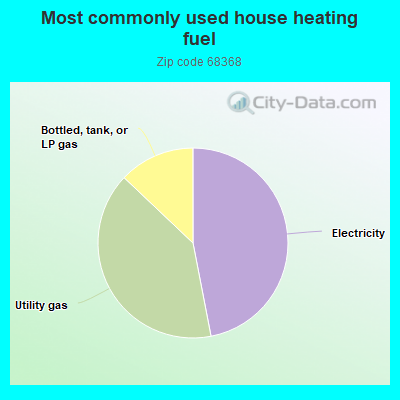
47.3%Electricity
40.4%Utility gas
13.0%Bottled, tank, or LP gas
Population in 1990: 663.
Place of birth for U.S.-born residents:
This state: 303
Midwest: 91
South: 7
West: 21
57% of the 68368 zip code residents lived in the same house 5 years ago. Out of people who lived in different houses, 46% lived in this county. Out of people who lived in different counties, 50% lived in Nebraska.
90% of the 68368 zip code residents lived in the same house 1 year ago. Out of people who lived in different houses, 90% moved from this county.
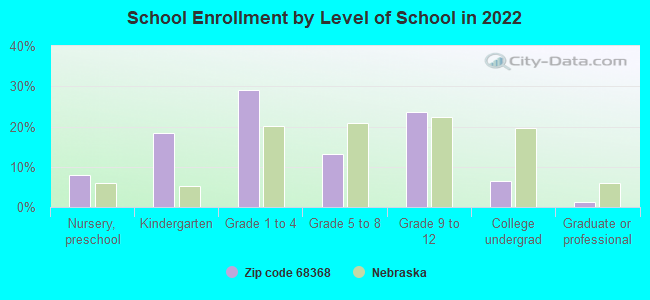
Private vs. public school enrollment:
Students in private schools in grades 1 to 8 (elementary and middle school): 1
Here:
3.6%
Nebraska:
14.1%
Students in private schools in grades 9 to 12 (high school):
Here:
0.0%
Nebraska:
12.5%
Students in private undergraduate colleges:
Here:
0.0%
Nebraska:
18.0%
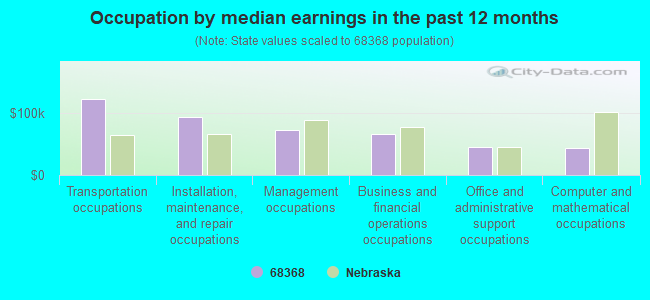
Occupation by median earnings in the past 12 months ($)
122,239Transportation occupations
94,055Installation, maintenance, and repair occupations
72,652Management occupations
65,461Business and financial operations occupations
44,551Office and administrative support occupations
42,851Computer and mathematical occupations
Top industries in this zip code by the number of employees in 2005:
Construction: Plumbing, Heating, and Air-Conditioning Contractors (5-9 employees: 1 establishment)
Wholesale Trade: Grain and Field Bean Merchant Wholesalers (1-4: 1)
Construction: Framing Contractors (1-4: 1)
Administrative and Support and Waste Management and Remediation Services: Landscaping Services (1-4: 1)
Finance and Insurance: Commercial Banking (1-4: 1)
Other Services (except Public Administration): General Automotive Repair (1-4: 1)
Other Services (except Public Administration): All Other Automotive Repair and Maintenance (1-4: 1)
Accommodation and Food Services: Drinking Places (Alcoholic Beverages) (1-4: 1)
Fatal accident statistics in 2011:
Fatal accident count: 1
Vehicles involved in fatal accidents: 2
Fatal accidents caused by drunken drivers: 0
Fatalities: 2
Persons involved in fatal accidents: 8
Pedestrians involved in fatal accidents: 0
Home Mortgage Disclosure Act Aggregated Statistics For Year 2009 (Based on 2 partial tracts)
A) FHA, FSA/RHS & VA Home Purchase Loans
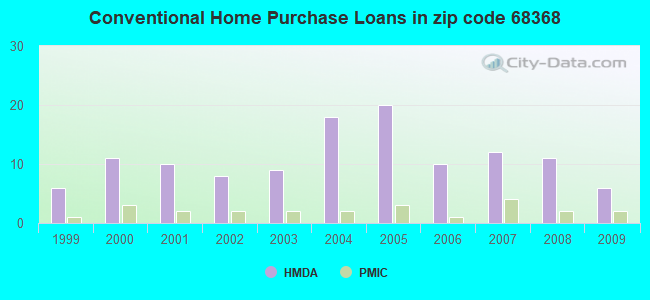
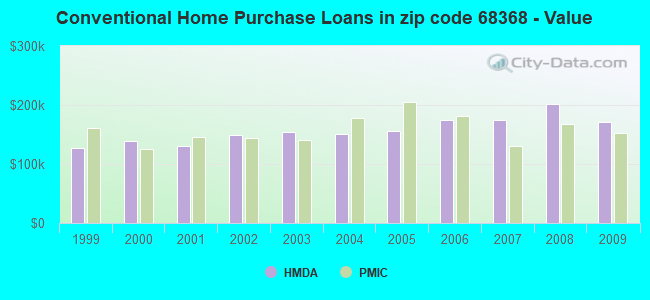
B) Conventional Home Purchase Loans
C) Refinancings
D) Home Improvement Loans
F) Non-occupant Loans on < 5 Family Dwellings (A B C & D)
G) Loans On Manufactured Home Dwelling (A B C & D)
Number
Average Value
Number
Average Value
Number
Average Value
Number
Average Value
Number
Average Value
Number
Average Value
LOANS ORIGINATED
5
$126,022
6
$170,780
63
$179,071
3
$38,553
3
$157,627
1
$86,440
APPLICATIONS APPROVED, NOT ACCEPTED
0
$0
0
$0
3
$175,700
1
$3,310
0
$0
0
$0
APPLICATIONS DENIED
3
$129,617
1
$118,070
10
$188,069
1
$43,070
1
$118,970
2
$87,500
APPLICATIONS WITHDRAWN
1
$80,720
1
$250,300
8
$184,674
0
$0
0
$0
0
$0
FILES CLOSED FOR INCOMPLETENESS
0
$0
0
$0
3
$210,037
0
$0
0
$0
0
$0
Aggregated Statistics For Year 2008 (Based on 2 partial tracts)
A) FHA, FSA/RHS & VA Home Purchase Loans
B) Conventional Home Purchase Loans
C) Refinancings
D) Home Improvement Loans
F) Non-occupant Loans on < 5 Family Dwellings (A B C & D)
G) Loans On Manufactured Home Dwelling (A B C & D)
Number
Average Value
Number
Average Value
Number
Average Value
Number
Average Value
Number
Average Value
Number
Average Value
LOANS ORIGINATED
2
$121,235
11
$201,394
40
$154,049
6
$53,212
3
$125,800
2
$49,395
APPLICATIONS APPROVED, NOT ACCEPTED
0
$0
2
$155,270
3
$169,677
1
$22,890
0
$0
0
$0
APPLICATIONS DENIED
0
$0
2
$403,760
12
$182,778
2
$26,055
0
$0
0
$0
APPLICATIONS WITHDRAWN
0
$0
2
$197,740
6
$201,503
1
$42,170
0
$0
0
$0
FILES CLOSED FOR INCOMPLETENESS
0
$0
0
$0
1
$142,470
0
$0
0
$0
0
$0
Aggregated Statistics For Year 2007 (Based on 2 partial tracts)
A) FHA, FSA/RHS & VA Home Purchase Loans
B) Conventional Home Purchase Loans
C) Refinancings
D) Home Improvement Loans
F) Non-occupant Loans on < 5 Family Dwellings (A B C & D)
G) Loans On Manufactured Home Dwelling (A B C & D)
Number
Average Value
Number
Average Value
Number
Average Value
Number
Average Value
Number
Average Value
Number
Average Value
LOANS ORIGINATED
1
$96,690
12
$174,621
33
$133,988
8
$54,819
2
$115,810
2
$56,625
APPLICATIONS APPROVED, NOT ACCEPTED
0
$0
1
$292,770
5
$147,226
1
$17,170
0
$0
0
$0
APPLICATIONS DENIED
0
$0
3
$163,250
17
$169,151
4
$74,848
1
$15,660
1
$32,230
APPLICATIONS WITHDRAWN
0
$0
2
$121,535
8
$221,946
0
$0
1
$59,040
0
$0
FILES CLOSED FOR INCOMPLETENESS
0
$0
1
$174,090
2
$208,730
0
$0
0
$0
0
$0
Aggregated Statistics For Year 2006 (Based on 2 partial tracts)
A) FHA, FSA/RHS & VA Home Purchase Loans
B) Conventional Home Purchase Loans
C) Refinancings
D) Home Improvement Loans
F) Non-occupant Loans on < 5 Family Dwellings (A B C & D)
G) Loans On Manufactured Home Dwelling (A B C & D)
Number
Average Value
Number
Average Value
Number
Average Value
Number
Average Value
Number
Average Value
Number
Average Value
LOANS ORIGINATED
2
$134,035
10
$174,515
34
$126,362
6
$21,083
4
$127,935
1
$76,200
APPLICATIONS APPROVED, NOT ACCEPTED
0
$0
1
$365,960
5
$191,322
1
$32,530
0
$0
0
$0
APPLICATIONS DENIED
0
$0
1
$249,390
13
$217,420
2
$51,955
0
$0
0
$0
APPLICATIONS WITHDRAWN
0
$0
2
$160,840
8
$123,078
1
$144,270
1
$141,870
0
$0
FILES CLOSED FOR INCOMPLETENESS
0
$0
0
$0
2
$214,455
0
$0
0
$0
0
$0
Aggregated Statistics For Year 2005 (Based on 2 partial tracts)
A) FHA, FSA/RHS & VA Home Purchase Loans
B) Conventional Home Purchase Loans
C) Refinancings
D) Home Improvement Loans
F) Non-occupant Loans on < 5 Family Dwellings (A B C & D)
G) Loans On Manufactured Home Dwelling (A B C & D)
Number
Average Value
Number
Average Value
Number
Average Value
Number
Average Value
Number
Average Value
Number
Average Value
LOANS ORIGINATED
1
$69,280
20
$155,856
40
$137,776
7
$38,253
3
$151,503
1
$51,200
APPLICATIONS APPROVED, NOT ACCEPTED
0
$0
0
$0
5
$160,720
1
$10,540
0
$0
0
$0
APPLICATIONS DENIED
0
$0
3
$117,870
9
$143,506
4
$42,018
0
$0
2
$77,410
APPLICATIONS WITHDRAWN
0
$0
3
$99,197
8
$140,585
0
$0
0
$0
0
$0
FILES CLOSED FOR INCOMPLETENESS
0
$0
0
$0
2
$115,660
0
$0
0
$0
0
$0
Aggregated Statistics For Year 2004 (Based on 2 partial tracts)
B) Conventional Home Purchase Loans
C) Refinancings
D) Home Improvement Loans
F) Non-occupant Loans on < 5 Family Dwellings (A B C & D)
G) Loans On Manufactured Home Dwelling (A B C & D)
Number
Average Value
Number
Average Value
Number
Average Value
Number
Average Value
Number
Average Value
LOANS ORIGINATED
18
$151,336
39
$137,818
5
$36,506
3
$111,747
1
$117,770
APPLICATIONS APPROVED, NOT ACCEPTED
3
$69,677
5
$159,576
0
$0
0
$0
0
$0
APPLICATIONS DENIED
3
$57,730
18
$157,645
2
$104,970
0
$0
1
$170,180
APPLICATIONS WITHDRAWN
2
$94,725
6
$160,088
0
$0
0
$0
0
$0
FILES CLOSED FOR INCOMPLETENESS
0
$0
4
$146,008
0
$0
0
$0
0
$0
Aggregated Statistics For Year 2003 (Based on 2 partial tracts)
A) FHA, FSA/RHS & VA Home Purchase Loans
B) Conventional Home Purchase Loans
C) Refinancings
D) Home Improvement Loans
F) Non-occupant Loans on < 5 Family Dwellings (A B C & D)
Number
Average Value
Number
Average Value
Number
Average Value
Number
Average Value
Number
Average Value
LOANS ORIGINATED
1
$60,540
9
$153,880
93
$133,172
4
$56,250
1
$53,310
APPLICATIONS APPROVED, NOT ACCEPTED
0
$0
1
$47,290
4
$93,748
1
$35,540
0
$0
APPLICATIONS DENIED
0
$0
2
$78,465
14
$116,199
1
$11,140
1
$24,400
APPLICATIONS WITHDRAWN
0
$0
1
$64,160
9
$145,078
0
$0
0
$0
FILES CLOSED FOR INCOMPLETENESS
0
$0
0
$0
2
$113,705
0
$0
0
$0
Aggregated Statistics For Year 2002 (Based on 2 partial tracts)
A) FHA, FSA/RHS & VA Home Purchase Loans
B) Conventional Home Purchase Loans
C) Refinancings
D) Home Improvement Loans
F) Non-occupant Loans on < 5 Family Dwellings (A B C & D)
Number
Average Value
Number
Average Value
Number
Average Value
Number
Average Value
Number
Average Value
LOANS ORIGINATED
1
$138,550
8
$149,169
60
$130,736
5
$23,674
2
$68,675
APPLICATIONS APPROVED, NOT ACCEPTED
1
$50,300
1
$198,790
3
$150,300
0
$0
0
$0
APPLICATIONS DENIED
0
$0
2
$148,040
9
$111,177
1
$15,660
0
$0
APPLICATIONS WITHDRAWN
0
$0
1
$61,750
8
$136,105
1
$3,610
0
$0
FILES CLOSED FOR INCOMPLETENESS
0
$0
0
$0
3
$132,327
0
$0
0
$0
Aggregated Statistics For Year 2001 (Based on 2 partial tracts)
A) FHA, FSA/RHS & VA Home Purchase Loans
B) Conventional Home Purchase Loans
C) Refinancings
D) Home Improvement Loans
F) Non-occupant Loans on < 5 Family Dwellings (A B C & D)
Number
Average Value
Number
Average Value
Number
Average Value
Number
Average Value
Number
Average Value
LOANS ORIGINATED
1
$46,690
10
$129,968
46
$120,002
7
$28,484
2
$61,745
APPLICATIONS APPROVED, NOT ACCEPTED
0
$0
0
$0
4
$108,960
0
$0
0
$0
APPLICATIONS DENIED
0
$0
3
$66,767
8
$131,399
1
$5,720
0
$0
APPLICATIONS WITHDRAWN
0
$0
0
$0
5
$108,192
0
$0
0
$0
FILES CLOSED FOR INCOMPLETENESS
0
$0
0
$0
1
$72,290
0
$0
0
$0
Aggregated Statistics For Year 2000 (Based on 2 partial tracts)
A) FHA, FSA/RHS & VA Home Purchase Loans
B) Conventional Home Purchase Loans
C) Refinancings
D) Home Improvement Loans
F) Non-occupant Loans on < 5 Family Dwellings (A B C & D)
Number
Average Value
Number
Average Value
Number
Average Value
Number
Average Value
Number
Average Value
LOANS ORIGINATED
2
$69,880
11
$139,702
16
$95,217
6
$19,930
1
$85,240
APPLICATIONS APPROVED, NOT ACCEPTED
0
$0
1
$53,610
1
$125,300
1
$18,070
0
$0
APPLICATIONS DENIED
0
$0
2
$102,255
7
$84,250
2
$21,990
0
$0
APPLICATIONS WITHDRAWN
0
$0
0
$0
3
$124,997
0
$0
0
$0
FILES CLOSED FOR INCOMPLETENESS
0
$0
0
$0
2
$91,115
0
$0
0
$0
Aggregated Statistics For Year 1999 (Based on 1 partial tract)
A) FHA, FSA/RHS & VA Home Purchase Loans
B) Conventional Home Purchase Loans
C) Refinancings
D) Home Improvement Loans
F) Non-occupant Loans on < 5 Family Dwellings (A B C & D)


 Nearest zip codes: 68328, 68404, 68438, 68331, 68333, 68339.