Estimated zip code population in 2022: 1,857 Zip code population in 2010: 1,390 Zip code population in 2000: 1,161
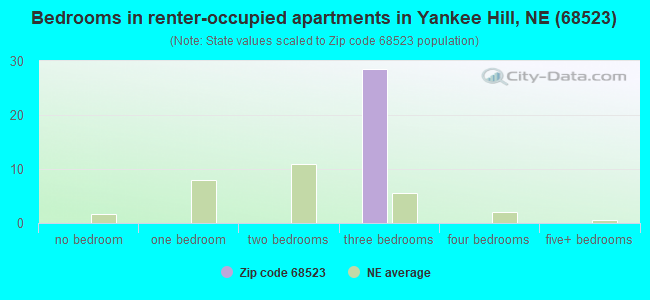
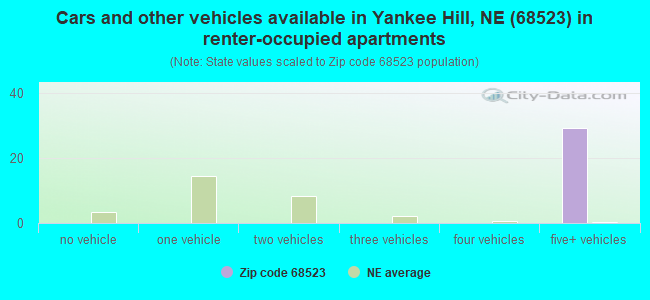
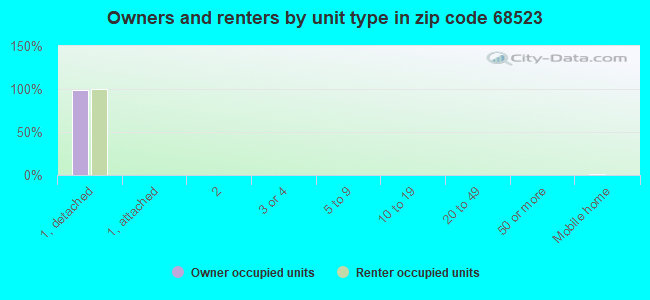
Houses and condos: 702 Renter-occupied apartments: 30
% of renters here:
5%
State:
34%
March 2022 cost of living index in zip code 68523: 74.8 (low, U.S. average is 100)
Land area: 16.0 sq. mi. Water area: 0.1 sq. mi.
Population density: 116 people per square mile
(very low).
OSM Map
General Map
Google Map
MSN Map
OSM Map
General Map
Google Map
MSN Map
OSM Map
General Map
Google Map
MSN Map
OSM Map
General Map
Google Map
MSN Map
Please wait while loading the map...
Real estate property taxes paid for housing units in 2022:
This zip code:
1.4% ($7,569)
Nebraska:
1.4% ($3,313)
Median real estate property taxes paid for housing units with mortgages in 2022: $7,532 (1.4%) Median real estate property taxes paid for housing units with no mortgage in 2022: $7,507 (1.5%)
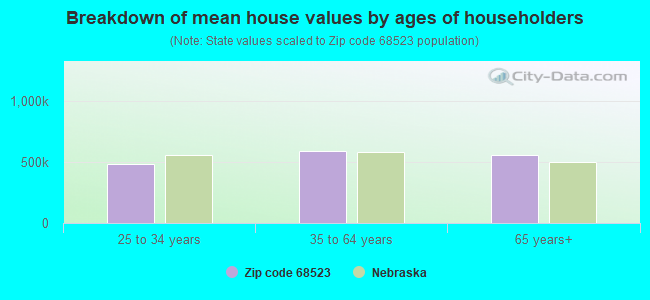
Estimated median house/condo value in 2022: $549,237
68523:
$549,237
Nebraska:
$232,400
According to our research of Nebraska and other state lists, there were 3 registered sex offenders living in 68523 zip code as of June 16, 2024. The ratio of all residents to sex offenders in zip code 68523 is 467 to 1. The ratio of registered sex offenders to all residents in this zip code is near the state average.
Median resident age:
This zip code:
45.6 years
Nebraska median age:
37.4 years
Average household size:
This zip code:
2.7 people
Nebraska:
2.4 people
Averages for the 2020 tax year for zip code 68523, filed in 2021:
Average Adjusted Gross Income (AGI) in 2020: $147,536 (Individual Income Tax Returns)
Here:
$147,536
State:
$73,874
Salary/wage: $99,876 (reported on 83.0% of returns)
Here:
$99,876
State:
$58,268
(% of AGI for various income ranges: 1207.5% for AGIs below $25k, 3875.0% for AGIs $25k-50k, 5272.9% for AGIs $50k-75k, 8565.7% for AGIs $75k-100k, 20489.4% for AGIs $100k-200k, 88487.5% for AGIs over 200k)
Taxable interest for individuals: $3,021 (reported on 52.0% of returns)
This zip code:
$3,021
Nebraska:
$1,748
(% of AGI for various income ranges: 13.8% for AGIs below $25k, 11.2% for AGIs $25k-50k, 72.9% for AGIs $50k-75k, 110.0% for AGIs $75k-100k, 216.2% for AGIs $100k-200k, 2665.0% for AGIs over 200k)
Ordinary dividends: $5,616 (reported on 37.0% of returns)
Here:
$5,616
State:
$7,841
(% of AGI for various income ranges: 30.0% for AGIs below $25k, 90.0% for AGIs $25k-50k, 84.3% for AGIs $50k-75k, 247.1% for AGIs $75k-100k, 361.2% for AGIs $100k-200k, 2870.0% for AGIs over 200k)
Net capital gain/loss in AGI: +$31,751 (reported on 39.0% of returns)
Here:
+$31,751
State:
+$21,703
(% of AGI for various income ranges: 36.2% for AGIs below $25k, 111.2% for AGIs $25k-50k, 98.6% for AGIs $50k-75k, 541.4% for AGIs $75k-100k, 799.4% for AGIs $100k-200k, 26272.5% for AGIs over 200k)
Profit/loss from business: +$15,162 (reported on 21.0% of returns)
Here:
+$15,162
State:
+$11,239
(% of AGI for various income ranges: 70.6% for AGIs below $25k, 365.0% for AGIs $25k-50k, 802.9% for AGIs $75k-100k, 606.9% for AGIs $100k-200k, 3115.0% for AGIs over 200k)
Taxable individual retirement arrangement distribution: $28,047 (reported on 15.0% of returns)
68523:
$28,047
Nebraska:
$18,251
(% of AGI for various income ranges: 725.0% for AGIs $25k-50k, 638.6% for AGIs $75k-100k, 1264.4% for AGIs $100k-200k, 2892.5% for AGIs over 200k)
Total itemized deductions: $35,367 (reported on 18.0% of returns)
Here:
$35,367
State:
$37,704
(% of AGI for various income ranges: 1845.7% for AGIs $50k-75k, 1224.4% for AGIs $100k-200k, 7787.5% for AGIs over 200k)
Charity contributions: $11,238 (reported on 16.0% of returns)
Here:
$11,238
State:
$15,251
(% of AGI for various income ranges: 264.3% for AGIs $50k-75k, 367.5% for AGIs $100k-200k, 2562.5% for AGIs over 200k)
Taxes paid: $9,128 (reported on 18.0% of returns)
68523:
$9,128
State:
$8,015
(% of AGI for various income ranges: 452.9% for AGIs $50k-75k, 375.6% for AGIs $100k-200k, 1812.5% for AGIs over 200k)
Earned income credit: $1,540 (reported on 5.0% of returns)
Here:
$1,540
State:
$2,260
(% of AGI for various income ranges: 48.1% for AGIs below $25k)
Percentage of individuals using paid preparers for their 2020 taxes: 96.0%
Here:
96%
State:
95%
(% for various income ranges: 90.9% for AGIs below $25k, 100.0% for AGIs $25k-50k, 100.0% for AGIs $50k-75k, 100.0% for AGIs $75k-100k, 96.8% for AGIs $100k-200k, 93.3% for AGIs over 200k)
Averages for the 2012 tax year for zip code 68523, filed in 2013:
Average Adjusted Gross Income (AGI) in 2012: $91,593 (Individual Income Tax Returns)
Here:
$91,593
State:
$60,572
Salary/wage: $71,538 (reported on 88.9% of returns)
Here:
$71,538
State:
$47,046
(% of AGI for various income ranges: 81.4% for AGIs below $25k, 70.3% for AGIs $25k-50k, 62.1% for AGIs $50k-75k, 74.6% for AGIs $75k-100k, 77.0% for AGIs $100k-200k, 61.0% for AGIs over 200k)
Taxable interest for individuals: $1,235 (reported on 51.4% of returns)
This zip code:
$1,235
Nebraska:
$1,535
(% of AGI for various income ranges: 0.7% for AGIs below $25k, 0.4% for AGIs $25k-50k, 1.5% for AGIs $50k-75k, 0.3% for AGIs $75k-100k, 0.7% for AGIs $100k-200k, 0.6% for AGIs over 200k)
Ordinary dividends: $3,055 (reported on 43.1% of returns)
Here:
$3,055
State:
$5,776
(% of AGI for various income ranges: 1.5% for AGIs below $25k, 1.1% for AGIs $25k-50k, 1.7% for AGIs $50k-75k, 1.0% for AGIs $75k-100k, 1.3% for AGIs $100k-200k, 1.7% for AGIs over 200k)
Net capital gain/loss in AGI: +$8,608 (reported on 34.7% of returns)
Here:
+$8,608
State:
+$16,171
(% of AGI for various income ranges: 0.4% for AGIs below $25k, 1.1% for AGIs $50k-75k, 1.3% for AGIs $75k-100k, 3.0% for AGIs $100k-200k, 5.2% for AGIs over 200k)
Profit/loss from business: +$11,450 (reported on 19.4% of returns)
Here:
+$11,450
State:
+$9,897
(% of AGI for various income ranges: 6.9% for AGIs below $25k, 8.0% for AGIs $50k-75k, 2.4% for AGIs $75k-100k, 3.4% for AGIs $100k-200k)
Taxable individual retirement arrangement distribution: $17,312 (reported on 11.1% of returns)
68523:
$17,312
Nebraska:
$12,804
(% of AGI for various income ranges: 8.4% for AGIs below $25k, 8.9% for AGIs $50k-75k, 2.9% for AGIs $100k-200k)
Total itemized deductions: $26,769 (18% of AGI, reported on 54.2% of returns)
Here:
$26,769
State:
$23,343
Here:
18.5% of AGI
State:
18.7% of AGI
(% of AGI for various income ranges: 26.1% for AGIs below $25k, 18.4% for AGIs $50k-75k, 17.3% for AGIs $75k-100k, 17.1% for AGIs $100k-200k, 14.1% for AGIs over 200k)
Charity contributions: $4,471 (reported on 47.2% of returns)
Here:
$4,471
State:
$4,921
(% of AGI for various income ranges: 2.5% for AGIs $50k-75k, 2.4% for AGIs $75k-100k, 2.7% for AGIs $100k-200k, 2.3% for AGIs over 200k)
Taxes paid: $12,664 (reported on 54.2% of returns)
68523:
$12,664
State:
$9,758
(% of AGI for various income ranges: 6.9% for AGIs below $25k, 6.8% for AGIs $50k-75k, 7.4% for AGIs $75k-100k, 8.2% for AGIs $100k-200k, 7.8% for AGIs over 200k)
Earned income credit: $1,800 (reported on 5.6% of returns)
Here:
$1,800
State:
$2,188
(% of AGI for various income ranges: 3.1% for AGIs below $25k)
Percentage of individuals using paid preparers for their 2012 taxes: 65.3%
Here:
65%
State:
57%
(% for various income ranges: 52.2% for AGIs below $25k, 66.7% for AGIs $25k-50k, 66.7% for AGIs $50k-75k, 75.0% for AGIs $75k-100k, 72.2% for AGIs $100k-200k, 75.0% for AGIs over 200k)
Averages for the 2004 tax year for zip code 68523, filed in 2005:
Average Adjusted Gross Income (AGI) in 2004: $78,380 (Individual Income Tax Returns)
Here:
$78,380
State:
$44,271
Salary/wage: $65,051 (reported on 86.3% of returns)
Here:
$65,051
State:
$38,230
(% of AGI for various income ranges: 76.1% for AGIs below $10k, 65.7% for AGIs $10k-25k, 75.8% for AGIs $25k-50k, 79.9% for AGIs $50k-75k, 85.5% for AGIs $75k-100k, 66.1% for AGIs over 100k)
Taxable interest for individuals: $1,573 (reported on 69.6% of returns)
This zip code:
$1,573
Nebraska:
$1,759
(% of AGI for various income ranges: 6.4% for AGIs below $10k, 3.7% for AGIs $10k-25k, 3.1% for AGIs $25k-50k, 1.7% for AGIs $50k-75k, 0.5% for AGIs $75k-100k, 1.2% for AGIs over 100k)
Taxable dividends: $2,170 (reported on 50.8% of returns)
Here:
$2,170
State:
$2,804
(% of AGI for various income ranges: 4.8% for AGIs below $10k, 2.4% for AGIs $10k-25k, 1.4% for AGIs $25k-50k, 1.2% for AGIs $50k-75k, 0.6% for AGIs $75k-100k, 1.6% for AGIs over 100k)
Net capital gain/loss: +$8,126 (reported on 40.6% of returns)
Here:
+$8,126
State:
+$7,887
(% of AGI for various income ranges: -6.6% for AGIs below $10k, -0.2% for AGIs $10k-25k, -0.6% for AGIs $25k-50k, -0.4% for AGIs $50k-75k, -0.1% for AGIs $75k-100k, 7.1% for AGIs over 100k)
Profit/loss from business: +$8,669 (reported on 21.3% of returns)
Here:
+$8,669
State:
+$7,743
(% of AGI for various income ranges: 3.9% for AGIs $10k-25k, 4.1% for AGIs $25k-50k, 6.6% for AGIs $50k-75k, 1.5% for AGIs $75k-100k, 1.5% for AGIs over 100k)
IRA payment deduction: $2,286 (reported on 3.7% of returns)
68523:
$2,286
Nebraska:
$2,902
Self-employed pension: $8,000 (reported on 2.1% of returns)
Here:
$8,000
Nebraska:
$12,366
Total itemized deductions: $23,173 (21% of AGI, reported on 59.9% of returns)
Here:
$23,173
State:
$18,692
Here:
20.8% of AGI
State:
21.1% of AGI
(% of AGI for various income ranges: 25.0% for AGIs $10k-25k, 21.6% for AGIs $25k-50k, 22.6% for AGIs $50k-75k, 20.9% for AGIs $75k-100k, 15.4% for AGIs over 100k)
Charity contributions deductions: $3,023 (3% of AGI, reported on 54.5% of returns)
Here:
$3,023
State:
$3,500
Here:
2.6% of AGI
State:
3.8% of AGI
(% of AGI for various income ranges: 1.4% for AGIs $10k-25k, 1.9% for AGIs $25k-50k, 2.2% for AGIs $50k-75k, 2.6% for AGIs $75k-100k, 2.0% for AGIs over 100k)
Total tax: $12,928 (reported on 82.8% of returns)
68523:
$12,928
State:
$6,550
(% of AGI for various income ranges: 3.7% for AGIs below $10k, 4.6% for AGIs $10k-25k, 6.7% for AGIs $25k-50k, 7.6% for AGIs $50k-75k, 9.3% for AGIs $75k-100k, 17.3% for AGIs over 100k)
Earned income credit: $1,286 (reported on 3.7% of returns)
Here:
$1,286
State:
$1,643
Percentage of individuals using paid preparers for their 2004 taxes: 67.1%
Here:
67%
State:
62%
(% for various income ranges: 54.0% for AGIs below $10k, 56.4% for AGIs $10k-25k, 71.1% for AGIs $25k-50k, 74.1% for AGIs $50k-75k, 61.4% for AGIs $75k-100k, 78.9% for AGIs over 100k)
Household received Food Stamps/SNAP in the past 12 months: 0 Household did not receive Food Stamps/SNAP in the past 12 months: 671
Women who did not have a birth in the past 12 months: 344 (236 now married, 107 unmarried)
Housing units in zip code 68523 with a mortgage: 450 (70 second mortgage, 44 both second mortgage and home equity loan) Median monthly owner costs for units with a mortgage: $2,453 Median monthly owner costs for units without a mortgage: $1,053
Residents with income below the poverty level in 2022:
This zip code:
1.4%
Whole state:
11.2%
Residents with income below 50% of the poverty level in 2022:
This zip code:
1.4%
Whole state:
6.1%
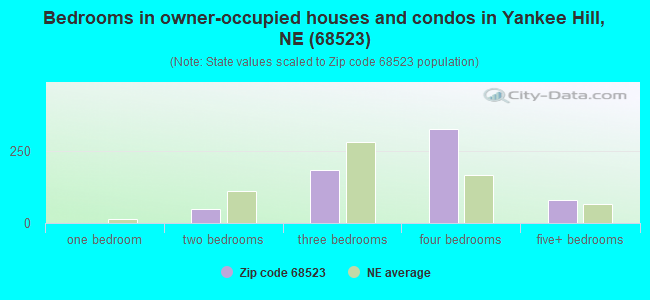
Median number of rooms in houses and condos:
Here:
8.2
State:
7.1
Notable locations in this zip code not listed on our city pages
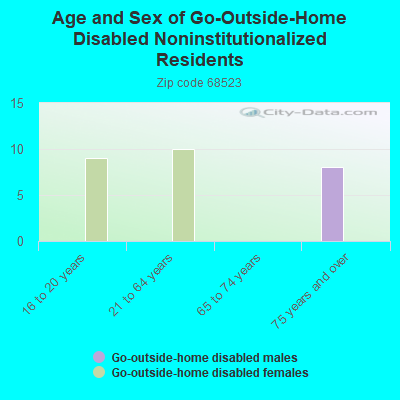
In group quarters: 1 (-1 institutionalized population)
Size of family households: 286 2-persons, 69 3-persons, 69 4-persons, 95 5-persons, 21 6-persons, 6 7-or-more-persons
Size of nonfamily households: 89 1-person, 31 2-persons
452 married couples with children.
27 single-parent households (27 women).
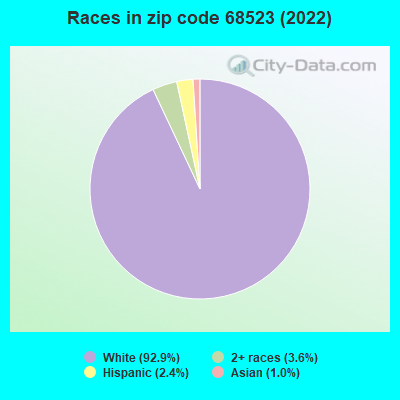
98.3% of residents of 68523 zip code speak English at home.
0.2% of residents speak Spanish at home (100% well).
1.7% of residents speak Asian or Pacific Island language at home (39% very well, 61% well).
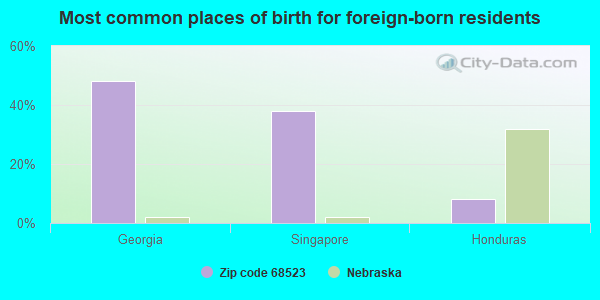
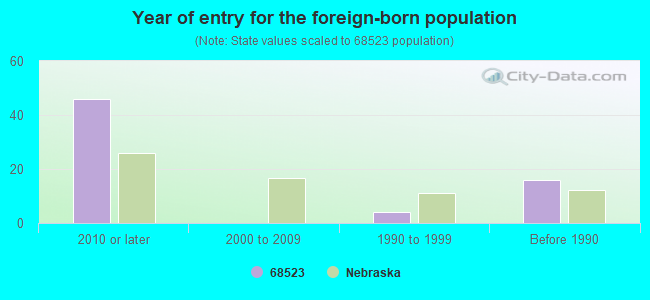
Foreign born population: 47 (2.5%) (10.7% of them are naturalized citizens)
This zip code:
2.5%
Whole state:
7.2%
48%Georgia
38%Singapore
8%Honduras
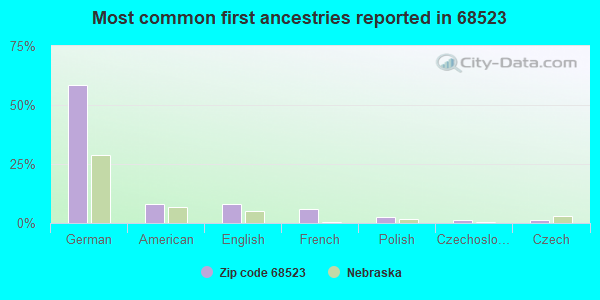
59%German
8%American
8%English
6%French
3%Polish
1%Czechoslovakian
1%Czech
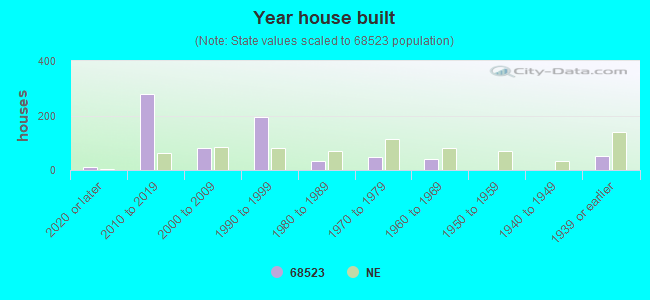
Year of entry for the foreign-born population
462010 or later
02000 to 2009
41990 to 1999
16Before 1990
Facilities with environmental interests located in this zip code:
HAINES BRANCH PUBLIC SCHOOL ( in LINCOLN, NE)
(Geographic Names Information System) (National Center for Education Statistics) - STATE ID-550069001
CARDWELL WOODS HOMEOWNERS ASSC (2301 W. DENTON ROAD in LINCOLN, NE)
National Pollutant Discharge Elimination System NON-MAJOR (Tracking pollutant discharge elimination systems) - permit Business SIC classification: SEWERAGE SYSTEMS Alternative names: CARDWELL WOOD WWTF
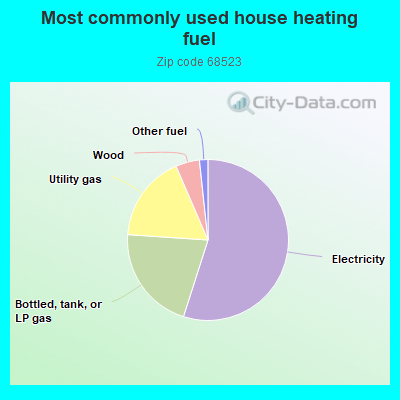
55.1%Electricity
21.2%Bottled, tank, or LP gas
17.5%Utility gas
4.8%Wood
1.7%Other fuel
Population in 1990: 685. Population change in the 1990s: +476 (+69.5%).
Place of birth for U.S.-born residents:
This state: 1,376
Northeast: 43
Midwest: 268
South: 34
West: 57
52% of the 68523 zip code residents lived in the same house 5 years ago. Out of people who lived in different houses, 77% lived in this county. Out of people who lived in different counties, 50% lived in Nebraska.
100% of the 68523 zip code residents lived in the same house 1 year ago. Out of people who lived in different houses, 180% moved from this county. Out of people who lived in different houses, 240% moved from different state.
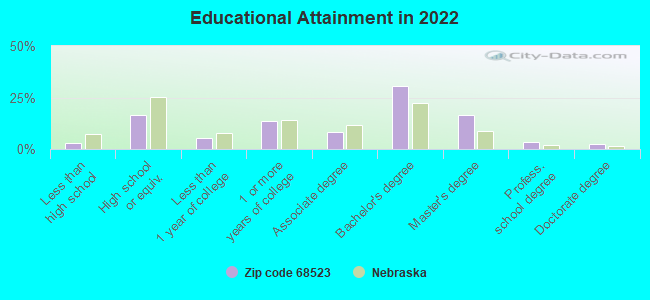
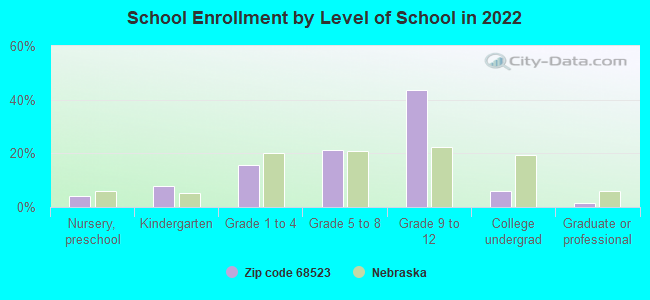
Private vs. public school enrollment:
Students in private schools in grades 1 to 8 (elementary and middle school): 39
Here:
21.3%
Nebraska:
14.1%
Students in private schools in grades 9 to 12 (high school): 14
Here:
6.3%
Nebraska:
12.5%
Students in private undergraduate colleges:
Here:
0.0%
Nebraska:
18.0%
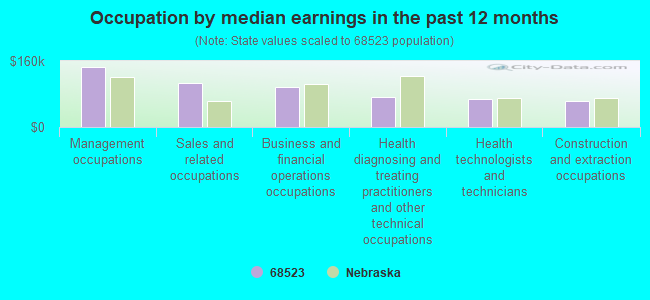
Occupation by median earnings in the past 12 months ($)
145,608Management occupations
107,629Sales and related occupations
97,441Business and financial operations occupations
71,982Health diagnosing and treating practitioners and other technical occupations
66,797Health technologists and technicians
63,226Construction and extraction occupations
Top industries in this zip code by the number of employees in 2005:
Health Care and Social Assistance: Residential Mental Retardation Facilities (50-99 employees: 1 establishment)
Health Care and Social Assistance: Medical Laboratories (10-19: 1)
Professional, Scientific, and Technical Services: Process, Physical Distribution, and Logistics Consulting Services (10-19: 1)
Construction: Water and Sewer Line and Related Structures Construction (10-19: 1)
Construction: New Single-Family Housing Construction (except Operative Builders) (1-4: 4)
Construction: Plumbing, Heating, and Air-Conditioning Contractors (5-9: 1)
Accommodation and Food Services: Limited-Service Restaurants (5-9: 1)
Construction: All Other Specialty Trade Contractors (1-4: 2)
Construction: Site Preparation Contractors (1-4: 2)
Home Mortgage Disclosure Act Aggregated Statistics For Year 2009 (Based on 2 partial tracts)
A) FHA, FSA/RHS & VA Home Purchase Loans
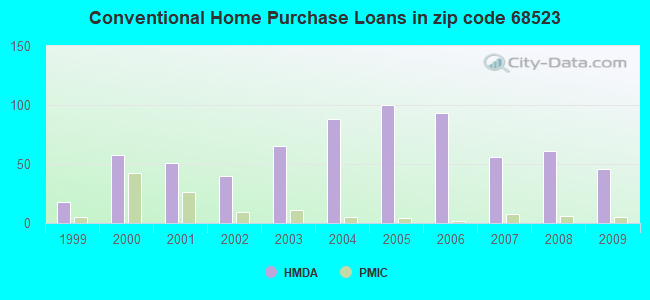
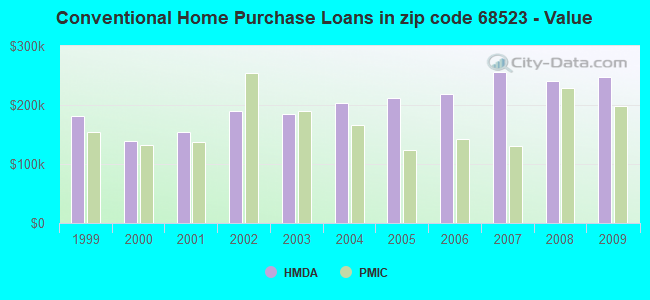
B) Conventional Home Purchase Loans
C) Refinancings
D) Home Improvement Loans
F) Non-occupant Loans on < 5 Family Dwellings (A B C & D)
Number
Average Value
Number
Average Value
Number
Average Value
Number
Average Value
Number
Average Value
LOANS ORIGINATED
12
$201,262
46
$247,474
273
$251,189
12
$48,164
7
$236,343
APPLICATIONS APPROVED, NOT ACCEPTED
1
$109,190
5
$257,536
9
$233,140
1
$17,800
0
$0
APPLICATIONS DENIED
4
$134,998
1
$531,690
13
$145,976
4
$60,528
1
$531,690
APPLICATIONS WITHDRAWN
0
$0
5
$172,086
11
$220,314
1
$5,930
0
$0
FILES CLOSED FOR INCOMPLETENESS
1
$322,810
0
$0
5
$211,014
0
$0
0
$0
Aggregated Statistics For Year 2008 (Based on 2 partial tracts)
A) FHA, FSA/RHS & VA Home Purchase Loans
B) Conventional Home Purchase Loans
C) Refinancings
D) Home Improvement Loans
F) Non-occupant Loans on < 5 Family Dwellings (A B C & D)
Number
Average Value
Number
Average Value
Number
Average Value
Number
Average Value
Number
Average Value
LOANS ORIGINATED
2
$306,790
61
$239,870
127
$224,230
9
$86,768
11
$189,348
APPLICATIONS APPROVED, NOT ACCEPTED
0
$0
1
$494,900
15
$303,742
2
$13,055
0
$0
APPLICATIONS DENIED
0
$0
4
$118,680
21
$184,406
2
$35,605
1
$132,920
APPLICATIONS WITHDRAWN
0
$0
5
$293,614
13
$311,672
1
$11,870
1
$494,900
FILES CLOSED FOR INCOMPLETENESS
0
$0
0
$0
0
$0
0
$0
0
$0
Aggregated Statistics For Year 2007 (Based on 2 partial tracts)
A) FHA, FSA/RHS & VA Home Purchase Loans
B) Conventional Home Purchase Loans
C) Refinancings
D) Home Improvement Loans
F) Non-occupant Loans on < 5 Family Dwellings (A B C & D)
G) Loans On Manufactured Home Dwelling (A B C & D)
Number
Average Value
Number
Average Value
Number
Average Value
Number
Average Value
Number
Average Value
Number
Average Value
LOANS ORIGINATED
1
$115,120
56
$255,098
72
$171,443
9
$31,780
9
$179,998
1
$115,120
APPLICATIONS APPROVED, NOT ACCEPTED
0
$0
6
$247,448
7
$229,391
0
$0
1
$47,470
0
$0
APPLICATIONS DENIED
0
$0
6
$105,032
28
$228,374
5
$105,626
0
$0
1
$163,780
APPLICATIONS WITHDRAWN
0
$0
1
$118,680
17
$177,462
0
$0
0
$0
0
$0
FILES CLOSED FOR INCOMPLETENESS
0
$0
0
$0
5
$258,722
0
$0
0
$0
0
$0
Aggregated Statistics For Year 2006 (Based on 2 partial tracts)
A) FHA, FSA/RHS & VA Home Purchase Loans
B) Conventional Home Purchase Loans
C) Refinancings
D) Home Improvement Loans
F) Non-occupant Loans on < 5 Family Dwellings (A B C & D)
Number
Average Value
Number
Average Value
Number
Average Value
Number
Average Value
Number
Average Value
LOANS ORIGINATED
1
$205,320
93
$218,461
83
$218,157
13
$63,813
11
$161,189
APPLICATIONS APPROVED, NOT ACCEPTED
0
$0
6
$119,867
8
$149,685
0
$0
0
$0
APPLICATIONS DENIED
0
$0
5
$73,582
36
$183,163
6
$157,845
1
$185,140
APPLICATIONS WITHDRAWN
0
$0
8
$218,668
24
$204,031
0
$0
0
$0
FILES CLOSED FOR INCOMPLETENESS
0
$0
1
$237,360
6
$313,513
0
$0
0
$0
Aggregated Statistics For Year 2005 (Based on 2 partial tracts)
A) FHA, FSA/RHS & VA Home Purchase Loans
B) Conventional Home Purchase Loans
C) Refinancings
D) Home Improvement Loans
F) Non-occupant Loans on < 5 Family Dwellings (A B C & D)
Number
Average Value
Number
Average Value
Number
Average Value
Number
Average Value
Number
Average Value
LOANS ORIGINATED
1
$144,790
100
$212,449
112
$199,616
13
$41,355
5
$280,796
APPLICATIONS APPROVED, NOT ACCEPTED
0
$0
13
$223,940
15
$245,984
1
$118,680
0
$0
APPLICATIONS DENIED
0
$0
5
$173,748
31
$234,604
8
$56,372
1
$320,440
APPLICATIONS WITHDRAWN
0
$0
5
$299,786
21
$236,173
1
$5,930
1
$320,440
FILES CLOSED FOR INCOMPLETENESS
0
$0
2
$152,505
6
$212,833
0
$0
0
$0
Aggregated Statistics For Year 2004 (Based on 2 partial tracts)
A) FHA, FSA/RHS & VA Home Purchase Loans
B) Conventional Home Purchase Loans
C) Refinancings
D) Home Improvement Loans
F) Non-occupant Loans on < 5 Family Dwellings (A B C & D)
G) Loans On Manufactured Home Dwelling (A B C & D)
Number
Average Value
Number
Average Value
Number
Average Value
Number
Average Value
Number
Average Value
Number
Average Value
LOANS ORIGINATED
2
$205,910
88
$203,455
136
$171,990
11
$56,966
7
$204,299
0
$0
APPLICATIONS APPROVED, NOT ACCEPTED
0
$0
4
$248,338
11
$196,362
1
$71,210
1
$112,750
1
$71,210
APPLICATIONS DENIED
1
$94,940
8
$445,940
26
$173,318
6
$46,483
0
$0
1
$35,600
APPLICATIONS WITHDRAWN
0
$0
5
$167,576
21
$229,335
0
$0
1
$77,140
0
$0
FILES CLOSED FOR INCOMPLETENESS
0
$0
1
$227,870
9
$207,162
0
$0
0
$0
0
$0
Aggregated Statistics For Year 2003 (Based on 2 partial tracts)
A) FHA, FSA/RHS & VA Home Purchase Loans
B) Conventional Home Purchase Loans
C) Refinancings
D) Home Improvement Loans
F) Non-occupant Loans on < 5 Family Dwellings (A B C & D)
Number
Average Value
Number
Average Value
Number
Average Value
Number
Average Value
Number
Average Value
LOANS ORIGINATED
6
$127,778
65
$184,575
376
$184,872
17
$13,753
8
$217,036
APPLICATIONS APPROVED, NOT ACCEPTED
0
$0
6
$195,030
14
$171,662
1
$29,670
0
$0
APPLICATIONS DENIED
0
$0
6
$199,185
38
$134,733
8
$24,775
0
$0
APPLICATIONS WITHDRAWN
0
$0
7
$163,609
30
$122,043
0
$0
0
$0
FILES CLOSED FOR INCOMPLETENESS
0
$0
0
$0
5
$117,018
0
$0
0
$0
Aggregated Statistics For Year 2002 (Based on 2 partial tracts)
A) FHA, FSA/RHS & VA Home Purchase Loans
B) Conventional Home Purchase Loans
C) Refinancings
D) Home Improvement Loans
F) Non-occupant Loans on < 5 Family Dwellings (A B C & D)
Number
Average Value
Number
Average Value
Number
Average Value
Number
Average Value
Number
Average Value
LOANS ORIGINATED
0
$0
40
$190,511
196
$190,487
13
$16,250
4
$102,065
APPLICATIONS APPROVED, NOT ACCEPTED
0
$0
1
$357,230
11
$196,469
0
$0
0
$0
APPLICATIONS DENIED
1
$164,970
6
$95,142
12
$186,228
4
$12,758
1
$11,870
APPLICATIONS WITHDRAWN
0
$0
5
$173,272
20
$161,880
0
$0
0
$0
FILES CLOSED FOR INCOMPLETENESS
0
$0
0
$0
8
$197,899
0
$0
0
$0
Aggregated Statistics For Year 2001 (Based on 2 partial tracts)
A) FHA, FSA/RHS & VA Home Purchase Loans
B) Conventional Home Purchase Loans
C) Refinancings
D) Home Improvement Loans
F) Non-occupant Loans on < 5 Family Dwellings (A B C & D)
Number
Average Value
Number
Average Value
Number
Average Value
Number
Average Value
Number
Average Value
LOANS ORIGINATED
2
$173,275
51
$154,540
180
$161,629
7
$45,269
15
$73,819
APPLICATIONS APPROVED, NOT ACCEPTED
0
$0
7
$149,876
6
$128,175
1
$23,740
0
$0
APPLICATIONS DENIED
0
$0
6
$127,977
13
$112,837
2
$8,900
0
$0
APPLICATIONS WITHDRAWN
0
$0
1
$186,330
9
$205,580
1
$41,540
0
$0
FILES CLOSED FOR INCOMPLETENESS
0
$0
0
$0
4
$107,405
0
$0
0
$0
Aggregated Statistics For Year 2000 (Based on 2 partial tracts)
A) FHA, FSA/RHS & VA Home Purchase Loans
B) Conventional Home Purchase Loans
C) Refinancings
D) Home Improvement Loans
F) Non-occupant Loans on < 5 Family Dwellings (A B C & D)
Number
Average Value
Number
Average Value
Number
Average Value
Number
Average Value
Number
Average Value
LOANS ORIGINATED
6
$111,757
58
$139,224
49
$176,276
20
$33,824
15
$92,096
APPLICATIONS APPROVED, NOT ACCEPTED
0
$0
1
$5,930
4
$120,162
1
$23,740
0
$0
APPLICATIONS DENIED
0
$0
4
$108,890
8
$108,889
4
$20,770
0
$0
APPLICATIONS WITHDRAWN
1
$159,030
4
$115,712
5
$62,426
1
$5,930
0
$0
FILES CLOSED FOR INCOMPLETENESS
0
$0
0
$0
6
$135,888
0
$0
0
$0
Aggregated Statistics For Year 1999 (Based on 1 partial tract)
A) FHA, FSA/RHS & VA Home Purchase Loans
B) Conventional Home Purchase Loans
C) Refinancings
D) Home Improvement Loans
F) Non-occupant Loans on < 5 Family Dwellings (A B C & D)

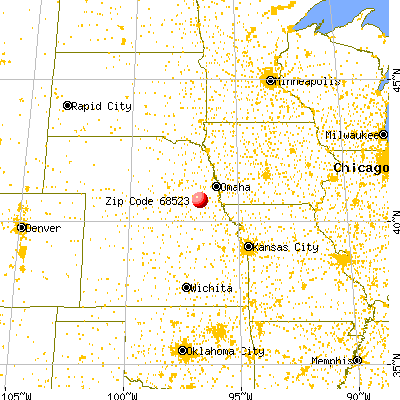


 Nearest zip codes: 68512, 68522, 68502, 68508, 68532, 68438.