Estimated zip code population in 2022: 5,062 Zip code population in 2010: 5,504 Zip code population in 2000: 4,780
Houses and condos: 2,114 Renter-occupied apartments: 229
% of renters here:
12%
State:
32%
March 2022 cost of living index in zip code 70343: 80.7 (low, U.S. average is 100)
Land area: 28.9 sq. mi. Water area: 0.5 sq. mi.
Population density: 175 people per square mile
(very low).
OSM Map
General Map
Google Map
MSN Map
OSM Map
General Map
Google Map
MSN Map
OSM Map
General Map
Google Map
MSN Map
OSM Map
General Map
Google Map
MSN Map
Please wait while loading the map...
Real estate property taxes paid for housing units in 2022:
This zip code:
0.6% ($1,170)
Louisiana:
0.5% ($1,127)
Median real estate property taxes paid for housing units with mortgages in 2022: $1,192 (0.5%) Median real estate property taxes paid for housing units with no mortgage in 2022: $1,140 (0.8%)
Business Search- 14 Million verified businesses
Males: 2,410
(47.6%)
Females: 2,651
(52.4%)
For population 25 years and over in 70343:
High school or higher: 82.9%
Bachelor's degree or higher: 13.4%
Graduate or professional degree: 7.4%
Unemployed: 5.2%
Mean travel time to work (commute): 24.8 minutes
For population 15 years and over in 70343:
Never married: 19.9%
Now married: 66.4%
Separated: 0.7%
Widowed: 5.8%
Divorced: 7.1%
Zip code 70343 compared to state average:
Black race population percentage significantly below state average.
Hispanic race population percentage significantly below state average.
Median age significantly above state average.
Foreign-born population percentage significantly below state average.
Renting percentage significantly below state average.
Length of stay since moving in significantly above state average.
Number of college students below state average.
Percentage of population with a bachelor's degree or higher below state average.
Estimated median house/condo value in 2022: $189,578
70343:
$189,578
Louisiana:
$209,200
According to our research of Louisiana and other state lists, there were 6 registered sex offenders living in 70343 zip code as of June 16, 2024. The ratio of all residents to sex offenders in zip code 70343 is 889 to 1. The ratio of registered sex offenders to all residents in this zip code is lower than the state average.
Median resident age:
This zip code:
47.3 years
Louisiana median age:
38.2 years
Average household size:
This zip code:
2.6 people
Louisiana:
2.5 people
Averages for the 2020 tax year for zip code 70343, filed in 2021:
Average Adjusted Gross Income (AGI) in 2020: $68,019 (Individual Income Tax Returns)
Here:
$68,019
State:
$60,757
Salary/wage: $61,355 (reported on 82.9% of returns)
Here:
$61,355
State:
$50,882
(% of AGI for various income ranges: 1021.9% for AGIs below $25k, 3243.5% for AGIs $25k-50k, 6410.4% for AGIs $50k-75k, 9432.4% for AGIs $75k-100k, 14713.6% for AGIs $100k-200k)
Taxable interest for individuals: $1,318 (reported on 34.1% of returns)
This zip code:
$1,318
Louisiana:
$1,576
(% of AGI for various income ranges: 17.4% for AGIs below $25k, 23.2% for AGIs $25k-50k, 21.2% for AGIs $50k-75k, 42.9% for AGIs $75k-100k, 73.6% for AGIs $100k-200k)
Ordinary dividends: $5,349 (reported on 16.1% of returns)
Here:
$5,349
State:
$7,743
(% of AGI for various income ranges: 12.4% for AGIs below $25k, 35.4% for AGIs $25k-50k, 67.1% for AGIs $50k-75k, 74.1% for AGIs $75k-100k, 115.5% for AGIs $100k-200k)
Net capital gain/loss in AGI: +$8,681 (reported on 14.7% of returns)
Here:
+$8,681
State:
+$16,917
(% of AGI for various income ranges: 8.9% for AGIs below $25k, 14.3% for AGIs $25k-50k, 88.8% for AGIs $50k-75k, 99.4% for AGIs $75k-100k, 275.8% for AGIs $100k-200k)
Profit/loss from business: +$6,370 (reported on 17.1% of returns)
Here:
+$6,370
State:
+$7,679
(% of AGI for various income ranges: 128.7% for AGIs below $25k, 128.4% for AGIs $25k-50k, 162.9% for AGIs $50k-75k, 242.9% for AGIs $75k-100k, 116.1% for AGIs $100k-200k)
Taxable individual retirement arrangement distribution: $17,352 (reported on 10.6% of returns)
70343:
$17,352
Louisiana:
$20,716
(% of AGI for various income ranges: 79.3% for AGIs below $25k, 161.1% for AGIs $25k-50k, 242.5% for AGIs $50k-75k, 384.7% for AGIs $75k-100k, 524.5% for AGIs $100k-200k)
Total itemized deductions: $37,517 (reported on 2.8% of returns)
Here:
$37,517
State:
$36,265
(% of AGI for various income ranges: 187.0% for AGIs $25k-50k, 472.4% for AGIs $100k-200k)
Charity contributions: $9,900 (reported on 1.4% of returns)
Here:
$9,900
State:
$13,106
(% of AGI for various income ranges: 90.0% for AGIs $100k-200k)
Taxes paid: $6,500 (reported on 2.8% of returns)
70343:
$6,500
State:
$6,643
(% of AGI for various income ranges: 118.2% for AGIs $100k-200k)
Earned income credit: $2,550 (reported on 16.6% of returns)
Here:
$2,550
State:
$2,671
(% of AGI for various income ranges: 118.3% for AGIs below $25k, 75.4% for AGIs $25k-50k)
Percentage of individuals using paid preparers for their 2020 taxes: 93.5%
Here:
94%
State:
92%
(% for various income ranges: 94.1% for AGIs below $25k, 93.2% for AGIs $25k-50k, 93.5% for AGIs $50k-75k, 91.7% for AGIs $75k-100k, 95.3% for AGIs $100k-200k, 85.7% for AGIs over 200k)
Averages for the 2012 tax year for zip code 70343, filed in 2013:
Average Adjusted Gross Income (AGI) in 2012: $68,650 (Individual Income Tax Returns)
Here:
$68,650
State:
$56,730
Salary/wage: $60,066 (reported on 86.7% of returns)
Here:
$60,066
State:
$45,545
(% of AGI for various income ranges: 74.7% for AGIs below $25k, 82.1% for AGIs $25k-50k, 84.5% for AGIs $50k-75k, 87.1% for AGIs $75k-100k, 86.8% for AGIs $100k-200k, 45.3% for AGIs over 200k)
Taxable interest for individuals: $1,031 (reported on 34.9% of returns)
This zip code:
$1,031
Louisiana:
$1,804
(% of AGI for various income ranges: 1.1% for AGIs below $25k, 0.6% for AGIs $25k-50k, 0.3% for AGIs $50k-75k, 0.3% for AGIs $75k-100k, 0.3% for AGIs $100k-200k, 0.9% for AGIs over 200k)
Ordinary dividends: $6,740 (reported on 16.9% of returns)
Here:
$6,740
State:
$7,610
(% of AGI for various income ranges: 0.6% for AGIs below $25k, 0.8% for AGIs $25k-50k, 0.8% for AGIs $50k-75k, 0.2% for AGIs $75k-100k, 0.7% for AGIs $100k-200k, 5.1% for AGIs over 200k)
Net capital gain/loss in AGI: +$12,850 (reported on 11.2% of returns)
Here:
+$12,850
State:
+$17,096
(% of AGI for various income ranges: 0.1% for AGIs $50k-75k, 0.5% for AGIs $100k-200k, 8.5% for AGIs over 200k)
Profit/loss from business: +$19,121 (reported on 16.9% of returns)
Here:
+$19,121
State:
+$12,088
(% of AGI for various income ranges: 9.4% for AGIs below $25k, 3.7% for AGIs $25k-50k, 4.7% for AGIs $50k-75k, 4.0% for AGIs $75k-100k, 2.2% for AGIs $100k-200k, 8.0% for AGIs over 200k)
Taxable individual retirement arrangement distribution: $15,753 (reported on 7.6% of returns)
70343:
$15,753
Louisiana:
$16,085
(% of AGI for various income ranges: 4.8% for AGIs below $25k, 2.5% for AGIs $25k-50k, 1.8% for AGIs $50k-75k, 1.6% for AGIs $75k-100k, 2.2% for AGIs $100k-200k)
Total itemized deductions: $21,288 (15% of AGI, reported on 22.9% of returns)
Here:
$21,288
State:
$23,585
Here:
14.6% of AGI
State:
18.1% of AGI
(% of AGI for various income ranges: 4.7% for AGIs below $25k, 5.1% for AGIs $25k-50k, 5.7% for AGIs $50k-75k, 5.6% for AGIs $75k-100k, 8.3% for AGIs $100k-200k, 8.7% for AGIs over 200k)
Charity contributions: $3,818 (reported on 15.3% of returns)
Here:
$3,818
State:
$5,533
(% of AGI for various income ranges: 0.6% for AGIs $25k-50k, 0.7% for AGIs $50k-75k, 0.6% for AGIs $75k-100k, 0.9% for AGIs $100k-200k, 1.3% for AGIs over 200k)
Taxes paid: $6,528 (reported on 22.9% of returns)
70343:
$6,528
State:
$6,282
(% of AGI for various income ranges: 0.3% for AGIs below $25k, 0.9% for AGIs $25k-50k, 1.2% for AGIs $50k-75k, 1.3% for AGIs $75k-100k, 2.8% for AGIs $100k-200k, 3.6% for AGIs over 200k)
Earned income credit: $2,435 (reported on 16.1% of returns)
Here:
$2,435
State:
$2,633
(% of AGI for various income ranges: 7.8% for AGIs below $25k, 1.1% for AGIs $25k-50k)
Percentage of individuals using paid preparers for their 2012 taxes: 61.8%
Here:
62%
State:
57%
(% for various income ranges: 57.1% for AGIs below $25k, 57.4% for AGIs $25k-50k, 66.7% for AGIs $50k-75k, 64.5% for AGIs $75k-100k, 64.3% for AGIs $100k-200k, 88.9% for AGIs over 200k)
Averages for the 2004 tax year for zip code 70343, filed in 2005:
Average Adjusted Gross Income (AGI) in 2004: $45,631 (Individual Income Tax Returns)
Here:
$45,631
State:
$39,411
Salary/wage: $41,011 (reported on 88.9% of returns)
Here:
$41,011
State:
$34,434
(% of AGI for various income ranges: 105.6% for AGIs below $10k, 77.2% for AGIs $10k-25k, 82.4% for AGIs $25k-50k, 87.9% for AGIs $50k-75k, 87.4% for AGIs $75k-100k, 65.2% for AGIs over 100k)
Taxable interest for individuals: $1,787 (reported on 42.1% of returns)
This zip code:
$1,787
Louisiana:
$1,606
(% of AGI for various income ranges: 3.6% for AGIs below $10k, 2.5% for AGIs $10k-25k, 1.2% for AGIs $25k-50k, 1.1% for AGIs $50k-75k, 0.6% for AGIs $75k-100k, 2.8% for AGIs over 100k)
Taxable dividends: $1,998 (reported on 19.9% of returns)
Here:
$1,998
State:
$3,235
(% of AGI for various income ranges: 2.2% for AGIs below $10k, 1.2% for AGIs $10k-25k, 0.9% for AGIs $25k-50k, 0.4% for AGIs $50k-75k, 0.5% for AGIs $75k-100k, 1.4% for AGIs over 100k)
Net capital gain/loss: +$7,186 (reported on 14.6% of returns)
Here:
+$7,186
State:
+$8,531
(% of AGI for various income ranges: -0.6% for AGIs below $10k, 0.0% for AGIs $10k-25k, 0.4% for AGIs $25k-50k, 0.5% for AGIs $50k-75k, 0.2% for AGIs $75k-100k, 7.3% for AGIs over 100k)
Profit/loss from business: +$9,128 (reported on 17.5% of returns)
Here:
+$9,128
State:
+$9,128
(% of AGI for various income ranges: 11.3% for AGIs below $10k, 6.4% for AGIs $10k-25k, 3.6% for AGIs $25k-50k, 2.8% for AGIs $50k-75k, 1.6% for AGIs $75k-100k, 4.0% for AGIs over 100k)
IRA payment deduction: $3,615 (reported on 2.8% of returns)
70343:
$3,615
Louisiana:
$3,055
(% of AGI for various income ranges: 0.2% for AGIs $10k-25k, 0.4% for AGIs $25k-50k, 0.1% for AGIs $50k-75k, 0.2% for AGIs $75k-100k, 0.3% for AGIs over 100k)
Total itemized deductions: $15,248 (16% of AGI, reported on 17.6% of returns)
Here:
$15,248
State:
$18,222
Here:
16.1% of AGI
State:
20.3% of AGI
(% of AGI for various income ranges: 3.7% for AGIs $10k-25k, 4.0% for AGIs $25k-50k, 5.1% for AGIs $50k-75k, 7.3% for AGIs $75k-100k, 7.9% for AGIs over 100k)
Charity contributions deductions: $2,260 (2% of AGI, reported on 14.3% of returns)
Here:
$2,260
State:
$4,190
Here:
2.4% of AGI
State:
4.4% of AGI
(% of AGI for various income ranges: 0.1% for AGIs $10k-25k, 0.4% for AGIs $25k-50k, 0.5% for AGIs $50k-75k, 0.8% for AGIs $75k-100k, 1.2% for AGIs over 100k)
Total tax: $6,235 (reported on 77.7% of returns)
70343:
$6,235
State:
$6,529
(% of AGI for various income ranges: 3.4% for AGIs below $10k, 3.9% for AGIs $10k-25k, 6.3% for AGIs $25k-50k, 8.5% for AGIs $50k-75k, 10.5% for AGIs $75k-100k, 17.8% for AGIs over 100k)
Earned income credit: $1,701 (reported on 15.3% of returns)
Here:
$1,701
State:
$2,103
Percentage of individuals using paid preparers for their 2004 taxes: 58.7%
Here:
59%
State:
61%
(% for various income ranges: 53.0% for AGIs below $10k, 54.5% for AGIs $10k-25k, 58.2% for AGIs $25k-50k, 60.5% for AGIs $50k-75k, 63.6% for AGIs $75k-100k, 75.8% for AGIs over 100k)
Household received Food Stamps/SNAP in the past 12 months: 179 Household did not receive Food Stamps/SNAP in the past 12 months: 1,772
Women who had a birth in the past 12 months: 8 (0 now married, 8 unmarried) Women who did not have a birth in the past 12 months: 777 (513 now married, 255 unmarried)
Housing units in zip code 70343 with a mortgage: 913 (50 second mortgage, 35 both second mortgage and home equity loan) Houses without a mortgage: 11
Median monthly owner costs for units with a mortgage: $1,414 Median monthly owner costs for units without a mortgage: $325
Residents with income below the poverty level in 2022:
This zip code:
7.7%
Whole state:
18.6%
Residents with income below 50% of the poverty level in 2022:
This zip code:
5.6%
Whole state:
10.1%
Median number of rooms in houses and condos:
Here:
5.9
State:
6.2
Median number of rooms in apartments:
Here:
4.5
State:
4.4
Notable locations in this zip code not listed on our city pages
Notable locations in zip code 70343: Terrebonne Parish Library Bourg Branch (A), Bourg Volunteer Fire Department (B). Display/hide their locations on the map
Churches in zip code 70343 include: Bourg Baptist Mission Church (A), Saint Ann Church (B), Vision Christian Center (C). Display/hide their locations on the map
In group quarters: 2 (-1 institutionalized population)
Size of family households: 688 2-persons, 224 3-persons, 447 4-persons, 53 5-persons, 24 6-persons, 54 7-or-more-persons
Size of nonfamily households: 458 1-person, 15 2-persons
573 married couples with children.
146 single-parent households (146 men).
93.7% of residents of 70343 zip code speak English at home.
0.7% of residents speak Spanish at home (31% very well, 31% well, 39% not well).
5.4% of residents speak other Indo-European language at home (100% very well).
Foreign born population: 51 (1.0%) (61.4% of them are naturalized citizens)
This zip code:
1.0%
Whole state:
4.2%
57%Honduras
36%Germany
49%French
15%American
8%French Canadian
6%English
2%Dutch
1%Canadian
0%Irish
Year of entry for the foreign-born population
172010 or later
02000 to 2009
111990 to 1999
20Before 1990
Facilities with environmental interests located in this zip code:
ACADIAN SHIPYARD (728 BOURG LAROSE HIGHWAY 24 in BOURG, LA) . Tribal Land
AIR MINOR (AIRS/AFS) (Integrated Compliance Information System) - ICIS-06-1998-0272, FORMAL ENFORCEMENT ACTION, ICIS-06-2001-0509, HAZARDOUS WASTE BIENNIAL REPORTER (Resource Conservation and Recovery Act (tracking hazardous waste)) Small Quantity Generators, between 100 kg and 1000 kg of hazardous waste/month (Resource Conservation and Recovery Act (tracking hazardous waste)) - notification TRI REPORTER (Tracking of toxic chemicals releasing facilities) Business SIC classification: COATING, ENGRAVING, AND ALLIED SERVICES; SHIP BUILDING AND REPAIRING Business NAICS classification: SHIP BUILDING AND REPAIRING. Organizations: KEITH S EDWARDS (CONTACT/OWNER)
Alternative names: ACADIAN SHIPYARD-BOURG, ACADIAN SHIPYARDS INC, SOUDELIER
BOURG ELEMENTARY SCHOOL (4413 SAINT ANDREW STREET in BOURG, LA)
(Geographic Names Information System) (National Center for Education Statistics) - STATE ID-055004 Organizations: TERREBONNE PARISH SCHOOL BOARD (SCHOOL DISTRICT)
ACADIAN SHIPYARD INC (723 BOURG LAROSE H24 in BOURG, LA)
AIR MINOR (AIRS/AFS) Business SIC classification: COATING, ENGRAVING, AND ALLIED SERVICES Alternative names: SOUDELIER
BOURG DRY DOCK SERVICE CO (136 DRY DOCK RD in BOURG, LA) . Tribal Land
AIR MINOR (AIRS/AFS) Business SIC classification: BOAT BUILDING AND REPAIRING Alternative names: BOURG DRY DOCK CO, CHRIS GONSOULIN
BOURG DRY DOCK & SERVICE (LA HWY 316 (LOWER FERRY RD) in BOURG, LA)
National Pollutant Discharge Elimination System NON-MAJOR (Tracking pollutant discharge elimination systems) - permit Business SIC classification: SHIP BUILDING AND REPAIRING
GRAND BOIS FACILITY (7 MI E OF in GRAND BOIS, LA)
AIR MINOR (AIRS/AFS) Business SIC classification: CRUDE PETROLEUM AND NATURAL GAS Alternative names: CASTEX ENGY INC GRND, FINA GRAND BOIS FACility, ROBERT J HOLT
GUIDRY/EXXON FEE FACILITY (BOURG FIELD in BOURG, LA)
National Pollutant Discharge Elimination System NON-MAJOR (Tracking pollutant discharge elimination systems) - permit Business SIC classification: CRUDE PETROLEUM AND NATURAL GAS
DWAYNE RICHARD ( in BOURG, LA)
National Pollutant Discharge Elimination System NON-MAJOR (Tracking pollutant discharge elimination systems) - permit Business SIC classification: CARWASHES Alternative names: DWAYNE RICHARD-FORMERLY L
ELLENDER FARMS INCORPORATED (235 HIGHWAY 55 in BOURG, LA)
National Pollutant Discharge Elimination System NON-MAJOR (Tracking pollutant discharge elimination systems) - permit
EXCO BOURG FLD PF (SEC 37 T7S R18E in BOURG, LA)
AIR MINOR (AIRS/AFS) Business SIC classification: CRUDE PETROLEUM AND NATURAL GAS
BOURG DRY DOCK & SVC CO INC (136 DRY DOCK RD in BOURG, LA) . Tribal Land
Conditionally Exempt Small Quantity Generators, less than 100 kg/month of hazardous waste (Resource Conservation and Recovery Act (tracking hazardous waste)) - notification Business NAICS classification: SHIP BUILDING AND REPAIRING. Organizations: BOURG DRYDOCK (CONTACT/OWNER)
GRAND BOIS (HWY 124 5M E OF in BOURG, LA)
CRITERIA AND HAZARDOUS AIR POLLUTANT INVENTORY (Inventory of air pollution sources) Business SIC and NAICS classification: CRUDE PETROLEUM AND NATURAL GAS
Housing units lacking complete plumbing facilities: 1.0% Housing units lacking complete kitchen facilities: 0.3%
57.7%Electricity
41.8%Utility gas
0.6%Bottled, tank, or LP gas
Population in 1990: 5,310.
Place of birth for U.S.-born residents:
This state: 4,513
Northeast: 157
Midwest: 39
South: 287
West: 21
73% of the 70343 zip code residents lived in the same house 5 years ago. Out of people who lived in different houses, 79% lived in this county. Out of people who lived in different counties, 50% lived in Louisiana.
93% of the 70343 zip code residents lived in the same house 1 year ago. Out of people who lived in different houses, 71% moved from this county. Out of people who lived in different houses, 28% moved from different county within same state.
Private vs. public school enrollment:
Students in private schools in grades 1 to 8 (elementary and middle school): 221
Here:
34.7%
Louisiana:
19.6%
Students in private schools in grades 9 to 12 (high school): 31
Here:
14.7%
Louisiana:
18.3%
Students in private undergraduate colleges: 46
Here:
47.5%
Louisiana:
17.4%
Occupation by median earnings in the past 12 months ($)
145,380Transportation occupations
97,537Management occupations
63,352Business and financial operations occupations
60,003Production occupations
55,841Construction and extraction occupations
54,869Installation, maintenance, and repair occupations
Companies with federal contracts located in this zip code:
AIR FILTER SERVICE (OFF HWY 190 in BOURG, LA; small business)
$21,912 with Army for Maintenance, Repair and Rebuilding of Equipment -- Refrigeration, Air Conditioning, and Air Circulating Equipment. Signed on 2002-10-01. Completion date: 2003-09-30.
Top industries in this zip code by the number of employees in 2005:
Mining: Support Activities for Oil and Gas Operations (20-49 employees: 1 establishment, 10-19 employees: 1 establishment, 1-4 employees: 2 establishments)
Accommodation and Food Services: Limited-Service Restaurants (10-19: 1, 5-9: 2)
Construction: New Single-Family Housing Construction (except Operative Builders) (10-19: 1, 5-9: 1)
Other Services (except Public Administration): Religious Organizations (10-19: 1, 5-9: 1)
Fatal accident statistics in 2014:
Fatal accident count: 2
Vehicles involved in fatal accidents: 4
Fatal accidents caused by drunken drivers: 0
Fatalities: 3
Persons involved in fatal accidents: 7
Pedestrians involved in fatal accidents: 0
Fatal accident statistics in 2013:
Fatal accident count: 3
Vehicles involved in fatal accidents: 4
Fatal accidents caused by drunken drivers: 3
Fatalities: 4
Persons involved in fatal accidents: 11
Pedestrians involved in fatal accidents: 1
Home Mortgage Disclosure Act Aggregated Statistics For Year 2009 (Based on 4 partial tracts)
A) FHA, FSA/RHS & VA Home Purchase Loans
B) Conventional Home Purchase Loans
C) Refinancings
D) Home Improvement Loans
F) Non-occupant Loans on < 5 Family Dwellings (A B C & D)
G) Loans On Manufactured Home Dwelling (A B C & D)
Number
Average Value
Number
Average Value
Number
Average Value
Number
Average Value
Number
Average Value
Number
Average Value
LOANS ORIGINATED
25
$158,945
25
$135,919
102
$152,027
19
$51,307
6
$123,410
5
$59,956
APPLICATIONS APPROVED, NOT ACCEPTED
4
$210,132
6
$45,802
14
$154,940
2
$16,010
0
$0
6
$36,695
APPLICATIONS DENIED
9
$153,357
14
$129,479
40
$142,150
19
$86,108
1
$30,410
12
$64,637
APPLICATIONS WITHDRAWN
1
$302,700
6
$361,140
32
$162,650
0
$0
0
$0
1
$200,550
FILES CLOSED FOR INCOMPLETENESS
1
$189,760
1
$38,920
12
$118,107
2
$69,945
0
$0
1
$52,510
Aggregated Statistics For Year 2008 (Based on 4 partial tracts)
A) FHA, FSA/RHS & VA Home Purchase Loans
B) Conventional Home Purchase Loans
C) Refinancings
D) Home Improvement Loans
F) Non-occupant Loans on < 5 Family Dwellings (A B C & D)
G) Loans On Manufactured Home Dwelling (A B C & D)
Number
Average Value
Number
Average Value
Number
Average Value
Number
Average Value
Number
Average Value
Number
Average Value
LOANS ORIGINATED
16
$157,438
50
$150,691
73
$130,386
24
$25,768
6
$79,132
16
$52,176
APPLICATIONS APPROVED, NOT ACCEPTED
1
$173,780
3
$115,790
18
$124,818
3
$38,140
0
$0
3
$31,983
APPLICATIONS DENIED
8
$189,368
17
$90,992
38
$115,919
24
$53,222
1
$94,180
18
$54,509
APPLICATIONS WITHDRAWN
0
$0
9
$174,409
19
$141,222
2
$34,720
0
$0
1
$98,640
FILES CLOSED FOR INCOMPLETENESS
0
$0
0
$0
5
$157,888
0
$0
0
$0
0
$0
Aggregated Statistics For Year 2007 (Based on 4 partial tracts)
A) FHA, FSA/RHS & VA Home Purchase Loans
B) Conventional Home Purchase Loans
C) Refinancings
D) Home Improvement Loans
F) Non-occupant Loans on < 5 Family Dwellings (A B C & D)
G) Loans On Manufactured Home Dwelling (A B C & D)
Number
Average Value
Number
Average Value
Number
Average Value
Number
Average Value
Number
Average Value
Number
Average Value
LOANS ORIGINATED
9
$133,699
67
$138,008
95
$120,389
34
$42,468
5
$64,164
10
$69,014
APPLICATIONS APPROVED, NOT ACCEPTED
0
$0
15
$129,652
26
$89,975
8
$42,536
1
$98,530
6
$66,242
APPLICATIONS DENIED
0
$0
21
$98,837
50
$119,146
16
$52,601
1
$16,300
22
$62,594
APPLICATIONS WITHDRAWN
0
$0
7
$164,706
17
$138,651
8
$73,524
0
$0
2
$89,610
FILES CLOSED FOR INCOMPLETENESS
0
$0
2
$138,060
6
$201,538
0
$0
0
$0
1
$142,320
Aggregated Statistics For Year 2006 (Based on 4 partial tracts)
A) FHA, FSA/RHS & VA Home Purchase Loans
B) Conventional Home Purchase Loans
C) Refinancings
D) Home Improvement Loans
F) Non-occupant Loans on < 5 Family Dwellings (A B C & D)
G) Loans On Manufactured Home Dwelling (A B C & D)
Number
Average Value
Number
Average Value
Number
Average Value
Number
Average Value
Number
Average Value
Number
Average Value
LOANS ORIGINATED
7
$106,057
99
$109,327
95
$115,186
32
$34,144
6
$90,547
22
$47,420
APPLICATIONS APPROVED, NOT ACCEPTED
4
$83,722
24
$124,483
29
$106,568
7
$28,367
1
$79,070
10
$47,025
APPLICATIONS DENIED
2
$79,065
40
$105,840
51
$94,237
11
$50,809
2
$37,100
27
$56,406
APPLICATIONS WITHDRAWN
2
$100,960
11
$114,918
30
$147,675
8
$59,598
0
$0
2
$90,015
FILES CLOSED FOR INCOMPLETENESS
0
$0
1
$196,160
11
$142,252
0
$0
0
$0
0
$0
Aggregated Statistics For Year 2005 (Based on 4 partial tracts)
A) FHA, FSA/RHS & VA Home Purchase Loans
B) Conventional Home Purchase Loans
C) Refinancings
D) Home Improvement Loans
F) Non-occupant Loans on < 5 Family Dwellings (A B C & D)
G) Loans On Manufactured Home Dwelling (A B C & D)
Number
Average Value
Number
Average Value
Number
Average Value
Number
Average Value
Number
Average Value
Number
Average Value
LOANS ORIGINATED
10
$101,635
79
$122,936
113
$111,305
24
$34,235
5
$136,652
13
$37,242
APPLICATIONS APPROVED, NOT ACCEPTED
0
$0
19
$75,033
26
$108,165
9
$31,321
0
$0
12
$53,734
APPLICATIONS DENIED
7
$55,999
32
$71,728
70
$99,600
20
$42,477
2
$119,815
32
$50,058
APPLICATIONS WITHDRAWN
2
$91,230
20
$117,056
40
$139,722
11
$116,531
4
$94,575
5
$90,986
FILES CLOSED FOR INCOMPLETENESS
0
$0
5
$72,310
22
$141,564
0
$0
0
$0
1
$86,360
Aggregated Statistics For Year 2004 (Based on 4 partial tracts)
A) FHA, FSA/RHS & VA Home Purchase Loans
B) Conventional Home Purchase Loans
C) Refinancings
D) Home Improvement Loans
F) Non-occupant Loans on < 5 Family Dwellings (A B C & D)
G) Loans On Manufactured Home Dwelling (A B C & D)
Number
Average Value
Number
Average Value
Number
Average Value
Number
Average Value
Number
Average Value
Number
Average Value
LOANS ORIGINATED
10
$91,002
83
$118,093
157
$103,209
38
$33,728
5
$70,382
18
$52,012
APPLICATIONS APPROVED, NOT ACCEPTED
5
$59,604
23
$106,123
48
$88,539
11
$35,291
0
$0
17
$43,138
APPLICATIONS DENIED
5
$72,138
23
$62,742
106
$98,035
29
$45,498
3
$45,867
27
$48,326
APPLICATIONS WITHDRAWN
0
$0
6
$115,807
44
$97,386
2
$33,450
1
$47,720
0
$0
FILES CLOSED FOR INCOMPLETENESS
0
$0
1
$126,510
34
$98,604
5
$36,978
0
$0
3
$65,840
Aggregated Statistics For Year 2003 (Based on 4 partial tracts)
A) FHA, FSA/RHS & VA Home Purchase Loans
B) Conventional Home Purchase Loans
C) Refinancings
D) Home Improvement Loans
F) Non-occupant Loans on < 5 Family Dwellings (A B C & D)
Number
Average Value
Number
Average Value
Number
Average Value
Number
Average Value
Number
Average Value
LOANS ORIGINATED
5
$93,094
84
$95,075
282
$89,572
42
$22,987
8
$106,554
APPLICATIONS APPROVED, NOT ACCEPTED
1
$65,450
9
$75,419
48
$88,976
10
$12,818
0
$0
APPLICATIONS DENIED
2
$37,410
34
$53,341
93
$87,796
19
$22,027
3
$37,663
APPLICATIONS WITHDRAWN
0
$0
1
$72,980
38
$116,898
1
$7,300
0
$0
FILES CLOSED FOR INCOMPLETENESS
1
$119,210
0
$0
6
$121,588
0
$0
0
$0
Aggregated Statistics For Year 2002 (Based on 2 partial tracts)
A) FHA, FSA/RHS & VA Home Purchase Loans
B) Conventional Home Purchase Loans
C) Refinancings
D) Home Improvement Loans
F) Non-occupant Loans on < 5 Family Dwellings (A B C & D)
Number
Average Value
Number
Average Value
Number
Average Value
Number
Average Value
Number
Average Value
LOANS ORIGINATED
12
$86,060
58
$81,499
164
$88,070
45
$19,354
4
$16,118
APPLICATIONS APPROVED, NOT ACCEPTED
2
$133,805
18
$53,589
30
$64,104
10
$33,329
2
$45,615
APPLICATIONS DENIED
9
$56,630
39
$47,596
56
$65,012
11
$19,131
5
$50,846
APPLICATIONS WITHDRAWN
0
$0
6
$83,527
13
$80,188
1
$42,570
1
$36,490
FILES CLOSED FOR INCOMPLETENESS
0
$0
1
$65,690
9
$90,149
0
$0
0
$0
Aggregated Statistics For Year 2001 (Based on 2 partial tracts)
A) FHA, FSA/RHS & VA Home Purchase Loans
B) Conventional Home Purchase Loans
C) Refinancings
D) Home Improvement Loans
F) Non-occupant Loans on < 5 Family Dwellings (A B C & D)
Number
Average Value
Number
Average Value
Number
Average Value
Number
Average Value
Number
Average Value
LOANS ORIGINATED
9
$80,552
72
$93,139
170
$84,490
49
$20,927
6
$31,018
APPLICATIONS APPROVED, NOT ACCEPTED
1
$104,610
12
$80,688
38
$70,487
18
$20,544
2
$38,925
APPLICATIONS DENIED
0
$0
41
$39,578
84
$67,655
23
$25,967
6
$19,057
APPLICATIONS WITHDRAWN
1
$93,660
7
$89,144
39
$67,463
4
$2,432
0
$0
FILES CLOSED FOR INCOMPLETENESS
0
$0
9
$96,637
10
$59,604
0
$0
0
$0
Aggregated Statistics For Year 2000 (Based on 2 partial tracts)
A) FHA, FSA/RHS & VA Home Purchase Loans
B) Conventional Home Purchase Loans
C) Refinancings
D) Home Improvement Loans
F) Non-occupant Loans on < 5 Family Dwellings (A B C & D)
Number
Average Value
Number
Average Value
Number
Average Value
Number
Average Value
Number
Average Value
LOANS ORIGINATED
0
$0
80
$70,718
56
$75,960
39
$24,078
4
$54,130
APPLICATIONS APPROVED, NOT ACCEPTED
2
$62,645
15
$57,982
22
$61,705
7
$15,813
1
$41,360
APPLICATIONS DENIED
2
$60,820
36
$43,250
64
$53,541
19
$18,374
2
$54,740
APPLICATIONS WITHDRAWN
4
$42,270
5
$132,588
29
$53,983
2
$19,460
0
$0
FILES CLOSED FOR INCOMPLETENESS
0
$0
0
$0
5
$62,036
2
$26,760
0
$0
Aggregated Statistics For Year 1999 (Based on 1 partial tract)
A) FHA, FSA/RHS & VA Home Purchase Loans
B) Conventional Home Purchase Loans
C) Refinancings
D) Home Improvement Loans
F) Non-occupant Loans on < 5 Family Dwellings (A B C & D)
Detailed PMIC statistics for the following Tracts:0010.00
, 0216.02
2002 - 2018 National Fire Incident Reporting System (NFIRS) incidents
Based on the data from the years 2002 - 2018 the average number of fire incidents per year is 16. The highest number of fire incidents - 31 took place in 2010, and the least - 0 in 2007. The data has a decreasing trend.
When looking into fire subcategories, the most incidents belonged to: Outside Fires (64.6%), and Structure Fires (21.5%).
Fire incident types reported to NFIRS in Zip Code 70343

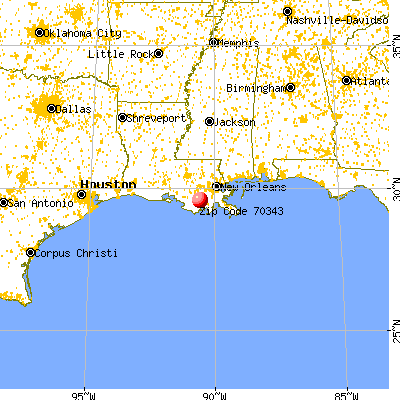


 Nearest zip codes: 70374, 70375, 70364, 70363, 70394, 70355.


 . Tribal Land


 Based on the data from the years 2002 - 2018 the average number of fire incidents per year is 16. The highest number of fire incidents - 31 took place in 2010, and the least - 0 in 2007. The data has a decreasing trend.
 When looking into fire subcategories, the most incidents belonged to: Outside Fires (64.6%), and Structure Fires (21.5%).