Estimated zip code population in 2022: 1,838 Zip code population in 2010: 1,712 Zip code population in 2000: 1,879
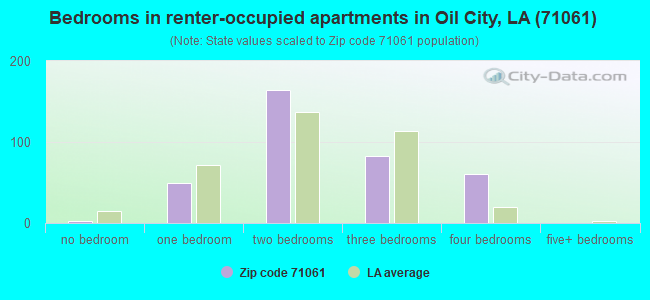
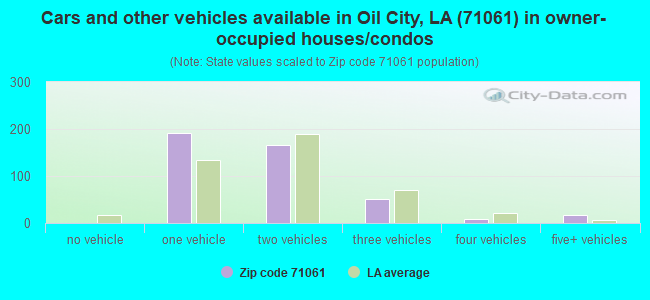
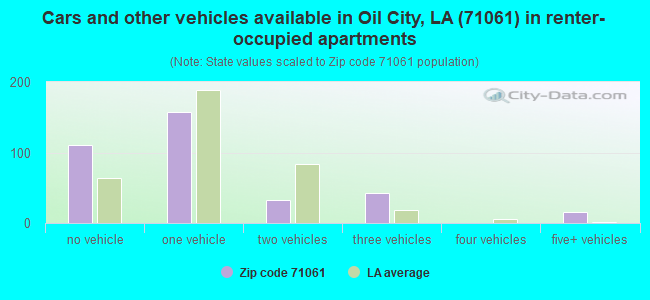
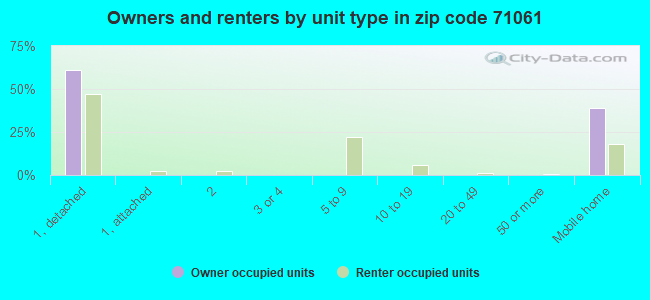
Houses and condos: 1,004 Renter-occupied apartments: 361
% of renters here:
45%
State:
32%
March 2022 cost of living index in zip code 71061: 79.0 (low, U.S. average is 100)
Land area: 18.4 sq. mi. Water area: 0.5 sq. mi.
Population density: 100 people per square mile
(very low).
OSM Map
General Map
Google Map
MSN Map
OSM Map
General Map
Google Map
MSN Map
OSM Map
General Map
Google Map
MSN Map
OSM Map
General Map
Google Map
MSN Map
Please wait while loading the map...
Real estate property taxes paid for housing units in 2022:
This zip code:
0.3% ($368)
Louisiana:
0.5% ($1,127)
Median real estate property taxes paid for housing units with mortgages in 2022: $1,369 (0.6%) Median real estate property taxes paid for housing units with no mortgage in 2022: $224 (0.2%)
Business Search- 14 Million verified businesses
Males: 884
(48.1%)
Females: 954
(51.9%)
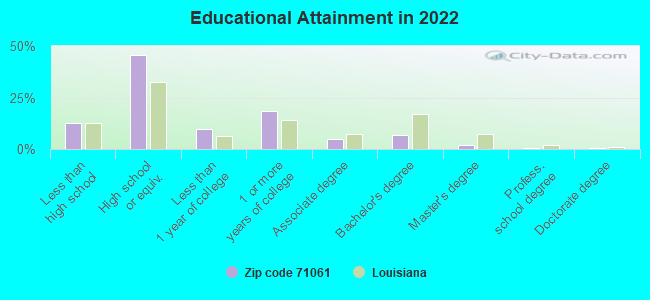
For population 25 years and over in 71061:
High school or higher: 86.2%
Bachelor's degree or higher: 9.2%
Graduate or professional degree: 2.5%
Unemployed: 9.5%
Mean travel time to work (commute): 27.1 minutes
For population 15 years and over in 71061:
Never married: 33.5%
Now married: 40.0%
Separated: 3.4%
Widowed: 10.3%
Divorced: 12.8%
Zip code 71061 compared to state average:
Median household income below state average.
Median house value below state average.
Unemployed percentage above state average.
Foreign-born population percentage below state average.
Length of stay since moving in significantly above state average.
Number of college students below state average.
Percentage of population with a bachelor's degree or higher significantly below state average.
Averages for the 2020 tax year for zip code 71061, filed in 2021:
Average Adjusted Gross Income (AGI) in 2020: $41,602 (Individual Income Tax Returns)
Here:
$41,602
State:
$60,757
Salary/wage: $37,596 (reported on 76.2% of returns)
Here:
$37,596
State:
$50,882
(% of AGI for various income ranges: 1133.2% for AGIs below $25k, 3690.0% for AGIs $25k-50k, 5885.0% for AGIs $50k-75k, 12795.0% for AGIs $75k-100k, 15650.0% for AGIs $100k-200k)
Taxable interest for individuals: $1,450 (reported on 19.0% of returns)
This zip code:
$1,450
Louisiana:
$1,576
(% of AGI for various income ranges: 2.8% for AGIs below $25k, 8.3% for AGIs $25k-50k, 48.3% for AGIs $50k-75k, 640.0% for AGIs $75k-100k)
Ordinary dividends: $4,300 (reported on 7.9% of returns)
Here:
$4,300
State:
$7,743
(% of AGI for various income ranges: 9.2% for AGIs below $25k, 320.0% for AGIs $50k-75k)
Net capital gain/loss in AGI: +$5,020 (reported on 7.9% of returns)
Here:
+$5,020
State:
+$16,917
(% of AGI for various income ranges: 25.8% for AGIs $25k-50k, 1100.0% for AGIs $75k-100k)
Profit/loss from business: +$982 (reported on 27.0% of returns)
Here:
+$982
State:
+$7,679
(% of AGI for various income ranges: 1675.0% for AGIs $75k-100k)
Total itemized deductions: $47,450 (reported on 3.2% of returns)
Here:
$47,450
State:
$36,265
(% of AGI for various income ranges: 790.8% for AGIs $25k-50k)
Taxes paid: $6,350 (reported on 3.2% of returns)
71061:
$6,350
State:
$6,643
(% of AGI for various income ranges: 105.8% for AGIs $25k-50k)
Earned income credit: $2,709 (reported on 36.5% of returns)
Here:
$2,709
State:
$2,671
(% of AGI for various income ranges: 176.0% for AGIs below $25k, 152.5% for AGIs $25k-50k)
Percentage of individuals using paid preparers for their 2020 taxes: 93.7%
Here:
94%
State:
92%
(% for various income ranges: 90.0% for AGIs below $25k, 93.8% for AGIs $25k-50k, 100.0% for AGIs $50k-75k, 100.0% for AGIs $75k-100k, 100.0% for AGIs $100k-200k)
Averages for the 2012 tax year for zip code 71061, filed in 2013:
Average Adjusted Gross Income (AGI) in 2012: $52,099 (Individual Income Tax Returns)
Here:
$52,099
State:
$56,730
Salary/wage: $38,949 (reported on 82.6% of returns)
Here:
$38,949
State:
$45,545
(% of AGI for various income ranges: 73.6% for AGIs below $25k, 78.1% for AGIs $25k-50k, 83.8% for AGIs $50k-75k, 78.4% for AGIs $75k-100k, 40.3% for AGIs $100k-200k)
Taxable interest for individuals: $987 (reported on 21.7% of returns)
This zip code:
$987
Louisiana:
$1,804
(% of AGI for various income ranges: 0.7% for AGIs below $25k, 0.4% for AGIs $25k-50k, 0.2% for AGIs $50k-75k, 0.5% for AGIs $100k-200k)
Ordinary dividends: $2,914 (reported on 10.1% of returns)
Here:
$2,914
State:
$7,610
Net capital gain/loss in AGI: +$22,020 (reported on 7.2% of returns)
Here:
+$22,020
State:
+$17,096
Profit/loss from business: +$20,594 (reported on 24.6% of returns)
Here:
+$20,594
State:
+$12,088
(% of AGI for various income ranges: 12.1% for AGIs below $25k, 3.7% for AGIs $25k-50k, 7.8% for AGIs $50k-75k, 14.7% for AGIs $100k-200k)
Taxable individual retirement arrangement distribution: $14,533 (reported on 4.3% of returns)
71061:
$14,533
Louisiana:
$16,085
Total itemized deductions: $29,262 (22% of AGI, reported on 18.8% of returns)
Here:
$29,262
State:
$23,585
Here:
22.0% of AGI
State:
18.1% of AGI
(% of AGI for various income ranges: 9.1% for AGIs $25k-50k, 15.0% for AGIs $50k-75k, 15.0% for AGIs $100k-200k)
Charity contributions: $12,733 (reported on 13.0% of returns)
Here:
$12,733
State:
$5,533
Taxes paid: $7,042 (reported on 17.4% of returns)
71061:
$7,042
State:
$6,282
(% of AGI for various income ranges: 1.2% for AGIs $25k-50k, 2.2% for AGIs $50k-75k, 4.0% for AGIs $100k-200k)
Earned income credit: $2,696 (reported on 33.3% of returns)
Here:
$2,696
State:
$2,633
(% of AGI for various income ranges: 14.0% for AGIs below $25k, 1.4% for AGIs $25k-50k)
Percentage of individuals using paid preparers for their 2012 taxes: 59.4%
Here:
59%
State:
57%
(% for various income ranges: 58.1% for AGIs below $25k, 56.2% for AGIs $25k-50k, 50.0% for AGIs $50k-75k, 60.0% for AGIs $75k-100k, 85.7% for AGIs $100k-200k)
Averages for the 2004 tax year for zip code 71061, filed in 2005:
Average Adjusted Gross Income (AGI) in 2004: $33,236 (Individual Income Tax Returns)
Here:
$33,236
State:
$39,411
Salary/wage: $28,063 (reported on 85.4% of returns)
Here:
$28,063
State:
$34,434
(% of AGI for various income ranges: 89.8% for AGIs below $10k, 79.7% for AGIs $10k-25k, 86.1% for AGIs $25k-50k, 77.6% for AGIs $50k-75k, 76.0% for AGIs $75k-100k, 45.3% for AGIs over 100k)
Taxable interest for individuals: $1,429 (reported on 22.6% of returns)
This zip code:
$1,429
Louisiana:
$1,606
(% of AGI for various income ranges: 1.3% for AGIs below $10k, 0.8% for AGIs $10k-25k, 0.5% for AGIs $25k-50k, 0.3% for AGIs $50k-75k, 1.1% for AGIs $75k-100k, 2.0% for AGIs over 100k)
Taxable dividends: $1,235 (reported on 9.2% of returns)
Here:
$1,235
State:
$3,235
(% of AGI for various income ranges: 0.4% for AGIs $10k-25k, 0.0% for AGIs $25k-50k, 0.1% for AGIs $50k-75k, 1.0% for AGIs over 100k)
Net capital gain/loss: +$3,070 (reported on 7.7% of returns)
Here:
+$3,070
State:
+$8,531
(% of AGI for various income ranges: -0.1% for AGIs below $10k, -0.2% for AGIs $25k-50k, 0.6% for AGIs $50k-75k, 2.5% for AGIs over 100k)
Profit/loss from business: +$2,277 (reported on 22.4% of returns)
Here:
+$2,277
State:
+$9,128
(% of AGI for various income ranges: 0.2% for AGIs below $10k, 6.4% for AGIs $10k-25k, 4.5% for AGIs $25k-50k, 1.5% for AGIs $50k-75k, -11.4% for AGIs $75k-100k)
Total itemized deductions: $19,851 (24% of AGI, reported on 16.3% of returns)
Here:
$19,851
State:
$18,222
Here:
24.1% of AGI
State:
20.3% of AGI
(% of AGI for various income ranges: 5.4% for AGIs $10k-25k, 7.7% for AGIs $25k-50k, 10.2% for AGIs $50k-75k, 16.9% for AGIs $75k-100k, 13.2% for AGIs over 100k)
Charity contributions deductions: $5,574 (6% of AGI, reported on 14.6% of returns)
Here:
$5,574
State:
$4,190
Here:
6.5% of AGI
State:
4.4% of AGI
(% of AGI for various income ranges: 1.2% for AGIs $10k-25k, 1.4% for AGIs $25k-50k, 2.2% for AGIs $50k-75k, 2.9% for AGIs $75k-100k, 4.7% for AGIs over 100k)
Total tax: $5,573 (reported on 65.4% of returns)
71061:
$5,573
State:
$6,529
(% of AGI for various income ranges: 2.9% for AGIs below $10k, 3.5% for AGIs $10k-25k, 6.4% for AGIs $25k-50k, 9.6% for AGIs $50k-75k, 11.3% for AGIs $75k-100k, 22.7% for AGIs over 100k)
Earned income credit: $2,271 (reported on 33.8% of returns)
Here:
$2,271
State:
$2,103
Percentage of individuals using paid preparers for their 2004 taxes: 75.5%
Here:
75%
State:
61%
(% for various income ranges: 75.9% for AGIs below $10k, 78.8% for AGIs $10k-25k, 72.1% for AGIs $25k-50k, 65.9% for AGIs $50k-75k, 88.0% for AGIs $75k-100k, 77.4% for AGIs over 100k)
Household received Food Stamps/SNAP in the past 12 months: 278 Household did not receive Food Stamps/SNAP in the past 12 months: 540
Women who had a birth in the past 12 months: 50 (0 now married, 52 unmarried) Women who did not have a birth in the past 12 months: 329 (151 now married, 176 unmarried)
Housing units in zip code 71061 with a mortgage: 218 Houses without a mortgage: 11
Median monthly owner costs for units with a mortgage: $1,528 Median monthly owner costs for units without a mortgage: $421
Residents with income below the poverty level in 2022:
This zip code:
29.2%
Whole state:
18.6%
Residents with income below 50% of the poverty level in 2022:
This zip code:
19.7%
Whole state:
10.1%
Median number of rooms in houses and condos:
Here:
5.8
State:
6.2
Median number of rooms in apartments:
Here:
4.2
State:
4.4
Notable locations in this zip code not listed on our city pages
Size of family households: 205 2-persons, 89 3-persons, 88 4-persons, 50 5-persons, 14 6-persons, 3 7-or-more-persons
Size of nonfamily households: 309 1-person, 22 2-persons, 15 3-persons
235 married couples with children.
139 single-parent households (75 men, 64 women).
95.9% of residents of 71061 zip code speak English at home.
3.3% of residents speak Spanish at home (100% very well).
0.4% of residents speak other language at home (100% very well).
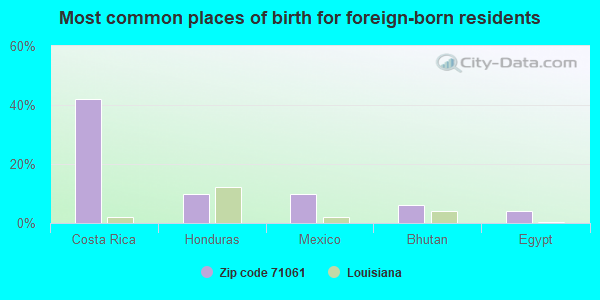
Foreign born population: 50 (2.8%) (96.3% of them are naturalized citizens)
This zip code:
2.8%
Whole state:
4.2%
42%Costa Rica
10%Honduras
10%Mexico
6%Bhutan
4%Egypt
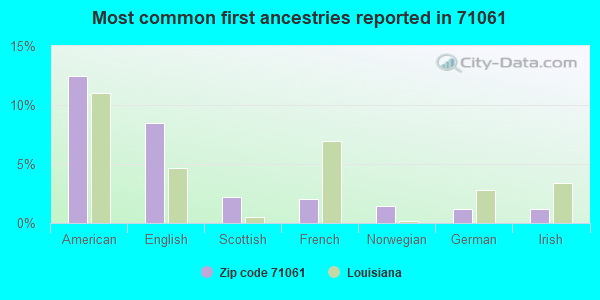
12%American
8%English
2%Scottish
2%French
1%Norwegian
1%German
1%Irish
Year of entry for the foreign-born population
02010 or later
02000 to 2009
61990 to 1999
42Before 1990
Major facilities with environmental interests located in this zip code:
ALLEN BROTHERS, INC. (P. O. BOX 248 in OIL CITY, LA)
(Integrated Compliance Information System) - ICIS-06-2003-4507, FORMAL ENFORCEMENT ACTION FORMAL ENFORCEMENT ACTION (Integrated Compliance Information System) - ICIS-06-2005-4558, ENFORCEMENT/COMPLIANCE ACTIVITY
OIL CITY ELEMENTARY SCHOOL (407 KERLEY AVENUE in OIL CITY, LA)
(National Center for Education Statistics) - STATE ID-009048 Organizations: CADDO PARISH SCHOOL BOARD (SCHOOL DISTRICT)
ALLEN BROTHERS (SECTION 34, TOWNSHIP 21N, RANGE 16W in CADDO PARISH, LA)
ALLEN BROTHERS - 4-WELL STEEL FLOWLINE (NEAR STATE 18, SEC. 34, TOWNSHIP 21 N, RANGE 16 W in OIL CITY, LA)
(Integrated Compliance Information System) - ICIS-06-2001-4507, FORMAL ENFORCEMENT ACTION Business SIC classification: CRUDE PETROLEUM AND NATURAL GAS
ALLEN BROTHERS - CL B E&F LEASE (SECTION 26, TOWNSHIP 21 N, RANGE 16 W in OIL CITY, LA)
(Integrated Compliance Information System) - ICIS-06-2001-4506, FORMAL ENFORCEMENT ACTION Business SIC classification: CRUDE PETROLEUM AND NATURAL GAS
EOTT ENERGY OPR LIMTED PARTNERSHIP (1/2 M SSW OF HWY 2 & CADDO PARISH SECTION 22 RD in CADDO, LA)
(Integrated Compliance Information System) - ICIS-06-2000-1158, FORMAL ENFORCEMENT ACTION Business SIC classification: OIL AND GAS FIELD SERVICES
CITGO PIPELINE COMPANY OIL CITY DISTR (HWY 1 N in OIL CITY, LA)
(Resource Conservation and Recovery Act (tracking hazardous waste)) Organizations: 3CITIES SERVICE PIPELINE COMPANY (CONTACT/OPERATOR)
, CITIES SVC PIPELINE CO (CONTACT/OWNER)
ANTHONY FORD INC (236 KERLEY in OIL CITY, LA)
(Resource Conservation and Recovery Act (tracking hazardous waste)) Organizations: ANTHONY CHARLES (CONTACT/OWNER)
EOTT ENERGY PIPELINE (HWY 1 N in OIL CITY, LA)
AIR MINOR (AIRS/AFS) Business SIC classification: CRUDE PETROLEUM PIPELINES Alternative names: CITY SERVICE PIPELIN
AC PITTS A TANK BATTERY (4 MI SE in OIL CITY, LA)
AIR MINOR (AIRS/AFS) Business SIC classification: CRUDE PETROLEUM AND NATURAL GAS Alternative names: TEXACO/A C PITTS-A, W A BAKER II
ALLEN BROTHERS (SHADY REST ROAD in OIL CITY, LA)
National Pollutant Discharge Elimination System NON-MAJOR (Tracking pollutant discharge elimination systems) - permit
OIL CITY, TOWN OF (202 ALLEN in OIL CITY, LA)
National Pollutant Discharge Elimination System NON-MAJOR (Tracking pollutant discharge elimination systems) - permit Business SIC classification: SEWERAGE SYSTEMS Alternative names: TOWN OF OIL CITY
PLAINS CADDO STATION (13660 HIGHWAY 538 in OIL CITY, LA)
AIR MINOR (AIRS/AFS) Business SIC classification: CRUDE PETROLEUM PIPELINES Alternative names: EOTT CADDO STATION
Housing units lacking complete plumbing facilities: 3.3% Housing units lacking complete kitchen facilities: 4.1%
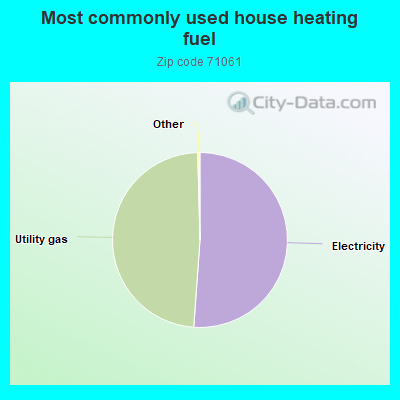
51.3%Electricity
48.6%Utility gas
Population in 1990: 1,874. Population change in the 1990s: +5 (+0.3%).
Place of birth for U.S.-born residents:
This state: 1,260
Northeast: 48
Midwest: 52
South: 390
West: 41
53% of the 71061 zip code residents lived in the same house 5 years ago. Out of people who lived in different houses, 71% lived in this county. Out of people who lived in different counties, 50% lived in Louisiana.
84% of the 71061 zip code residents lived in the same house 1 year ago. Out of people who lived in different houses, 66% moved from this county. Out of people who lived in different houses, 10% moved from different county within same state. Out of people who lived in different houses, 21% moved from different state.
Private vs. public school enrollment:
Students in private schools in grades 1 to 8 (elementary and middle school): 50
Here:
17.1%
Louisiana:
19.6%
Students in private schools in grades 9 to 12 (high school): 1
Here:
0.9%
Louisiana:
18.3%
Students in private undergraduate colleges:
Here:
0.0%
Louisiana:
17.4%
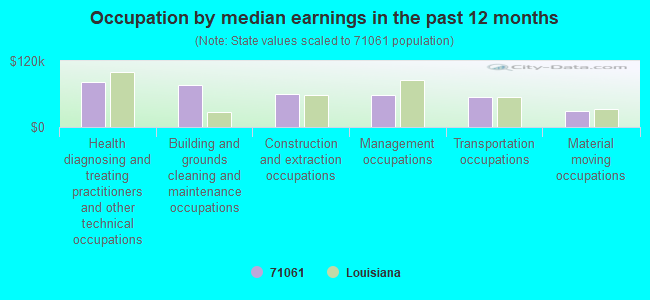
Occupation by median earnings in the past 12 months ($)
81,925Health diagnosing and treating practitioners and other technical occupations
76,330Building and grounds cleaning and maintenance occupations
59,208Construction and extraction occupations
57,706Management occupations
54,229Transportation occupations
28,695Material moving occupations
Companies with federal contracts located in this zip code:
ARK-LA-TEX POWER CLEANING AND (10261 SHADY REST RD in OIL CITY, LA; small business) : $10,480 in 2 contractsin 2005
$6,250 with Air Force for Maintenance, Repair and Rebuilding of Equipment -- Ground Effect Vehicles, Motor Vehicles, Trailers, and Cycles. Signed on 2005-09-08. Completion date: 2005-12-07.
$4,230 with Air Force for Maintenance, Repair and Rebuilding of Equipment -- Vehicular Equipment Components. Signed on 2005-02-09. Completion date: 2005-03-01.
Top industries in this zip code by the number of employees in 2005:
Construction: Other Heavy and Civil Engineering Construction (20-49: 1)
Mining: Support Activities for Oil and Gas Operations (5-9: 3, 1-4: 5)
Mining: Drilling Oil and Gas Wells (10-19: 1, 1-4: 7)
Other Services (except Public Administration): Commercial and Industrial Machinery and Equipment (except Automotive and Electronic) Repair and Maintenance (10-19: 1, 1-4: 2)
Wholesale Trade: Recyclable Material Merchant Wholesalers (10-19: 1)
Construction: Electrical Contractors (10-19: 1)
Construction: Plumbing, Heating, and Air-Conditioning Contractors (10-19: 1)
Fatal accident statistics in 2010:
Fatal accident count: 1
Vehicles involved in fatal accidents: 2
Fatal accidents caused by drunken drivers: 0
Fatalities: 1
Persons involved in fatal accidents: 2
Pedestrians involved in fatal accidents: 0
Home Mortgage Disclosure Act Aggregated Statistics For Year 2009 (Based on 2 partial tracts)
A) FHA, FSA/RHS & VA Home Purchase Loans
B) Conventional Home Purchase Loans
C) Refinancings
D) Home Improvement Loans
F) Non-occupant Loans on < 5 Family Dwellings (A B C & D)
G) Loans On Manufactured Home Dwelling (A B C & D)
Number
Average Value
Number
Average Value
Number
Average Value
Number
Average Value
Number
Average Value
Number
Average Value
LOANS ORIGINATED
1
$54,370
4
$53,220
9
$99,432
6
$20,913
2
$43,240
6
$34,753
APPLICATIONS APPROVED, NOT ACCEPTED
0
$0
0
$0
2
$67,675
1
$21,560
0
$0
1
$58,270
APPLICATIONS DENIED
0
$0
2
$45,420
2
$120,320
2
$21,680
0
$0
1
$43,820
APPLICATIONS WITHDRAWN
0
$0
0
$0
3
$133,970
0
$0
0
$0
0
$0
FILES CLOSED FOR INCOMPLETENESS
0
$0
0
$0
1
$89,470
0
$0
0
$0
0
$0
Aggregated Statistics For Year 2008 (Based on 2 partial tracts)
A) FHA, FSA/RHS & VA Home Purchase Loans
B) Conventional Home Purchase Loans
C) Refinancings
D) Home Improvement Loans
F) Non-occupant Loans on < 5 Family Dwellings (A B C & D)
G) Loans On Manufactured Home Dwelling (A B C & D)
Number
Average Value
Number
Average Value
Number
Average Value
Number
Average Value
Number
Average Value
Number
Average Value
LOANS ORIGINATED
1
$165,630
4
$57,922
9
$109,271
6
$23,667
2
$90,385
5
$33,354
APPLICATIONS APPROVED, NOT ACCEPTED
0
$0
2
$63,200
1
$69,050
0
$0
0
$0
2
$42,785
APPLICATIONS DENIED
0
$0
4
$49,150
5
$80,290
3
$34,563
0
$0
5
$41,888
APPLICATIONS WITHDRAWN
0
$0
0
$0
3
$155,687
0
$0
0
$0
0
$0
FILES CLOSED FOR INCOMPLETENESS
0
$0
0
$0
0
$0
0
$0
0
$0
0
$0
Aggregated Statistics For Year 2007 (Based on 2 partial tracts)
A) FHA, FSA/RHS & VA Home Purchase Loans
B) Conventional Home Purchase Loans
C) Refinancings
D) Home Improvement Loans
F) Non-occupant Loans on < 5 Family Dwellings (A B C & D)
G) Loans On Manufactured Home Dwelling (A B C & D)
Number
Average Value
Number
Average Value
Number
Average Value
Number
Average Value
Number
Average Value
Number
Average Value
LOANS ORIGINATED
2
$97,840
8
$68,734
10
$88,227
8
$21,708
2
$110,110
7
$35,689
APPLICATIONS APPROVED, NOT ACCEPTED
0
$0
2
$69,050
2
$77,535
1
$18,580
0
$0
1
$40,370
APPLICATIONS DENIED
0
$0
4
$78,455
5
$76,252
4
$46,568
0
$0
2
$59,530
APPLICATIONS WITHDRAWN
0
$0
1
$43,590
1
$127,320
0
$0
0
$0
0
$0
FILES CLOSED FOR INCOMPLETENESS
0
$0
0
$0
1
$43,130
0
$0
0
$0
0
$0
Aggregated Statistics For Year 2006 (Based on 2 partial tracts)
B) Conventional Home Purchase Loans
C) Refinancings
D) Home Improvement Loans
F) Non-occupant Loans on < 5 Family Dwellings (A B C & D)
G) Loans On Manufactured Home Dwelling (A B C & D)
Number
Average Value
Number
Average Value
Number
Average Value
Number
Average Value
Number
Average Value
LOANS ORIGINATED
9
$63,850
8
$66,784
7
$15,041
2
$41,520
7
$30,510
APPLICATIONS APPROVED, NOT ACCEPTED
2
$52,305
1
$165,630
1
$30,050
0
$0
1
$57,810
APPLICATIONS DENIED
5
$54,780
4
$76,448
3
$34,487
0
$0
3
$38,387
APPLICATIONS WITHDRAWN
2
$42,785
2
$80,520
0
$0
0
$0
1
$32,120
FILES CLOSED FOR INCOMPLETENESS
0
$0
1
$112,640
0
$0
0
$0
0
$0
Aggregated Statistics For Year 2005 (Based on 2 partial tracts)
A) FHA, FSA/RHS & VA Home Purchase Loans
B) Conventional Home Purchase Loans
C) Refinancings
D) Home Improvement Loans
F) Non-occupant Loans on < 5 Family Dwellings (A B C & D)
G) Loans On Manufactured Home Dwelling (A B C & D)
Number
Average Value
Number
Average Value
Number
Average Value
Number
Average Value
Number
Average Value
Number
Average Value
LOANS ORIGINATED
2
$84,305
7
$55,810
7
$64,069
6
$16,785
2
$26,610
6
$42,822
APPLICATIONS APPROVED, NOT ACCEPTED
0
$0
1
$59,410
1
$45,650
0
$0
0
$0
1
$47,940
APPLICATIONS DENIED
0
$0
4
$46,452
7
$66,951
3
$25,233
0
$0
3
$35,250
APPLICATIONS WITHDRAWN
0
$0
3
$38,693
4
$65,895
0
$0
0
$0
2
$36,820
FILES CLOSED FOR INCOMPLETENESS
0
$0
0
$0
0
$0
0
$0
0
$0
0
$0
Aggregated Statistics For Year 2004 (Based on 2 partial tracts)
A) FHA, FSA/RHS & VA Home Purchase Loans
B) Conventional Home Purchase Loans
C) Refinancings
D) Home Improvement Loans
F) Non-occupant Loans on < 5 Family Dwellings (A B C & D)
G) Loans On Manufactured Home Dwelling (A B C & D)
Number
Average Value
Number
Average Value
Number
Average Value
Number
Average Value
Number
Average Value
Number
Average Value
LOANS ORIGINATED
1
$92,680
6
$36,053
10
$80,038
6
$13,955
1
$42,670
4
$27,355
APPLICATIONS APPROVED, NOT ACCEPTED
0
$0
1
$36,930
3
$62,397
0
$0
0
$0
1
$25,460
APPLICATIONS DENIED
0
$0
5
$37,072
6
$70,502
2
$31,200
1
$52,760
4
$32,575
APPLICATIONS WITHDRAWN
0
$0
2
$17,320
4
$146,300
0
$0
0
$0
1
$6,880
FILES CLOSED FOR INCOMPLETENESS
0
$0
0
$0
0
$0
0
$0
0
$0
0
$0
Aggregated Statistics For Year 2003 (Based on 2 partial tracts)
A) FHA, FSA/RHS & VA Home Purchase Loans
B) Conventional Home Purchase Loans
C) Refinancings
D) Home Improvement Loans
F) Non-occupant Loans on < 5 Family Dwellings (A B C & D)
Number
Average Value
Number
Average Value
Number
Average Value
Number
Average Value
Number
Average Value
LOANS ORIGINATED
1
$70,880
4
$61,822
11
$72,177
3
$14,987
1
$24,320
APPLICATIONS APPROVED, NOT ACCEPTED
0
$0
1
$37,160
4
$63,200
0
$0
1
$29,820
APPLICATIONS DENIED
0
$0
6
$49,703
7
$73,867
1
$12,620
1
$51,840
APPLICATIONS WITHDRAWN
0
$0
2
$62,055
2
$60,560
1
$8,030
0
$0
FILES CLOSED FOR INCOMPLETENESS
0
$0
0
$0
0
$0
0
$0
0
$0
Aggregated Statistics For Year 2002 (Based on 2 partial tracts)
A) FHA, FSA/RHS & VA Home Purchase Loans
B) Conventional Home Purchase Loans
C) Refinancings
D) Home Improvement Loans
F) Non-occupant Loans on < 5 Family Dwellings (A B C & D)
Number
Average Value
Number
Average Value
Number
Average Value
Number
Average Value
Number
Average Value
LOANS ORIGINATED
1
$54,370
4
$66,525
11
$64,836
4
$12,502
1
$50,010
APPLICATIONS APPROVED, NOT ACCEPTED
0
$0
2
$31,545
3
$68,973
1
$33,720
0
$0
APPLICATIONS DENIED
1
$39,690
3
$24,927
5
$58,176
2
$19,615
0
$0
APPLICATIONS WITHDRAWN
0
$0
1
$41,980
2
$87,860
1
$19,730
0
$0
FILES CLOSED FOR INCOMPLETENESS
0
$0
0
$0
0
$0
0
$0
0
$0
Aggregated Statistics For Year 2001 (Based on 2 partial tracts)
A) FHA, FSA/RHS & VA Home Purchase Loans
B) Conventional Home Purchase Loans
C) Refinancings
D) Home Improvement Loans
F) Non-occupant Loans on < 5 Family Dwellings (A B C & D)
Number
Average Value
Number
Average Value
Number
Average Value
Number
Average Value
Number
Average Value
LOANS ORIGINATED
1
$84,650
6
$34,945
13
$59,768
4
$13,592
1
$41,290
APPLICATIONS APPROVED, NOT ACCEPTED
0
$0
3
$40,527
0
$0
0
$0
0
$0
APPLICATIONS DENIED
0
$0
4
$45,135
7
$46,929
3
$18,503
0
$0
APPLICATIONS WITHDRAWN
0
$0
1
$50,240
3
$64,003
0
$0
0
$0
FILES CLOSED FOR INCOMPLETENESS
0
$0
0
$0
1
$65,610
0
$0
0
$0
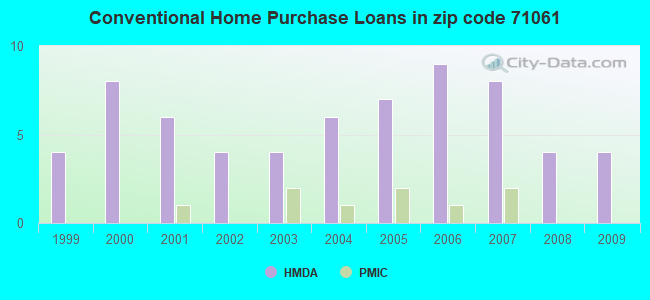
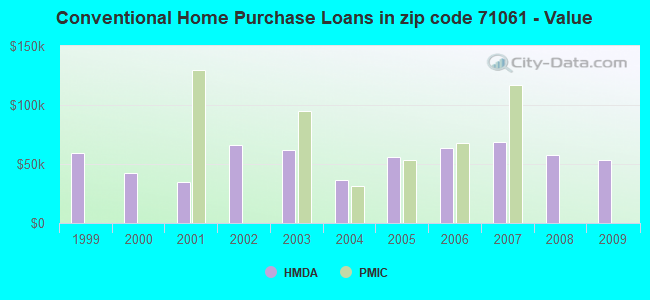
Aggregated Statistics For Year 2000 (Based on 2 partial tracts)
B) Conventional Home Purchase Loans
C) Refinancings
D) Home Improvement Loans
F) Non-occupant Loans on < 5 Family Dwellings (A B C & D)
Number
Average Value
Number
Average Value
Number
Average Value
Number
Average Value
LOANS ORIGINATED
8
$42,496
6
$46,873
5
$5,598
1
$8,950
APPLICATIONS APPROVED, NOT ACCEPTED
3
$55,440
1
$56,660
0
$0
0
$0
APPLICATIONS DENIED
9
$40,298
8
$43,988
3
$7,493
1
$35,790
APPLICATIONS WITHDRAWN
2
$33,380
4
$45,938
0
$0
0
$0
FILES CLOSED FOR INCOMPLETENESS
0
$0
2
$73,065
0
$0
0
$0
Aggregated Statistics For Year 1999 (Based on 1 partial tract)
B) Conventional Home Purchase Loans
C) Refinancings
D) Home Improvement Loans
F) Non-occupant Loans on < 5 Family Dwellings (A B C & D)
Detailed PMIC statistics for the following Tracts:0249.00
2002 - 2018 National Fire Incident Reporting System (NFIRS) incidents
Based on the data from the years 2002 - 2018 the average number of fire incidents per year is 29. The highest number of fires - 103 took place in 2011, and the least - 0 in 2007. The data has a growing trend.
When looking into fire subcategories, the most reports belonged to: Outside Fires (72.4%), and Structure Fires (19.6%).
Fire incident types reported to NFIRS in Zip Code 71061


 Nearest zip codes: 71082, 71004, 71043, 71060, 71029, 75565.


 Based on the data from the years 2002 - 2018 the average number of fire incidents per year is 29. The highest number of fires - 103 took place in 2011, and the least - 0 in 2007. The data has a growing trend.
 When looking into fire subcategories, the most reports belonged to: Outside Fires (72.4%), and Structure Fires (19.6%).