Averages for the 2020 tax year for zip code 71069, filed in 2021:
Average Adjusted Gross Income (AGI) in 2020: $37,895 (Individual Income Tax Returns)
Here:
$37,895
State:
$60,757
Salary/wage: $34,842 (reported on 86.4% of returns)
Here:
$34,842
State:
$50,882
(% of AGI for various income ranges: 926.7% for AGIs below $25k, 5756.0% for AGIs $25k-50k)
Taxable interest for individuals: $100 (reported on 18.2% of returns)
This zip code:
$100
Louisiana:
$1,576
(% of AGI for various income ranges: 8.0% for AGIs $25k-50k)
Profit/loss from business: +$4,350 (reported on 18.2% of returns)
Here:
+$4,350
State:
+$7,679
(% of AGI for various income ranges: 348.0% for AGIs $25k-50k)
Earned income credit: $2,600 (reported on 36.4% of returns)
Here:
$2,600
State:
$2,671
(% of AGI for various income ranges: 138.9% for AGIs below $25k, 166.0% for AGIs $25k-50k)
Percentage of individuals using paid preparers for their 2020 taxes: 95.5%
Here:
95%
State:
92%
(% for various income ranges: 100.0% for AGIs below $25k, 85.7% for AGIs $25k-50k, 100.0% for AGIs $50k-75k, 100.0% for AGIs $75k-100k)
Averages for the 2012 tax year for zip code 71069, filed in 2013:
Average Adjusted Gross Income (AGI) in 2012: $35,672 (Individual Income Tax Returns)
Here:
$35,672
State:
$56,730
Salary/wage: $36,124 (reported on 84.0% of returns)
Here:
$36,124
State:
$45,545
(% of AGI for various income ranges: 88.0% for AGIs below $25k, 89.7% for AGIs $25k-50k, 70.9% for AGIs $50k-75k, 88.4% for AGIs $75k-100k)
Taxable interest for individuals: $375 (reported on 16.0% of returns)
This zip code:
$375
Louisiana:
$1,804
Profit/loss from business: +$5,833 (reported on 12.0% of returns)
Here:
+$5,833
State:
+$12,088
Total itemized deductions: $22,200 (27% of AGI, reported on 12.0% of returns)
Here:
$22,200
State:
$23,585
Here:
26.7% of AGI
State:
18.1% of AGI
Charity contributions: $8,300 (reported on 8.0% of returns)
Here:
$8,300
State:
$5,533
Taxes paid: $3,267 (reported on 12.0% of returns)
71069:
$3,267
State:
$6,282
Earned income credit: $2,640 (reported on 40.0% of returns)
Here:
$2,640
State:
$2,633
(% of AGI for various income ranges: 14.5% for AGIs below $25k)
Percentage of individuals using paid preparers for their 2012 taxes: 52.0%
Here:
52%
State:
57%
(% for various income ranges: 50.0% for AGIs below $25k, 40.0% for AGIs $25k-50k, 66.7% for AGIs $50k-75k, 66.7% for AGIs $75k-100k)
Averages for the 2004 tax year for zip code 71069, filed in 2005:
Average Adjusted Gross Income (AGI) in 2004: $27,490 (Individual Income Tax Returns)
Here:
$27,490
State:
$39,411
Salary/wage: $26,093 (reported on 86.7% of returns)
Here:
$26,093
State:
$34,434
(% of AGI for various income ranges: 79.1% for AGIs below $10k, 80.1% for AGIs $10k-25k, 88.4% for AGIs $25k-50k, 80.9% for AGIs $50k-75k, 79.5% for AGIs $75k-100k)
Taxable interest for individuals: $491 (reported on 19.2% of returns)
This zip code:
$491
Louisiana:
$1,606
(% of AGI for various income ranges: 1.1% for AGIs $10k-25k, 0.4% for AGIs $50k-75k, 0.1% for AGIs $75k-100k)
Profit/loss from business: +$4,257 (reported on 12.2% of returns)
Here:
+$4,257
State:
+$9,128
Total itemized deductions: $15,310 (24% of AGI, reported on 10.1% of returns)
Here:
$15,310
State:
$18,222
Here:
23.6% of AGI
State:
20.3% of AGI
Charity contributions deductions: $4,682 (7% of AGI, reported on 7.7% of returns)
Here:
$4,682
State:
$4,190
Here:
6.7% of AGI
State:
4.4% of AGI
Total tax: $3,536 (reported on 58.0% of returns)
71069:
$3,536
State:
$6,529
(% of AGI for various income ranges: 2.3% for AGIs below $10k, 3.1% for AGIs $10k-25k, 4.8% for AGIs $25k-50k, 9.2% for AGIs $50k-75k, 13.5% for AGIs $75k-100k)
Earned income credit: $2,177 (reported on 39.5% of returns)
Here:
$2,177
State:
$2,103
Percentage of individuals using paid preparers for their 2004 taxes: 67.1%
Here:
67%
State:
61%
(% for various income ranges: 59.7% for AGIs below $10k, 68.9% for AGIs $10k-25k, 66.7% for AGIs $25k-50k, 67.9% for AGIs $50k-75k, 85.0% for AGIs $75k-100k)
Household received Food Stamps/SNAP in the past 12 months: 49 Household did not receive Food Stamps/SNAP in the past 12 months: 210
Women who did not have a birth in the past 12 months: 66 (27 now married, 38 unmarried)
Housing units in zip code 71069 with a mortgage: 63 (8 second mortgage, 4 both second mortgage and home equity loan) Median monthly owner costs for units with a mortgage: $1,180 Median monthly owner costs for units without a mortgage: $308
Residents with income below the poverty level in 2022:
This zip code:
21.6%
Whole state:
18.6%
Residents with income below 50% of the poverty level in 2022:
This zip code:
7.8%
Whole state:
10.1%
Median number of rooms in houses and condos:
Here:
5.6
State:
6.2
Median number of rooms in apartments:
Here:
4.8
State:
4.4
Notable locations in this zip code not listed on our city pages
Churches in zip code 71069 include: Three States Church (A), Antioch Church (B), Arkadelphia Church (C), Pleasant Grove Church (D), Saint Matthew Church (E). Display/hide their locations on the map
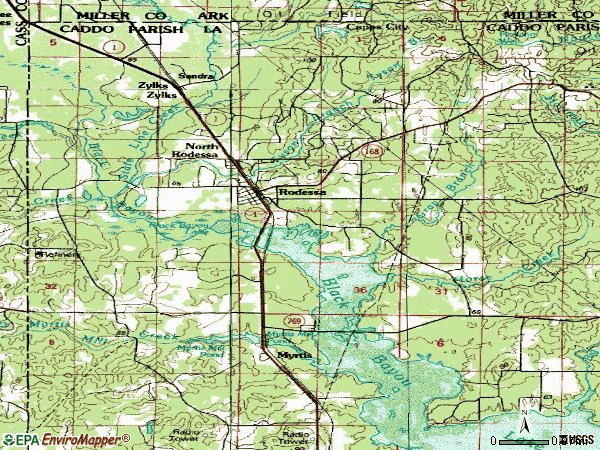
Streams, rivers, and creeks: Hoss Creek (A), Horse Creek (B), Gray Branch (C), State Line Creek (D), Tyson Branch (E). Display/hide their locations on the map
Size of family households: 55 2-persons, 10 3-persons, 9 4-persons, 15 5-persons, 3 7-or-more-persons
Size of nonfamily households: 157 1-person, 9 2-persons
60 married couples with children.
26 single-parent households (26 women).
99.3% of residents of 71069 zip code speak English at home.
1.3% of residents speak Spanish at home (100% very well).
0.2% of residents speak Asian or Pacific Island language at home (100% very well).
Foreign born population: 0 (0.0%)
:
0.0%
Whole state:
4.2%
20%African
19%American
8%Irish
6%German
Facilities with environmental interests located in this zip code:
HEATH BENTLEY LEASES - RODESSA FIELD (RODESSA FIELD in RODESSA, LA)
AIR MINOR (AIRS/AFS) Business SIC classification: CRUDE PETROLEUM AND NATURAL GAS Alternative names: C E HACKSTEDT, UMC HEATH BENTLEY, UMC THOMAS LEASE
R & R WASTE OIL CO (HWY 168 in RODESSA, LA)
(Resource Conservation and Recovery Act (tracking hazardous waste)) Organizations: SAMUEL THOMPSON AND RALPH E POWELL (CONTACT/OWNER)
BIB "O" (22299 LA HWY 1 in RODESSA, LA)
National Pollutant Discharge Elimination System NON-MAJOR (Tracking pollutant discharge elimination systems) - permit Alternative names: BIG "O"
PENNZOIL E P CO (6M N VIVIAN ON HWY 1 in RODESSA, LA)
AIR MINOR (AIRS/AFS) Business SIC classification: CRUDE PETROLEUM AND NATURAL GAS Alternative names: ED HOUSTON, PENNZOIL E & P COMPANY
PITTS TEAMER FEE 776 ROL LEASES - RODE (RODESSA FIELD in RODESSA, LA)
AIR MINOR (AIRS/AFS) Business SIC classification: CRUDE PETROLEUM AND NATURAL GAS Alternative names: PITTS TEAMER FEE 776 ROL LEASES RODESS, UMC PITTS TEAMER FEE
RADIUM PETROLEUM COMPANY (FRONT STREET in RODESSA, LA)
TRANSPORTER (Resource Conservation and Recovery Act (tracking hazardous waste))
RATCLIFF #2 PRODUCTION FACILITY - RODESS (7 KM NE OF in RODESSA, LA)
AIR MINOR (AIRS/AFS) Business SIC classification: CRUDE PETROLEUM AND NATURAL GAS
EWR TRUCKING (J S TEAMER #2 in RODESSA, LA)
National Pollutant Discharge Elimination System NON-MAJOR (Tracking pollutant discharge elimination systems) - permit
Housing units lacking complete plumbing facilities: 1.5% Housing units lacking complete kitchen facilities: 4.0%
57.7%Electricity
24.4%Utility gas
10.0%Bottled, tank, or LP gas
8.8%No fuel used
Population in 1990: 1,014.
Place of birth for U.S.-born residents:
This state: 347
Midwest: 31
South: 74
West: 25
59% of the 71069 zip code residents lived in the same house 5 years ago. Out of people who lived in different houses, 65% lived in this county. Out of people who lived in different counties, 50% lived in Louisiana.
79% of the 71069 zip code residents lived in the same house 1 year ago. Out of people who lived in different houses, 73% moved from this county. Out of people who lived in different houses, 21% moved from different state.
Private vs. public school enrollment:
Students in private schools in grades 1 to 8 (elementary and middle school):
Here:
0.0%
Louisiana:
19.6%
Students in private schools in grades 9 to 12 (high school):
Here:
0.0%
Louisiana:
18.3%
Students in private undergraduate colleges: 10
Here:
100.0%
Louisiana:
17.4%
Occupation by median earnings in the past 12 months ($)
30,107Production occupations
11,313Education, training, and library occupations
Top industries in this zip code by the number of employees in 2005:
Mining: Drilling Oil and Gas Wells (5-9 employees: 1 establishment)
Construction: Electrical Contractors (1-4: 1)
Mining: Crude Petroleum and Natural Gas Extraction (1-4: 1)
Mining: Support Activities for Oil and Gas Operations (1-4: 1)
Fatal accident statistics in 2013:
Fatal accident count: 1
Vehicles involved in fatal accidents: 1
Fatal accidents caused by drunken drivers: 0
Fatalities: 1
Persons involved in fatal accidents: 1
Pedestrians involved in fatal accidents: 0
Fatal accident statistics in 2011:
Fatal accident count: 1
Vehicles involved in fatal accidents: 1
Fatal accidents caused by drunken drivers: 1
Fatalities: 1
Persons involved in fatal accidents: 1
Pedestrians involved in fatal accidents: 0
Home Mortgage Disclosure Act Aggregated Statistics For Year 2009 (Based on 2 partial tracts)
A) FHA, FSA/RHS & VA Home Purchase Loans
B) Conventional Home Purchase Loans
C) Refinancings
D) Home Improvement Loans
F) Non-occupant Loans on < 5 Family Dwellings (A B C & D)
G) Loans On Manufactured Home Dwelling (A B C & D)
Number
Average Value
Number
Average Value
Number
Average Value
Number
Average Value
Number
Average Value
Number
Average Value
LOANS ORIGINATED
2
$77,410
2
$20,695
7
$136,684
6
$17,380
1
$23,480
3
$27,197
APPLICATIONS APPROVED, NOT ACCEPTED
0
$0
1
$24,280
0
$0
0
$0
0
$0
0
$0
APPLICATIONS DENIED
1
$89,150
1
$23,480
6
$119,333
3
$55,987
1
$34,630
2
$49,155
APPLICATIONS WITHDRAWN
0
$0
0
$0
0
$0
1
$63,680
0
$0
0
$0
FILES CLOSED FOR INCOMPLETENESS
0
$0
0
$0
1
$68,460
0
$0
0
$0
1
$44,180
Aggregated Statistics For Year 2008 (Based on 2 partial tracts)
A) FHA, FSA/RHS & VA Home Purchase Loans
B) Conventional Home Purchase Loans
C) Refinancings
D) Home Improvement Loans
G) Loans On Manufactured Home Dwelling (A B C & D)
Number
Average Value
Number
Average Value
Number
Average Value
Number
Average Value
Number
Average Value
LOANS ORIGINATED
1
$93,930
4
$83,480
5
$100,694
5
$12,498
3
$32,503
APPLICATIONS APPROVED, NOT ACCEPTED
0
$0
1
$80,790
1
$65,670
0
$0
1
$68,850
APPLICATIONS DENIED
0
$0
3
$65,140
7
$84,547
3
$15,653
3
$35,687
APPLICATIONS WITHDRAWN
0
$0
0
$0
0
$0
0
$0
0
$0
FILES CLOSED FOR INCOMPLETENESS
0
$0
0
$0
0
$0
0
$0
0
$0
Aggregated Statistics For Year 2007 (Based on 2 partial tracts)
B) Conventional Home Purchase Loans
C) Refinancings
D) Home Improvement Loans
F) Non-occupant Loans on < 5 Family Dwellings (A B C & D)
G) Loans On Manufactured Home Dwelling (A B C & D)
Number
Average Value
Number
Average Value
Number
Average Value
Number
Average Value
Number
Average Value
LOANS ORIGINATED
6
$48,225
7
$103,196
6
$8,425
2
$41,590
6
$26,135
APPLICATIONS APPROVED, NOT ACCEPTED
1
$91,140
4
$109,948
0
$0
0
$0
2
$88,355
APPLICATIONS DENIED
8
$53,680
6
$124,972
4
$49,452
1
$45,770
6
$62,950
APPLICATIONS WITHDRAWN
0
$0
1
$62,090
0
$0
0
$0
0
$0
FILES CLOSED FOR INCOMPLETENESS
0
$0
0
$0
0
$0
0
$0
0
$0
Aggregated Statistics For Year 2006 (Based on 2 partial tracts)
A) FHA, FSA/RHS & VA Home Purchase Loans
B) Conventional Home Purchase Loans
C) Refinancings
D) Home Improvement Loans
F) Non-occupant Loans on < 5 Family Dwellings (A B C & D)
G) Loans On Manufactured Home Dwelling (A B C & D)
Number
Average Value
Number
Average Value
Number
Average Value
Number
Average Value
Number
Average Value
Number
Average Value
LOANS ORIGINATED
2
$98,905
8
$76,864
8
$48,059
7
$25,244
1
$35,820
10
$34,347
APPLICATIONS APPROVED, NOT ACCEPTED
0
$0
2
$41,195
2
$81,590
1
$11,940
0
$0
2
$25,275
APPLICATIONS DENIED
0
$0
4
$76,118
4
$72,835
6
$24,212
0
$0
5
$44,258
APPLICATIONS WITHDRAWN
0
$0
1
$30,250
4
$57,810
0
$0
0
$0
0
$0
FILES CLOSED FOR INCOMPLETENESS
0
$0
0
$0
1
$88,360
0
$0
0
$0
0
$0
Aggregated Statistics For Year 2005 (Based on 2 partial tracts)
A) FHA, FSA/RHS & VA Home Purchase Loans
B) Conventional Home Purchase Loans
C) Refinancings
D) Home Improvement Loans
F) Non-occupant Loans on < 5 Family Dwellings (A B C & D)
G) Loans On Manufactured Home Dwelling (A B C & D)
Number
Average Value
Number
Average Value
Number
Average Value
Number
Average Value
Number
Average Value
Number
Average Value
LOANS ORIGINATED
0
$0
10
$45,452
6
$50,812
7
$6,596
1
$18,710
4
$23,780
APPLICATIONS APPROVED, NOT ACCEPTED
0
$0
3
$67,527
2
$57,310
0
$0
0
$0
2
$51,540
APPLICATIONS DENIED
1
$42,980
4
$93,232
4
$64,078
4
$21,095
0
$0
4
$41,392
APPLICATIONS WITHDRAWN
0
$0
2
$71,840
1
$96,710
0
$0
0
$0
0
$0
FILES CLOSED FOR INCOMPLETENESS
0
$0
0
$0
0
$0
0
$0
0
$0
0
$0
Aggregated Statistics For Year 2004 (Based on 2 partial tracts)
A) FHA, FSA/RHS & VA Home Purchase Loans
B) Conventional Home Purchase Loans
C) Refinancings
D) Home Improvement Loans
F) Non-occupant Loans on < 5 Family Dwellings (A B C & D)
G) Loans On Manufactured Home Dwelling (A B C & D)
Number
Average Value
Number
Average Value
Number
Average Value
Number
Average Value
Number
Average Value
Number
Average Value
LOANS ORIGINATED
1
$83,180
9
$56,339
9
$49,440
6
$23,217
0
$0
7
$32,579
APPLICATIONS APPROVED, NOT ACCEPTED
0
$0
2
$46,965
4
$66,665
0
$0
0
$0
1
$62,090
APPLICATIONS DENIED
0
$0
4
$34,725
7
$68,911
3
$23,350
1
$31,840
4
$50,448
APPLICATIONS WITHDRAWN
0
$0
2
$71,440
3
$83,847
1
$37,810
1
$42,590
0
$0
FILES CLOSED FOR INCOMPLETENESS
0
$0
0
$0
0
$0
0
$0
0
$0
0
$0
Aggregated Statistics For Year 2003 (Based on 2 partial tracts)
A) FHA, FSA/RHS & VA Home Purchase Loans
B) Conventional Home Purchase Loans
C) Refinancings
D) Home Improvement Loans
F) Non-occupant Loans on < 5 Family Dwellings (A B C & D)
Number
Average Value
Number
Average Value
Number
Average Value
Number
Average Value
Number
Average Value
LOANS ORIGINATED
1
$53,330
6
$37,810
7
$51,399
4
$15,920
1
$9,150
APPLICATIONS APPROVED, NOT ACCEPTED
0
$0
5
$46,726
1
$44,180
0
$0
0
$0
APPLICATIONS DENIED
0
$0
7
$36,047
8
$54,228
2
$30,050
1
$56,910
APPLICATIONS WITHDRAWN
0
$0
2
$88,555
2
$69,250
0
$0
0
$0
FILES CLOSED FOR INCOMPLETENESS
0
$0
0
$0
1
$119,400
0
$0
0
$0
Aggregated Statistics For Year 1999 (Based on 1 partial tract)
A) FHA, FSA/RHS & VA Home Purchase Loans
B) Conventional Home Purchase Loans
C) Refinancings
D) Home Improvement Loans
F) Non-occupant Loans on < 5 Family Dwellings (A B C & D)
Detailed PMIC statistics for the following Tracts:0251.00
2002 - 2018 National Fire Incident Reporting System (NFIRS) incidents
Based on the data from the years 2002 - 2018 the average number of fire incidents per year is 15. The highest number of fires - 37 took place in 2011, and the least - 4 in 2007. The data has a dropping trend.
When looking into fire subcategories, the most reports belonged to: Outside Fires (70.7%), and Structure Fires (21.7%).
Fire incident types reported to NFIRS in Zip Code 71069

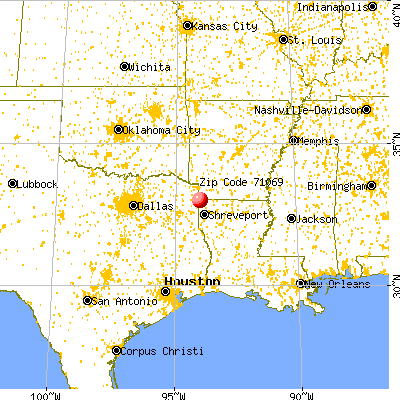


 Nearest zip codes: 75565, 71044, 71043, 71082, 71834, 75555.


 Based on the data from the years 2002 - 2018 the average number of fire incidents per year is 15. The highest number of fires - 37 took place in 2011, and the least - 4 in 2007. The data has a dropping trend.
 When looking into fire subcategories, the most reports belonged to: Outside Fires (70.7%), and Structure Fires (21.7%).