Estimated zip code population in 2022: 1,564 Zip code population in 2010: 1,777 Zip code population in 2000: 2,084
Houses and condos: 726 Renter-occupied apartments: 166
% of renters here:
28%
State:
34%
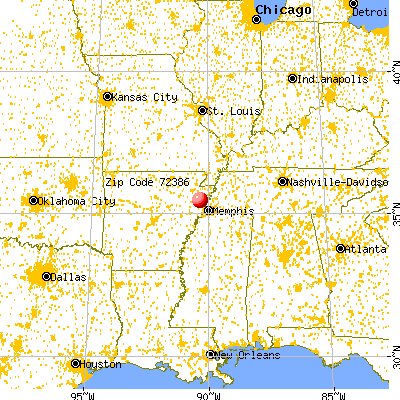
March 2022 cost of living index in zip code 72386: 77.0 (low, U.S. average is 100)
Land area: 117.0 sq. mi. Water area: 0.8 sq. mi.
Population density: 13 people per square mile
(very low).
OSM Map
General Map
Google Map
MSN Map
OSM Map
General Map
Google Map
MSN Map
OSM Map
General Map
Google Map
MSN Map
OSM Map
General Map
Google Map
MSN Map
Please wait while loading the map...
Real estate property taxes paid for housing units in 2022:
This zip code:
0.5% ($392)
Arkansas:
0.5% ($977)
Median real estate property taxes paid for housing units with mortgages in 2022: $432 (0.5%) Median real estate property taxes paid for housing units with no mortgage in 2022: $378 (0.5%)
Estimated median house/condo value in 2022: $83,811
72386:
$83,811
Arkansas:
$179,800
According to our research of Arkansas and other state lists, there were 4 registered sex offenders living in 72386 zip code as of June 15, 2024. The ratio of all residents to sex offenders in zip code 72386 is 464 to 1. The ratio of registered sex offenders to all residents in this zip code is near the state average.
Median resident age:
This zip code:
42.2 years
Arkansas median age:
38.9 years
Average household size:
This zip code:
2.6 people
Arkansas:
2.4 people
Averages for the 2020 tax year for zip code 72386, filed in 2021:
Average Adjusted Gross Income (AGI) in 2020: $53,025 (Individual Income Tax Returns)
Here:
$53,025
State:
$64,872
Salary/wage: $42,134 (reported on 82.8% of returns)
Here:
$42,134
State:
$50,644
(% of AGI for various income ranges: 1128.3% for AGIs below $25k, 3750.0% for AGIs $25k-50k, 7110.0% for AGIs $50k-75k, 11506.7% for AGIs $75k-100k, 18330.0% for AGIs $100k-200k)
Taxable interest for individuals: $1,707 (reported on 21.9% of returns)
This zip code:
$1,707
Arkansas:
$1,857
(% of AGI for various income ranges: 37.2% for AGIs below $25k, 3.3% for AGIs $50k-75k, 13.3% for AGIs $75k-100k, 415.0% for AGIs $100k-200k)
Ordinary dividends: $2,867 (reported on 4.7% of returns)
Here:
$2,867
State:
$21,681
(% of AGI for various income ranges: 286.7% for AGIs $75k-100k)
Net capital gain/loss in AGI: +$567 (reported on 4.7% of returns)
Here:
+$567
State:
+$22,815
(% of AGI for various income ranges: 56.7% for AGIs $75k-100k)
Profit/loss from business: +$6,440 (reported on 15.6% of returns)
Here:
+$6,440
State:
+$9,743
(% of AGI for various income ranges: 37.2% for AGIs below $25k, 271.4% for AGIs $25k-50k, 656.7% for AGIs $75k-100k)
Taxable individual retirement arrangement distribution: $15,125 (reported on 6.2% of returns)
72386:
$15,125
Arkansas:
$18,502
(% of AGI for various income ranges: 1008.3% for AGIs $50k-75k)
Earned income credit: $2,879 (reported on 21.9% of returns)
Here:
$2,879
State:
$2,546
(% of AGI for various income ranges: 133.3% for AGIs below $25k, 116.4% for AGIs $25k-50k)
Percentage of individuals using paid preparers for their 2020 taxes: 96.9%
Here:
97%
State:
94%
(% for various income ranges: 95.8% for AGIs below $25k, 94.4% for AGIs $25k-50k, 100.0% for AGIs $50k-75k, 100.0% for AGIs $75k-100k, 100.0% for AGIs $100k-200k)
Averages for the 2012 tax year for zip code 72386, filed in 2013:
Average Adjusted Gross Income (AGI) in 2012: $43,992 (Individual Income Tax Returns)
Here:
$43,992
State:
$52,148
Salary/wage: $34,512 (reported on 84.8% of returns)
Here:
$34,512
State:
$41,669
(% of AGI for various income ranges: 77.6% for AGIs below $25k, 86.6% for AGIs $25k-50k, 81.3% for AGIs $50k-75k, 67.0% for AGIs $75k-100k, 35.6% for AGIs $100k-200k)
Taxable interest for individuals: $944 (reported on 24.2% of returns)
This zip code:
$944
Arkansas:
$1,648
(% of AGI for various income ranges: 0.3% for AGIs below $25k, 0.5% for AGIs $25k-50k, 0.2% for AGIs $50k-75k, 0.2% for AGIs $75k-100k, 1.0% for AGIs $100k-200k)
Ordinary dividends: $2,567 (reported on 4.5% of returns)
Here:
$2,567
State:
$20,675
Net capital gain/loss in AGI: +$3,600 (reported on 4.5% of returns)
Here:
+$3,600
State:
+$15,222
Profit/loss from business: +$9,889 (reported on 13.6% of returns)
Here:
+$9,889
State:
+$9,665
Taxable individual retirement arrangement distribution: $6,900 (reported on 3.0% of returns)
72386:
$6,900
Arkansas:
$13,644
Total itemized deductions: $20,320 (19% of AGI, reported on 15.2% of returns)
Here:
$20,320
State:
$23,276
Here:
18.8% of AGI
State:
19.1% of AGI
(% of AGI for various income ranges: 4.8% for AGIs $25k-50k, 10.8% for AGIs $50k-75k, 12.2% for AGIs $100k-200k)
Charity contributions: $4,786 (reported on 10.6% of returns)
Here:
$4,786
State:
$5,996
Taxes paid: $7,178 (reported on 13.6% of returns)
72386:
$7,178
State:
$7,941
(% of AGI for various income ranges: 0.7% for AGIs $25k-50k, 2.4% for AGIs $50k-75k, 5.2% for AGIs $100k-200k)
Earned income credit: $2,432 (reported on 28.8% of returns)
Here:
$2,432
State:
$2,455
(% of AGI for various income ranges: 9.7% for AGIs below $25k, 1.8% for AGIs $25k-50k)
Percentage of individuals using paid preparers for their 2012 taxes: 63.6%
Here:
64%
State:
61%
(% for various income ranges: 63.0% for AGIs below $25k, 68.4% for AGIs $25k-50k, 60.0% for AGIs $50k-75k, 60.0% for AGIs $75k-100k, 60.0% for AGIs $100k-200k)
Averages for the 2004 tax year for zip code 72386, filed in 2005:
Average Adjusted Gross Income (AGI) in 2004: $30,678 (Individual Income Tax Returns)
Here:
$30,678
State:
$39,270
Salary/wage: $27,203 (reported on 86.1% of returns)
Here:
$27,203
State:
$34,079
(% of AGI for various income ranges: 85.5% for AGIs below $10k, 80.6% for AGIs $10k-25k, 87.5% for AGIs $25k-50k, 82.3% for AGIs $50k-75k, 74.3% for AGIs $75k-100k, 32.7% for AGIs over 100k)
Taxable interest for individuals: $985 (reported on 26.4% of returns)
This zip code:
$985
Arkansas:
$1,904
(% of AGI for various income ranges: 1.5% for AGIs below $10k, 0.6% for AGIs $10k-25k, 0.6% for AGIs $25k-50k, 0.4% for AGIs $50k-75k, 0.3% for AGIs $75k-100k, 2.8% for AGIs over 100k)
Taxable dividends: $574 (reported on 6.4% of returns)
Here:
$574
State:
$5,995
Net capital gain/loss: +$233 (reported on 4.1% of returns)
Here:
+$233
State:
+$10,430
Profit/loss from business: +$6,122 (reported on 15.6% of returns)
Here:
+$6,122
State:
+$7,823
(% of AGI for various income ranges: 10.2% for AGIs below $10k, 7.4% for AGIs $10k-25k, 1.5% for AGIs $25k-50k, 4.0% for AGIs $50k-75k)
Profit/loss from farming: +$23,565 (reported on 3.1% of returns)
Here:
+$23,565
State:
-$5,941
IRA payment deduction: $3,947 (reported on 2.6% of returns)
72386:
$3,947
Arkansas:
$3,204
Total itemized deductions: $15,677 (23% of AGI, reported on 13.4% of returns)
Here:
$15,677
State:
$18,389
Here:
22.9% of AGI
State:
21.0% of AGI
(% of AGI for various income ranges: 4.2% for AGIs $10k-25k, 7.4% for AGIs $25k-50k, 5.3% for AGIs $50k-75k, 8.8% for AGIs $75k-100k, 12.1% for AGIs over 100k)
Charity contributions deductions: $3,808 (5% of AGI, reported on 10.6% of returns)
Here:
$3,808
State:
$4,725
Here:
5.2% of AGI
State:
5.1% of AGI
(% of AGI for various income ranges: 0.5% for AGIs $10k-25k, 1.1% for AGIs $25k-50k, 1.9% for AGIs $50k-75k, 3.2% for AGIs over 100k)
Total tax: $4,072 (reported on 67.7% of returns)
72386:
$4,072
State:
$6,047
(% of AGI for various income ranges: 3.1% for AGIs below $10k, 4.1% for AGIs $10k-25k, 6.5% for AGIs $25k-50k, 9.8% for AGIs $50k-75k, 12.0% for AGIs $75k-100k, 19.8% for AGIs over 100k)
Earned income credit: $1,799 (reported on 30.3% of returns)
Here:
$1,799
State:
$1,909
Percentage of individuals using paid preparers for their 2004 taxes: 67.9%
Here:
68%
State:
67%
(% for various income ranges: 62.7% for AGIs below $10k, 71.5% for AGIs $10k-25k, 67.9% for AGIs $25k-50k, 65.1% for AGIs $50k-75k, 72.0% for AGIs $75k-100k, 68.4% for AGIs over 100k)
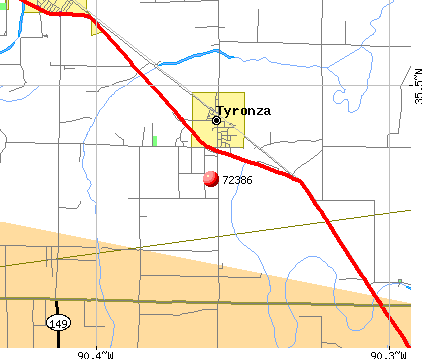
Notable locations in zip code 72386: Macks Baoy (A), Fork (B), Tyronza Volunteer Fire Department (C), Birdsong Rural Volunteer Fire Department (D), Tyronza Police Department (E), Tyronza Fire Department (F). Display/hide their locations on the map
Churches in zip code 72386 include: Whitton Church (A), Barton Chapel (B), Cherry Bean Church (C), Black Oak Baptist Church (D), Liberty Church (E), Mount Olive Church (F), Milam Chapel (G), Mount Zion Church (H), New Bethlehem Church (I). Display/hide their locations on the map
Cemeteries: King Solomon Cemetery (1), Rock of Ages Cemetery (2), New Bethel Cemetery (3), East Tyronza Cemetery (4), Mount Zion Cemetery (5), East Cemetery (6), Dunn Cemetery (7). Display/hide their locations on the map
Lakes and reservoirs: Little Grassy Lake (A), Snake Lake (B), Lost Trap Lake (C), Sky Lake (D), Beautiful Lake (E), Dead Timber Lake (F), Big Lake (G), Tupelo Lake (H). Display/hide their locations on the map
Size of family households: 159 2-persons, 104 3-persons, 115 4-persons, 24 5-persons, 6 7-or-more-persons
Size of nonfamily households: 174 1-person, 2 2-persons
340 married couples with children.
33 single-parent households (11 men, 22 women).
98.9% of residents of 72386 zip code speak English at home.
0.6% of residents speak Spanish at home (100% very well).
Foreign born population: 8 (0.5%) (0.0% of them are naturalized citizens)
:
0.5%
Whole state:
5.1%
88%Honduras
32%English
27%American
10%Irish
6%British
1%Scotch-Irish
1%German
1%Italian
Year of entry for the foreign-born population
02010 or later
02000 to 2009
71990 to 1999
4Before 1990
Facilities with environmental interests located in this zip code:
BIRDSONG WHITTEN WATER ASSOC (261 E 308 DR in TYRONZA, AR)
(Integrated Compliance Information System) - ICIS-06-2000-0572, FORMAL ENFORCEMENT ACTION COMMUNITY WATER SYSTEM (SDWIS) - ICIS-06-2005-1222, ENFORCEMENT/COMPLIANCE ACTIVITY, SDWIS-AR0000417 1, WATER TREATMENT PLANT Business SIC classification: WATER SUPPLY Alternative names: BIRDSONG WHITTEN WATER ASSOCIATION WATER SYS
Housing units lacking complete plumbing facilities: 5.3% Housing units lacking complete kitchen facilities: 7.3%
66.0%Electricity
17.4%Utility gas
16.5%Bottled, tank, or LP gas
Population in 1990: 1,230. Population change in the 1990s: +854 (+69.4%).
Place of birth for U.S.-born residents:
This state: 1,084
Midwest: 65
South: 381
West: 11
61% of the 72386 zip code residents lived in the same house 5 years ago. Out of people who lived in different houses, 52% lived in this county. Out of people who lived in different counties, 50% lived in Arkansas.
90% of the 72386 zip code residents lived in the same house 1 year ago. Out of people who lived in different houses, 67% moved from this county. Out of people who lived in different houses, 22% moved from different county within same state. Out of people who lived in different houses, 2% moved from abroad.
Private vs. public school enrollment:
Students in private schools in grades 1 to 8 (elementary and middle school): 60
Here:
22.8%
Arkansas:
10.5%
Students in private schools in grades 9 to 12 (high school):
Here:
0.0%
Arkansas:
8.7%
Students in private undergraduate colleges:
Here:
0.0%
Arkansas:
19.4%
Occupation by median earnings in the past 12 months ($)
69,219Installation, maintenance, and repair occupations
65,997Production occupations
57,349Health diagnosing and treating practitioners and other technical occupations
48,627Transportation occupations
48,244Management occupations
45,344Office and administrative support occupations
Top industries in this zip code by the number of employees in 2005:
Finance and Insurance: Commercial Banking (10-19 employees: 1 establishment)
Construction: Other Heavy and Civil Engineering Construction (5-9: 1)
Accommodation and Food Services: Full-Service Restaurants (1-4: 2)
Other Services (except Public Administration): Religious Organizations (1-4: 1)
Other Services (except Public Administration): Other Similar Organizations (except Business, Professional, Labor, and Political Organizations) (1-4: 1)
Real Estate and Rental and Leasing: Lessors of Other Real Estate Property (1-4: 1)
Fatal accident statistics in 2013:
Fatal accident count: 1
Vehicles involved in fatal accidents: 1
Fatal accidents caused by drunken drivers: 0
Fatalities: 1
Persons involved in fatal accidents: 1
Pedestrians involved in fatal accidents: 0
Fatal accident statistics in 2012:
Fatal accident count: 1
Vehicles involved in fatal accidents: 1
Fatal accidents caused by drunken drivers: 0
Fatalities: 1
Persons involved in fatal accidents: 2
Pedestrians involved in fatal accidents: 0
Home Mortgage Disclosure Act Aggregated Statistics For Year 2009 (Based on 2 partial tracts)
A) FHA, FSA/RHS & VA Home Purchase Loans
B) Conventional Home Purchase Loans
C) Refinancings
D) Home Improvement Loans
F) Non-occupant Loans on < 5 Family Dwellings (A B C & D)
G) Loans On Manufactured Home Dwelling (A B C & D)
Number
Average Value
Number
Average Value
Number
Average Value
Number
Average Value
Number
Average Value
Number
Average Value
LOANS ORIGINATED
32
$139,887
8
$120,721
18
$115,571
3
$30,543
2
$108,680
1
$10,230
APPLICATIONS APPROVED, NOT ACCEPTED
0
$0
0
$0
4
$153,220
0
$0
0
$0
1
$23,870
APPLICATIONS DENIED
3
$84,673
2
$46,880
14
$137,724
2
$9,165
1
$31,960
1
$37,510
APPLICATIONS WITHDRAWN
2
$144,055
1
$87,370
8
$131,216
0
$0
0
$0
0
$0
FILES CLOSED FOR INCOMPLETENESS
1
$137,660
0
$0
0
$0
0
$0
0
$0
0
$0
Aggregated Statistics For Year 2008 (Based on 2 partial tracts)
A) FHA, FSA/RHS & VA Home Purchase Loans
B) Conventional Home Purchase Loans
C) Refinancings
D) Home Improvement Loans
F) Non-occupant Loans on < 5 Family Dwellings (A B C & D)
G) Loans On Manufactured Home Dwelling (A B C & D)
Number
Average Value
Number
Average Value
Number
Average Value
Number
Average Value
Number
Average Value
Number
Average Value
LOANS ORIGINATED
20
$138,664
12
$129,032
13
$127,663
6
$60,592
3
$82,683
2
$54,980
APPLICATIONS APPROVED, NOT ACCEPTED
0
$0
0
$0
1
$159,400
0
$0
0
$0
0
$0
APPLICATIONS DENIED
2
$191,575
5
$56,514
13
$147,826
3
$41,483
2
$79,910
3
$41,057
APPLICATIONS WITHDRAWN
0
$0
0
$0
6
$137,663
0
$0
0
$0
0
$0
FILES CLOSED FOR INCOMPLETENESS
1
$112,090
1
$99,300
1
$108,250
0
$0
0
$0
0
$0
Aggregated Statistics For Year 2007 (Based on 2 partial tracts)
A) FHA, FSA/RHS & VA Home Purchase Loans
B) Conventional Home Purchase Loans
C) Refinancings
D) Home Improvement Loans
F) Non-occupant Loans on < 5 Family Dwellings (A B C & D)
G) Loans On Manufactured Home Dwelling (A B C & D)
Number
Average Value
Number
Average Value
Number
Average Value
Number
Average Value
Number
Average Value
Number
Average Value
LOANS ORIGINATED
12
$133,578
43
$108,314
16
$109,028
3
$24,437
18
$101,293
3
$35,090
APPLICATIONS APPROVED, NOT ACCEPTED
0
$0
3
$122,177
3
$62,510
0
$0
0
$0
1
$52,420
APPLICATIONS DENIED
1
$97,600
6
$93,480
8
$127,061
6
$21,310
0
$0
3
$63,220
APPLICATIONS WITHDRAWN
0
$0
3
$65,920
1
$130,840
0
$0
2
$47,310
0
$0
FILES CLOSED FOR INCOMPLETENESS
0
$0
0
$0
2
$114,860
0
$0
0
$0
0
$0
Aggregated Statistics For Year 2006 (Based on 2 partial tracts)
A) FHA, FSA/RHS & VA Home Purchase Loans
B) Conventional Home Purchase Loans
C) Refinancings
D) Home Improvement Loans
F) Non-occupant Loans on < 5 Family Dwellings (A B C & D)
G) Loans On Manufactured Home Dwelling (A B C & D)
Number
Average Value
Number
Average Value
Number
Average Value
Number
Average Value
Number
Average Value
Number
Average Value
LOANS ORIGINATED
14
$114,161
26
$109,714
19
$100,695
5
$44,496
5
$81,404
3
$36,653
APPLICATIONS APPROVED, NOT ACCEPTED
0
$0
2
$58,600
2
$62,440
0
$0
0
$0
0
$0
APPLICATIONS DENIED
1
$134,250
3
$265,523
12
$117,241
6
$11,863
0
$0
0
$0
APPLICATIONS WITHDRAWN
1
$131,270
4
$131,695
10
$97,301
0
$0
0
$0
0
$0
FILES CLOSED FOR INCOMPLETENESS
1
$93,340
1
$125,730
4
$152,048
0
$0
0
$0
0
$0
Aggregated Statistics For Year 2005 (Based on 2 partial tracts)
A) FHA, FSA/RHS & VA Home Purchase Loans
B) Conventional Home Purchase Loans
C) Refinancings
D) Home Improvement Loans
F) Non-occupant Loans on < 5 Family Dwellings (A B C & D)
G) Loans On Manufactured Home Dwelling (A B C & D)
Number
Average Value
Number
Average Value
Number
Average Value
Number
Average Value
Number
Average Value
Number
Average Value
LOANS ORIGINATED
13
$122,188
26
$100,010
22
$100,215
2
$10,655
3
$74,727
2
$29,620
APPLICATIONS APPROVED, NOT ACCEPTED
0
$0
0
$0
5
$101,862
0
$0
0
$0
1
$49,440
APPLICATIONS DENIED
2
$106,335
12
$64,250
14
$97,721
3
$15,487
1
$59,240
7
$36,897
APPLICATIONS WITHDRAWN
1
$92,910
2
$109,105
7
$100,644
1
$385,710
0
$0
0
$0
FILES CLOSED FOR INCOMPLETENESS
0
$0
1
$79,270
2
$121,895
0
$0
0
$0
0
$0
Aggregated Statistics For Year 2004 (Based on 2 partial tracts)
A) FHA, FSA/RHS & VA Home Purchase Loans
B) Conventional Home Purchase Loans
C) Refinancings
D) Home Improvement Loans
F) Non-occupant Loans on < 5 Family Dwellings (A B C & D)
G) Loans On Manufactured Home Dwelling (A B C & D)
Number
Average Value
Number
Average Value
Number
Average Value
Number
Average Value
Number
Average Value
Number
Average Value
LOANS ORIGINATED
14
$118,423
19
$98,901
20
$95,938
2
$41,340
2
$78,845
3
$47,877
APPLICATIONS APPROVED, NOT ACCEPTED
0
$0
3
$73,873
7
$88,041
0
$0
0
$0
2
$23,865
APPLICATIONS DENIED
2
$140,005
9
$74,490
12
$94,119
3
$20,743
1
$64,360
3
$44,610
APPLICATIONS WITHDRAWN
0
$0
1
$136,810
6
$114,222
0
$0
0
$0
0
$0
FILES CLOSED FOR INCOMPLETENESS
0
$0
1
$75,010
9
$107,356
0
$0
1
$61,370
0
$0
Aggregated Statistics For Year 2003 (Based on 2 partial tracts)
A) FHA, FSA/RHS & VA Home Purchase Loans
B) Conventional Home Purchase Loans
C) Refinancings
D) Home Improvement Loans
F) Non-occupant Loans on < 5 Family Dwellings (A B C & D)
Number
Average Value
Number
Average Value
Number
Average Value
Number
Average Value
Number
Average Value
LOANS ORIGINATED
22
$109,688
19
$97,712
35
$91,633
2
$27,915
1
$83,540
APPLICATIONS APPROVED, NOT ACCEPTED
0
$0
1
$63,930
5
$83,706
1
$26,420
0
$0
APPLICATIONS DENIED
1
$58,390
8
$60,201
17
$71,125
1
$5,540
0
$0
APPLICATIONS WITHDRAWN
2
$100,155
5
$81,746
7
$82,926
0
$0
1
$31,960
FILES CLOSED FOR INCOMPLETENESS
0
$0
0
$0
3
$82,257
0
$0
0
$0
Aggregated Statistics For Year 2002 (Based on 2 partial tracts)
A) FHA, FSA/RHS & VA Home Purchase Loans
B) Conventional Home Purchase Loans
C) Refinancings
D) Home Improvement Loans
F) Non-occupant Loans on < 5 Family Dwellings (A B C & D)
Number
Average Value
Number
Average Value
Number
Average Value
Number
Average Value
Number
Average Value
LOANS ORIGINATED
9
$96,700
10
$93,466
20
$92,422
2
$6,180
2
$33,245
APPLICATIONS APPROVED, NOT ACCEPTED
0
$0
2
$40,700
9
$72,028
0
$0
2
$55,830
APPLICATIONS DENIED
2
$93,125
8
$61,692
10
$72,667
2
$11,935
1
$81,400
APPLICATIONS WITHDRAWN
1
$98,450
1
$140,220
4
$86,518
0
$0
0
$0
FILES CLOSED FOR INCOMPLETENESS
0
$0
1
$59,240
1
$64,780
0
$0
0
$0
Aggregated Statistics For Year 2001 (Based on 2 partial tracts)
A) FHA, FSA/RHS & VA Home Purchase Loans
B) Conventional Home Purchase Loans
C) Refinancings
D) Home Improvement Loans
F) Non-occupant Loans on < 5 Family Dwellings (A B C & D)
Number
Average Value
Number
Average Value
Number
Average Value
Number
Average Value
Number
Average Value
LOANS ORIGINATED
13
$107,894
9
$64,877
17
$84,638
3
$11,933
3
$53,843
APPLICATIONS APPROVED, NOT ACCEPTED
0
$0
3
$62,650
1
$52,420
0
$0
0
$0
APPLICATIONS DENIED
1
$82,680
4
$49,972
8
$74,798
3
$20,030
0
$0
APPLICATIONS WITHDRAWN
0
$0
1
$40,490
9
$70,133
0
$0
0
$0
FILES CLOSED FOR INCOMPLETENESS
0
$0
0
$0
0
$0
0
$0
0
$0
Aggregated Statistics For Year 2000 (Based on 2 partial tracts)
A) FHA, FSA/RHS & VA Home Purchase Loans
B) Conventional Home Purchase Loans
C) Refinancings
D) Home Improvement Loans
F) Non-occupant Loans on < 5 Family Dwellings (A B C & D)
Number
Average Value
Number
Average Value
Number
Average Value
Number
Average Value
Number
Average Value
LOANS ORIGINATED
8
$94,510
16
$57,058
8
$67,126
5
$5,882
1
$51,570
APPLICATIONS APPROVED, NOT ACCEPTED
0
$0
3
$41,200
3
$33,527
1
$22,590
0
$0
APPLICATIONS DENIED
0
$0
7
$34,949
15
$46,797
6
$8,312
0
$0
APPLICATIONS WITHDRAWN
0
$0
1
$85,670
8
$79,166
1
$22,590
0
$0
FILES CLOSED FOR INCOMPLETENESS
0
$0
0
$0
1
$49,440
0
$0
0
$0
Aggregated Statistics For Year 1999 (Based on 1 partial tract)
A) FHA, FSA/RHS & VA Home Purchase Loans
B) Conventional Home Purchase Loans
C) Refinancings
D) Home Improvement Loans
F) Non-occupant Loans on < 5 Family Dwellings (A B C & D)
Detailed PMIC statistics for the following Tracts:0307.00
2003 - 2018 National Fire Incident Reporting System (NFIRS) incidents
According to the data from the years 2003 - 2018 the average number of fire incidents per year is 15. The highest number of reported fire incidents - 26 took place in 2011, and the least - 0 in 2005. The data has a growing trend.
When looking into fire subcategories, the most incidents belonged to: Outside Fires (47.1%), and Structure Fires (23.1%).
Fire incident types reported to NFIRS in Zip Code 72386


+$23,565
-$5,941
 Nearest zip codes: 72339, 72365, 72384, 72354, 72325, 72331.


 According to the data from the years 2003 - 2018 the average number of fire incidents per year is 15. The highest number of reported fire incidents - 26 took place in 2011, and the least - 0 in 2005. The data has a growing trend.
 When looking into fire subcategories, the most incidents belonged to: Outside Fires (47.1%), and Structure Fires (23.1%).