Estimated zip code population in 2022: 3,164 Zip code population in 2010: 2,294 Zip code population in 2000: 2,352
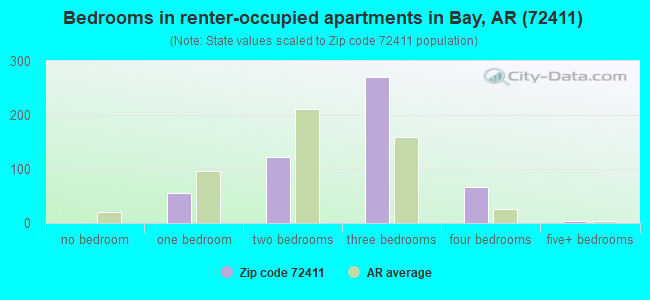
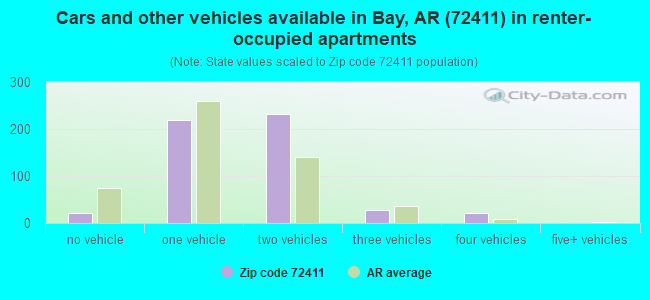
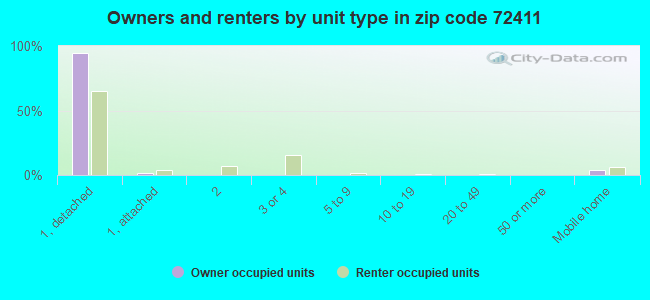
Houses and condos: 1,216 Renter-occupied apartments: 531
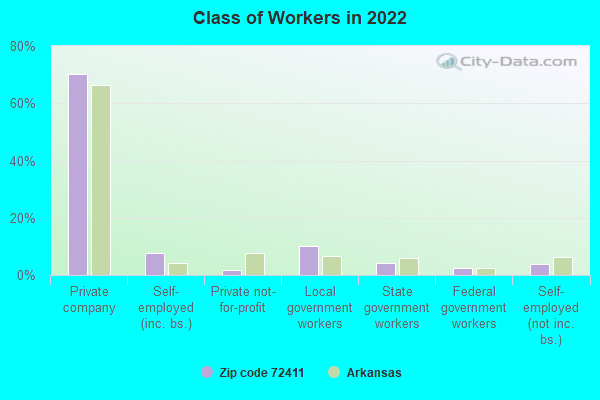
% of renters here:
47%
State:
34%
March 2022 cost of living index in zip code 72411: 78.8 (low, U.S. average is 100)
Land area: 38.4 sq. mi. Water area: 0.1 sq. mi.
Population density: 82 people per square mile
(very low).
OSM Map
General Map
Google Map
MSN Map
OSM Map
General Map
Google Map
MSN Map
OSM Map
General Map
Google Map
MSN Map
OSM Map
General Map
Google Map
MSN Map
Please wait while loading the map...
Real estate property taxes paid for housing units in 2022:
This zip code:
0.6% ($564)
Arkansas:
0.5% ($977)
Median real estate property taxes paid for housing units with mortgages in 2022: $697 (0.6%) Median real estate property taxes paid for housing units with no mortgage in 2022: $426 (0.5%)
Business Search- 14 Million verified businesses
Males: 1,576
(49.8%)
Females: 1,587
(50.2%)
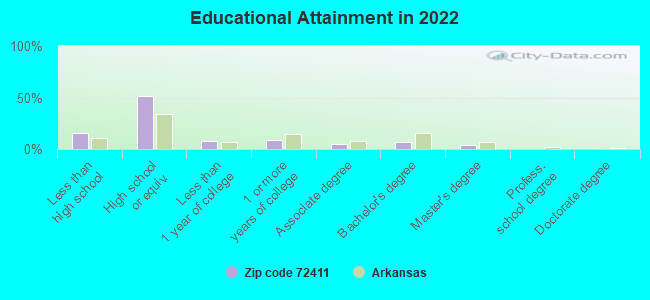
For population 25 years and over in 72411:
High school or higher: 83.6%
Bachelor's degree or higher: 11.0%
Graduate or professional degree: 4.1%
Unemployed: 3.9%
Mean travel time to work (commute): 17.2 minutes
For population 15 years and over in 72411:
Never married: 19.5%
Now married: 58.2%
Separated: 2.8%
Widowed: 5.9%
Divorced: 13.6%
Zip code 72411 compared to state average:
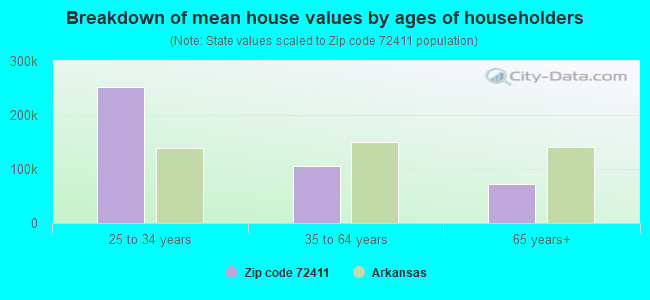
Median house value below state average.
Black race population percentage significantly below state average.
Median age below state average.
Foreign-born population percentage below state average.
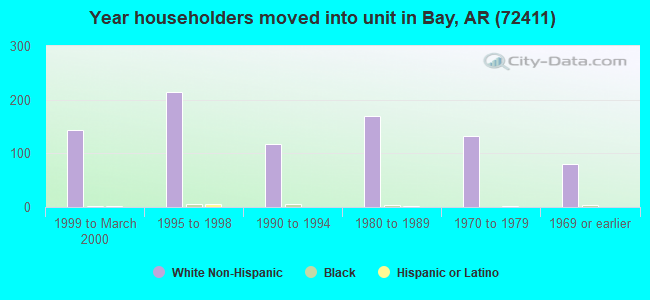
Length of stay since moving in significantly below state average.
Number of college students below state average.
Percentage of population with a bachelor's degree or higher significantly below state average.
Averages for the 2020 tax year for zip code 72411, filed in 2021:
Average Adjusted Gross Income (AGI) in 2020: $46,599 (Individual Income Tax Returns)
Here:
$46,599
State:
$64,872
Salary/wage: $40,626 (reported on 85.6% of returns)
Here:
$40,626
State:
$50,644
(% of AGI for various income ranges: 1168.9% for AGIs below $25k, 3587.0% for AGIs $25k-50k, 6625.8% for AGIs $50k-75k, 11690.0% for AGIs $75k-100k, 17890.0% for AGIs $100k-200k)
Taxable interest for individuals: $531 (reported on 17.8% of returns)
This zip code:
$531
Arkansas:
$1,857
(% of AGI for various income ranges: 3.3% for AGIs below $25k, 5.5% for AGIs $25k-50k, 3.3% for AGIs $50k-75k, 94.0% for AGIs $75k-100k, 35.0% for AGIs $100k-200k)
Ordinary dividends: $767 (reported on 3.3% of returns)
Here:
$767
State:
$21,681
(% of AGI for various income ranges: 19.2% for AGIs $50k-75k)
Net capital gain/loss in AGI: +$7,675 (reported on 4.4% of returns)
Here:
+$7,675
State:
+$22,815
(% of AGI for various income ranges: 255.8% for AGIs $50k-75k)
Profit/loss from business: +$4,600 (reported on 15.6% of returns)
Here:
+$4,600
State:
+$9,743
(% of AGI for various income ranges: 110.7% for AGIs below $25k, 123.5% for AGIs $25k-50k, 196.0% for AGIs $75k-100k)
Taxable individual retirement arrangement distribution: $8,825 (reported on 4.4% of returns)
72411:
$8,825
Arkansas:
$18,502
(% of AGI for various income ranges: 55.9% for AGIs below $25k, 168.3% for AGIs $50k-75k)
Earned income credit: $2,646 (reported on 26.7% of returns)
Here:
$2,646
State:
$2,546
(% of AGI for various income ranges: 156.7% for AGIs below $25k, 106.0% for AGIs $25k-50k)
Percentage of individuals using paid preparers for their 2020 taxes: 94.4%
Here:
94%
State:
94%
(% for various income ranges: 94.3% for AGIs below $25k, 95.8% for AGIs $25k-50k, 93.8% for AGIs $50k-75k, 87.5% for AGIs $75k-100k, 100.0% for AGIs $100k-200k)
Averages for the 2012 tax year for zip code 72411, filed in 2013:
Average Adjusted Gross Income (AGI) in 2012: $36,002 (Individual Income Tax Returns)
Here:
$36,002
State:
$52,148
Salary/wage: $31,171 (reported on 88.5% of returns)
Here:
$31,171
State:
$41,669
(% of AGI for various income ranges: 77.7% for AGIs below $25k, 85.2% for AGIs $25k-50k, 81.1% for AGIs $50k-75k, 79.9% for AGIs $75k-100k, 51.3% for AGIs $100k-200k)
Taxable interest for individuals: $494 (reported on 18.8% of returns)
This zip code:
$494
Arkansas:
$1,648
(% of AGI for various income ranges: 0.2% for AGIs below $25k, 0.2% for AGIs $25k-50k, 0.4% for AGIs $50k-75k, 0.4% for AGIs $75k-100k)
Ordinary dividends: $150 (reported on 4.2% of returns)
Here:
$150
State:
$20,675
Net capital gain/loss in AGI: +$4,033 (reported on 3.1% of returns)
Here:
+$4,033
State:
+$15,222
Profit/loss from business: +$8,843 (reported on 14.6% of returns)
Here:
+$8,843
State:
+$9,665
(% of AGI for various income ranges: 8.8% for AGIs below $25k, 2.7% for AGIs $25k-50k, 5.6% for AGIs $50k-75k)
Taxable individual retirement arrangement distribution: $7,743 (reported on 7.3% of returns)
72411:
$7,743
Arkansas:
$13,644
Total itemized deductions: $15,627 (21% of AGI, reported on 11.5% of returns)
Here:
$15,627
State:
$23,276
Here:
20.7% of AGI
State:
19.1% of AGI
(% of AGI for various income ranges: 4.3% for AGIs $25k-50k, 9.1% for AGIs $50k-75k, 9.4% for AGIs $100k-200k)
Charity contributions: $4,714 (reported on 7.3% of returns)
Here:
$4,714
State:
$5,996
Taxes paid: $4,609 (reported on 11.5% of returns)
72411:
$4,609
State:
$7,941
(% of AGI for various income ranges: 0.9% for AGIs $25k-50k, 2.5% for AGIs $50k-75k, 3.7% for AGIs $100k-200k)
Earned income credit: $2,345 (reported on 30.2% of returns)
Here:
$2,345
State:
$2,455
(% of AGI for various income ranges: 9.1% for AGIs below $25k, 1.5% for AGIs $25k-50k)
Percentage of individuals using paid preparers for their 2012 taxes: 65.6%
Here:
66%
State:
61%
(% for various income ranges: 62.2% for AGIs below $25k, 65.5% for AGIs $25k-50k, 69.2% for AGIs $50k-75k, 80.0% for AGIs $75k-100k, 75.0% for AGIs $100k-200k)
Averages for the 2004 tax year for zip code 72411, filed in 2005:
Average Adjusted Gross Income (AGI) in 2004: $28,423 (Individual Income Tax Returns)
Here:
$28,423
State:
$39,270
Salary/wage: $26,609 (reported on 90.2% of returns)
Here:
$26,609
State:
$34,079
(% of AGI for various income ranges: 95.3% for AGIs below $10k, 82.8% for AGIs $10k-25k, 87.3% for AGIs $25k-50k, 89.7% for AGIs $50k-75k, 74.8% for AGIs $75k-100k, 55.6% for AGIs over 100k)
Taxable interest for individuals: $636 (reported on 26.9% of returns)
This zip code:
$636
Arkansas:
$1,904
(% of AGI for various income ranges: 1.6% for AGIs below $10k, 0.9% for AGIs $10k-25k, 0.6% for AGIs $25k-50k, 0.4% for AGIs $50k-75k, 0.6% for AGIs $75k-100k, 0.4% for AGIs over 100k)
Taxable dividends: $207 (reported on 6.2% of returns)
Here:
$207
State:
$5,995
Profit/loss from business: +$3,986 (reported on 14.9% of returns)
Here:
+$3,986
State:
+$7,823
(% of AGI for various income ranges: 9.6% for AGIs below $10k, 3.4% for AGIs $10k-25k, 2.3% for AGIs $25k-50k, 0.9% for AGIs $50k-75k)
Profit/loss from farming: +$6,500 (reported on 1.3% of returns)
Here:
+$6,500
State:
-$5,941
IRA payment deduction: $2,680 (reported on 2.7% of returns)
72411:
$2,680
Arkansas:
$3,204
Total itemized deductions: $13,831 (22% of AGI, reported on 9.6% of returns)
Here:
$13,831
State:
$18,389
Here:
22.2% of AGI
State:
21.0% of AGI
(% of AGI for various income ranges: 4.1% for AGIs $25k-50k, 6.7% for AGIs $50k-75k, 8.1% for AGIs $75k-100k, 11.3% for AGIs over 100k)
Charity contributions deductions: $3,478 (6% of AGI, reported on 7.4% of returns)
Here:
$3,478
State:
$4,725
Here:
5.5% of AGI
State:
5.1% of AGI
Total tax: $2,946 (reported on 65.8% of returns)
72411:
$2,946
State:
$6,047
(% of AGI for various income ranges: 2.7% for AGIs below $10k, 2.8% for AGIs $10k-25k, 5.9% for AGIs $25k-50k, 8.0% for AGIs $50k-75k, 10.8% for AGIs $75k-100k, 15.9% for AGIs over 100k)
Earned income credit: $1,931 (reported on 28.1% of returns)
Here:
$1,931
State:
$1,909
Percentage of individuals using paid preparers for their 2004 taxes: 70.6%
Here:
71%
State:
67%
(% for various income ranges: 58.9% for AGIs below $10k, 74.8% for AGIs $10k-25k, 74.6% for AGIs $25k-50k, 71.3% for AGIs $50k-75k, 73.1% for AGIs $75k-100k, 78.6% for AGIs over 100k)
Household received Food Stamps/SNAP in the past 12 months: 131 Household did not receive Food Stamps/SNAP in the past 12 months: 996
Women who had a birth in the past 12 months: 74 (67 now married, 8 unmarried) Women who did not have a birth in the past 12 months: 549 (273 now married, 275 unmarried)
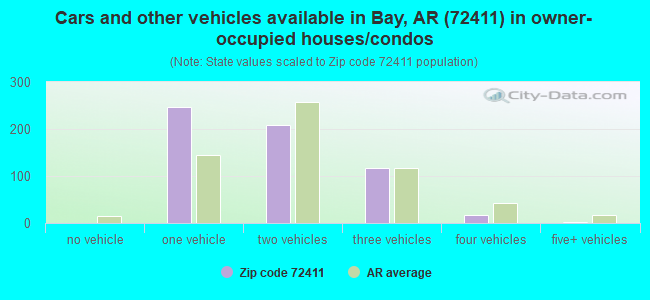
Housing units in zip code 72411 with a mortgage: 234 (4 second mortgage, 3 both second mortgage and home equity loan) Median monthly owner costs for units with a mortgage: $1,083 Median monthly owner costs for units without a mortgage: $351
Residents with income below the poverty level in 2022:
This zip code:
21.8%
Whole state:
16.8%
Residents with income below 50% of the poverty level in 2022:
This zip code:
17.1%
Whole state:
8.5%
Median number of rooms in houses and condos:
Here:
5.8
State:
6.1
Median number of rooms in apartments:
Here:
5.1
State:
4.3
Notable locations in this zip code not listed on our city pages
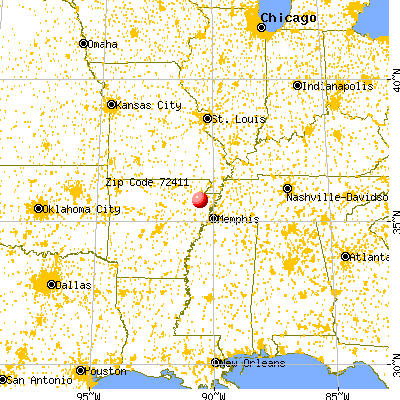
Notable locations in zip code 72411: Herman (A), Bay Fire Department Station 1 (B), Bay Fire Department Station 2 (C), Bay Police Department (D). Display/hide their locations on the map
Size of family households: 371 2-persons, 180 3-persons, 186 4-persons, 61 5-persons, 62 6-persons, 37 7-or-more-persons
Size of nonfamily households: 216 1-person, 4 2-persons, 3 4-persons
633 married couples with children.
228 single-parent households (87 men, 141 women).
92.7% of residents of 72411 zip code speak English at home.
7.0% of residents speak Spanish at home (81% very well, 19% well).
0.2% of residents speak other Indo-European language at home (100% very well).
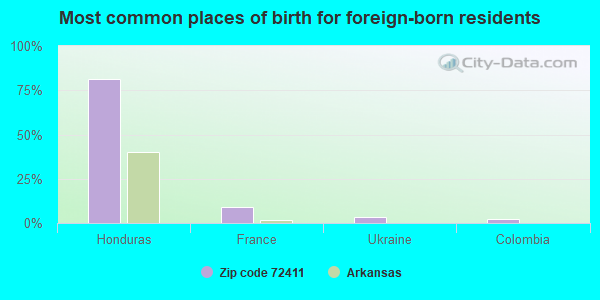
Foreign born population: 88 (2.8%) (87.4% of them are naturalized citizens)
This zip code:
2.8%
Whole state:
5.1%
81%Honduras
9%France
3%Ukraine
2%Colombia
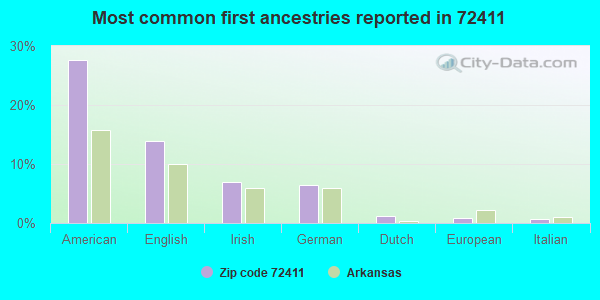
28%American
14%English
7%Irish
7%German
1%Dutch
1%European
1%Italian
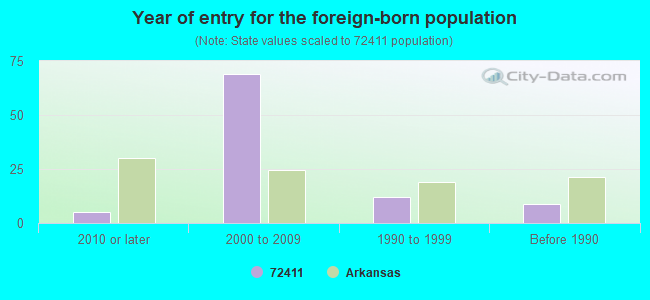
Year of entry for the foreign-born population
52010 or later
692000 to 2009
121990 to 1999
9Before 1990
Facilities with environmental interests located in this zip code:
BAY, CITY OF-PWTP (224 ELDER ST in BAY, AR)
National Pollutant Discharge Elimination System NON-MAJOR (Tracking pollutant discharge elimination systems) - permit COMMUNITY WATER SYSTEM (SDWIS) - SDWIS-AR0000129 1, WATER TREATMENT PLANT Business SIC classification: WATER SUPPLY Alternative names: BAY WATERWORKS
BAY ELEMENTARY SCHOOL (700 SCHOOL STREET in BAY, AR)
(Geographic Names Information System) (National Center for Education Statistics) - STATE ID-1601001
BAY HIGH SCHOOL (700 SCHOOL STREET in BAY, AR)
(Geographic Names Information System) (National Center for Education Statistics) - STATE ID-1601002
AMERICAN TEL & TEL CO LONG LINES (RURAL ROUTE 5 in BAY, AR)
(Resource Conservation and Recovery Act (tracking hazardous waste))
BAY, CITY OF (1.25MI S OF DORTON ST & HWY 63 in BAY, AR)
National Pollutant Discharge Elimination System NON-MAJOR (Tracking pollutant discharge elimination systems) - permit Business SIC classification: SEWERAGE SYSTEMS
BAY GIN & MERCANTILE CO. (221 SMOKEY RD. in BAY, AR, AR)
AIR SYNTHETIC MINOR (AIRS/AFS) Business SIC classification: COTTON GINNING
Housing units lacking complete plumbing facilities: 0.8% Housing units lacking complete kitchen facilities: 3.5%
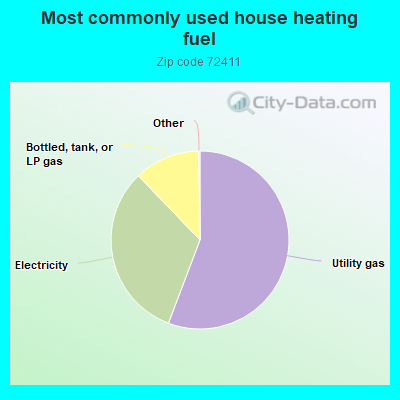
55.9%Utility gas
32.1%Electricity
12.0%Bottled, tank, or LP gas
Population in 1990: 2,527.
Place of birth for U.S.-born residents:
This state: 2,369
Midwest: 227
South: 374
West: 70
60% of the 72411 zip code residents lived in the same house 5 years ago. Out of people who lived in different houses, 67% lived in this county. Out of people who lived in different counties, 50% lived in Arkansas.
85% of the 72411 zip code residents lived in the same house 1 year ago. Out of people who lived in different houses, 40% moved from this county. Out of people who lived in different houses, 46% moved from different county within same state. Out of people who lived in different houses, 12% moved from different state.
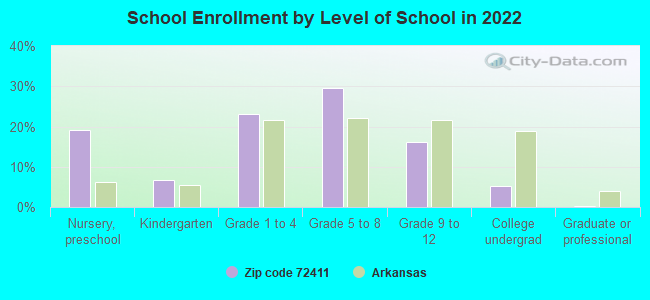
Private vs. public school enrollment:
Students in private schools in grades 1 to 8 (elementary and middle school): 127
Here:
30.5%
Arkansas:
10.5%
Students in private schools in grades 9 to 12 (high school): 18
Here:
15.1%
Arkansas:
8.7%
Students in private undergraduate colleges:
Here:
0.0%
Arkansas:
19.4%
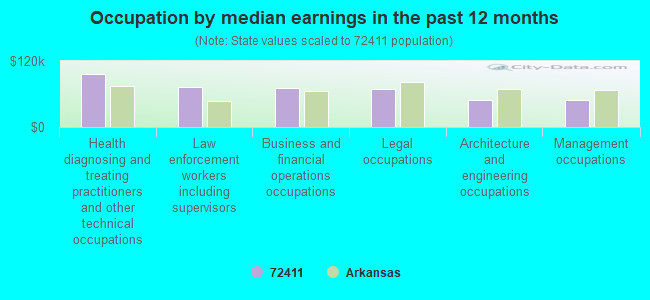
Occupation by median earnings in the past 12 months ($)
96,891Health diagnosing and treating practitioners and other technical occupations
72,667Law enforcement workers including supervisors
70,460Business and financial operations occupations
69,245Legal occupations
49,056Architecture and engineering occupations
48,802Management occupations
Companies with federal contracts located in this zip code:
TAYLOR, W E & IRIS (500 BLALOCK ST in BAY, AR; small business) : $66,640 in 16 contractsfrom 2002 to 2006
Contracts for Operation of Government-Owned Facilities -- Recreation Facilities (Non-Building) by U.S. Army Corps of Engineers - civil program financing only, Army Signed by year:2000: $0; 2001: $0; 2002: $1,430; 2003: $13,130; 2004: $11,920; 2005: $20,440; 2006: $19,720.
Biggest contracts:
$10,075 with U.S. Army Corps of Engineers - civil program financing only for Operation of Government-Owned Facilities -- Recreation Facilities (Non-Building). Signed on 2003-03-20. Completion date: 2002-11-01.
$9,860 with Army for Operation of Government-Owned Facilities -- Recreation Facilities (Non-Building). Signed on 2006-02-13. Completion date: 2005-11-01.
$9,860, same as above.Signed on 2006-02-17. Completion date: 2005-11-01.
$9,380 with U.S. Army Corps of Engineers - civil program financing only for Operation of Government-Owned Facilities -- Recreation Facilities (Non-Building). Signed on 2005-02-01. Completion date: 2005-11-01.
Top industries in this zip code by the number of employees in 2005:
Construction: Commercial and Institutional Building Construction (10-19: 1)
Construction: Electrical Contractors (10-19: 1)
Administrative and Support and Waste Management and Remediation Services: Solid Waste Collection (5-9: 1)
Health Care and Social Assistance: Child Day Care Services (5-9: 1)
Administrative and Support and Waste Management and Remediation Services: Exterminating and Pest Control Services (1-4: 2)
Other Services (except Public Administration): Commercial and Industrial Machinery and Equipment (except Automotive and Electronic) Repair and Maintenance (1-4: 1)
Finance and Insurance: Direct Property and Casualty Insurance Carriers (1-4: 1)
Fatal accident statistics in 2014:
Fatal accident count: 1
Vehicles involved in fatal accidents: 2
Fatal accidents caused by drunken drivers: 0
Fatalities: 1
Persons involved in fatal accidents: 6
Pedestrians involved in fatal accidents: 0
Fatal accident statistics in 2011:
Fatal accident count: 2
Vehicles involved in fatal accidents: 3
Fatal accidents caused by drunken drivers: 1
Fatalities: 2
Persons involved in fatal accidents: 4
Pedestrians involved in fatal accidents: 0
Home Mortgage Disclosure Act Aggregated Statistics For Year 2009 (Based on 4 partial tracts)
A) FHA, FSA/RHS & VA Home Purchase Loans
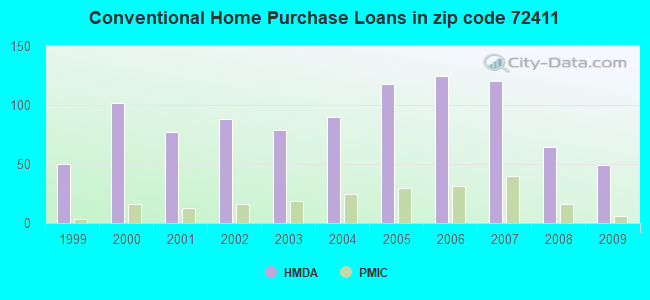
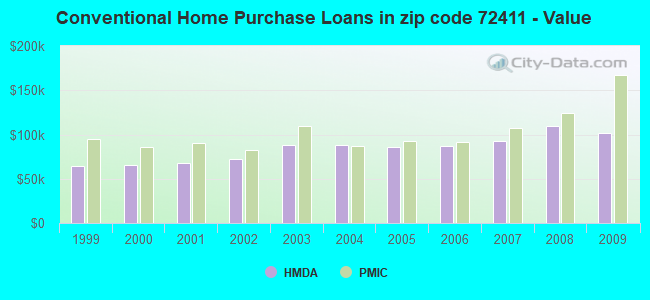
B) Conventional Home Purchase Loans
C) Refinancings
D) Home Improvement Loans
E) Loans on Dwellings For 5+ Families
F) Non-occupant Loans on < 5 Family Dwellings (A B C & D)
G) Loans On Manufactured Home Dwelling (A B C & D)
Number
Average Value
Number
Average Value
Number
Average Value
Number
Average Value
Number
Average Value
Number
Average Value
Number
Average Value
LOANS ORIGINATED
66
$114,445
49
$102,160
123
$110,259
14
$15,017
2
$336,440
42
$96,564
3
$35,043
APPLICATIONS APPROVED, NOT ACCEPTED
2
$94,500
1
$51,830
7
$79,804
1
$36,540
0
$0
0
$0
1
$33,510
APPLICATIONS DENIED
6
$112,847
8
$70,814
33
$85,020
9
$16,761
0
$0
3
$54,047
6
$39,273
APPLICATIONS WITHDRAWN
6
$81,203
4
$80,945
32
$98,370
0
$0
0
$0
1
$97,850
0
$0
FILES CLOSED FOR INCOMPLETENESS
1
$89,710
1
$132,070
5
$123,902
0
$0
0
$0
0
$0
0
$0
Aggregated Statistics For Year 2008 (Based on 4 partial tracts)
A) FHA, FSA/RHS & VA Home Purchase Loans
B) Conventional Home Purchase Loans
C) Refinancings
D) Home Improvement Loans
E) Loans on Dwellings For 5+ Families
F) Non-occupant Loans on < 5 Family Dwellings (A B C & D)
G) Loans On Manufactured Home Dwelling (A B C & D)
Number
Average Value
Number
Average Value
Number
Average Value
Number
Average Value
Number
Average Value
Number
Average Value
Number
Average Value
LOANS ORIGINATED
59
$97,633
64
$110,006
106
$102,833
18
$30,823
2
$997,260
56
$89,338
7
$29,651
APPLICATIONS APPROVED, NOT ACCEPTED
0
$0
4
$101,840
7
$76,443
2
$29,710
0
$0
2
$81,200
3
$42,703
APPLICATIONS DENIED
11
$91,065
19
$66,815
43
$88,680
23
$14,862
0
$0
6
$38,292
8
$33,342
APPLICATIONS WITHDRAWN
4
$130,155
10
$78,676
21
$103,631
1
$24,360
0
$0
4
$38,930
1
$7,610
FILES CLOSED FOR INCOMPLETENESS
0
$0
1
$155,040
5
$81,846
0
$0
0
$0
0
$0
0
$0
Aggregated Statistics For Year 2007 (Based on 4 partial tracts)
A) FHA, FSA/RHS & VA Home Purchase Loans
B) Conventional Home Purchase Loans
C) Refinancings
D) Home Improvement Loans
E) Loans on Dwellings For 5+ Families
F) Non-occupant Loans on < 5 Family Dwellings (A B C & D)
G) Loans On Manufactured Home Dwelling (A B C & D)
Number
Average Value
Number
Average Value
Number
Average Value
Number
Average Value
Number
Average Value
Number
Average Value
Number
Average Value
LOANS ORIGINATED
31
$99,684
120
$92,692
105
$90,309
21
$29,740
1
$412,840
65
$78,581
13
$40,050
APPLICATIONS APPROVED, NOT ACCEPTED
0
$0
11
$56,993
12
$109,875
4
$36,308
0
$0
2
$74,170
5
$49,316
APPLICATIONS DENIED
4
$99,910
35
$75,609
54
$87,775
16
$19,952
0
$0
5
$62,002
6
$41,177
APPLICATIONS WITHDRAWN
0
$0
12
$83,801
30
$101,731
0
$0
0
$0
9
$71,894
3
$47,190
FILES CLOSED FOR INCOMPLETENESS
0
$0
3
$75,430
11
$135,018
1
$3,810
0
$0
0
$0
0
$0
Aggregated Statistics For Year 2006 (Based on 4 partial tracts)
A) FHA, FSA/RHS & VA Home Purchase Loans
B) Conventional Home Purchase Loans
C) Refinancings
D) Home Improvement Loans
E) Loans on Dwellings For 5+ Families
F) Non-occupant Loans on < 5 Family Dwellings (A B C & D)
G) Loans On Manufactured Home Dwelling (A B C & D)
Number
Average Value
Number
Average Value
Number
Average Value
Number
Average Value
Number
Average Value
Number
Average Value
Number
Average Value
LOANS ORIGINATED
29
$92,871
125
$87,212
102
$83,160
18
$29,009
4
$659,142
49
$72,948
8
$38,106
APPLICATIONS APPROVED, NOT ACCEPTED
1
$60,130
10
$72,149
15
$103,311
2
$41,620
0
$0
2
$48,925
4
$53,260
APPLICATIONS DENIED
3
$57,867
38
$63,775
54
$72,259
13
$29,578
0
$0
7
$62,057
12
$39,912
APPLICATIONS WITHDRAWN
3
$105,990
20
$70,810
45
$95,393
1
$30,380
0
$0
8
$44,434
1
$55,620
FILES CLOSED FOR INCOMPLETENESS
0
$0
3
$95,763
8
$89,009
1
$54,050
0
$0
0
$0
0
$0
Aggregated Statistics For Year 2005 (Based on 4 partial tracts)
A) FHA, FSA/RHS & VA Home Purchase Loans
B) Conventional Home Purchase Loans
C) Refinancings
D) Home Improvement Loans
E) Loans on Dwellings For 5+ Families
F) Non-occupant Loans on < 5 Family Dwellings (A B C & D)
G) Loans On Manufactured Home Dwelling (A B C & D)
Number
Average Value
Number
Average Value
Number
Average Value
Number
Average Value
Number
Average Value
Number
Average Value
Number
Average Value
LOANS ORIGINATED
27
$85,393
118
$85,474
104
$85,641
21
$55,828
4
$581,732
43
$59,386
5
$38,898
APPLICATIONS APPROVED, NOT ACCEPTED
0
$0
8
$83,206
13
$72,325
1
$10,280
0
$0
2
$77,245
3
$24,137
APPLICATIONS DENIED
5
$66,080
36
$62,750
66
$80,876
11
$33,825
0
$0
9
$79,921
18
$38,143
APPLICATIONS WITHDRAWN
2
$52,475
15
$136,281
39
$88,230
5
$127,172
0
$0
6
$49,650
0
$0
FILES CLOSED FOR INCOMPLETENESS
0
$0
0
$0
11
$129,976
0
$0
0
$0
0
$0
0
$0
Aggregated Statistics For Year 2004 (Based on 4 partial tracts)
A) FHA, FSA/RHS & VA Home Purchase Loans
B) Conventional Home Purchase Loans
C) Refinancings
D) Home Improvement Loans
E) Loans on Dwellings For 5+ Families
F) Non-occupant Loans on < 5 Family Dwellings (A B C & D)
G) Loans On Manufactured Home Dwelling (A B C & D)
Number
Average Value
Number
Average Value
Number
Average Value
Number
Average Value
Number
Average Value
Number
Average Value
Number
Average Value
LOANS ORIGINATED
34
$77,695
90
$88,562
154
$85,973
14
$34,629
4
$1,182,680
55
$78,061
11
$35,306
APPLICATIONS APPROVED, NOT ACCEPTED
1
$101,470
9
$83,020
19
$73,697
0
$0
0
$0
2
$51,645
3
$16,593
APPLICATIONS DENIED
4
$80,092
30
$71,094
71
$71,110
14
$24,853
0
$0
9
$40,303
7
$26,113
APPLICATIONS WITHDRAWN
2
$37,300
8
$76,928
35
$86,693
1
$44,760
0
$0
5
$46,086
0
$0
FILES CLOSED FOR INCOMPLETENESS
1
$35,780
3
$65,073
12
$74,153
0
$0
0
$0
0
$0
1
$12,180
Aggregated Statistics For Year 2003 (Based on 4 partial tracts)
A) FHA, FSA/RHS & VA Home Purchase Loans
B) Conventional Home Purchase Loans
C) Refinancings
D) Home Improvement Loans
E) Loans on Dwellings For 5+ Families
F) Non-occupant Loans on < 5 Family Dwellings (A B C & D)
Number
Average Value
Number
Average Value
Number
Average Value
Number
Average Value
Number
Average Value
Number
Average Value
LOANS ORIGINATED
41
$76,283
79
$88,513
253
$74,842
14
$17,697
2
$292,430
61
$63,088
APPLICATIONS APPROVED, NOT ACCEPTED
0
$0
9
$61,990
18
$79,933
1
$25,330
0
$0
4
$80,838
APPLICATIONS DENIED
13
$69,208
25
$56,999
87
$71,292
9
$22,413
0
$0
5
$38,884
APPLICATIONS WITHDRAWN
4
$58,965
11
$62,711
49
$73,124
2
$1,520
0
$0
6
$43,855
FILES CLOSED FOR INCOMPLETENESS
1
$42,630
1
$93,830
9
$73,192
0
$0
0
$0
1
$116,150
Aggregated Statistics For Year 2002 (Based on 4 partial tracts)
A) FHA, FSA/RHS & VA Home Purchase Loans
B) Conventional Home Purchase Loans
C) Refinancings
D) Home Improvement Loans
E) Loans on Dwellings For 5+ Families
F) Non-occupant Loans on < 5 Family Dwellings (A B C & D)
Number
Average Value
Number
Average Value
Number
Average Value
Number
Average Value
Number
Average Value
Number
Average Value
LOANS ORIGINATED
50
$69,435
88
$72,264
184
$70,174
17
$15,834
1
$120,190
69
$51,931
APPLICATIONS APPROVED, NOT ACCEPTED
2
$65,010
7
$64,013
30
$60,325
1
$17,870
0
$0
1
$47,380
APPLICATIONS DENIED
8
$58,918
21
$48,927
65
$64,035
9
$10,379
0
$0
2
$43,100
APPLICATIONS WITHDRAWN
3
$62,850
7
$84,173
22
$75,645
1
$44,230
0
$0
0
$0
FILES CLOSED FOR INCOMPLETENESS
0
$0
0
$0
7
$79,007
0
$0
0
$0
0
$0
Aggregated Statistics For Year 2001 (Based on 4 partial tracts)
A) FHA, FSA/RHS & VA Home Purchase Loans
B) Conventional Home Purchase Loans
C) Refinancings
D) Home Improvement Loans
F) Non-occupant Loans on < 5 Family Dwellings (A B C & D)
Number
Average Value
Number
Average Value
Number
Average Value
Number
Average Value
Number
Average Value
LOANS ORIGINATED
65
$70,890
77
$67,697
185
$68,900
30
$20,982
56
$58,901
APPLICATIONS APPROVED, NOT ACCEPTED
2
$61,155
3
$69,683
12
$64,452
0
$0
1
$37,560
APPLICATIONS DENIED
5
$71,686
21
$50,445
84
$52,166
12
$22,747
6
$24,900
APPLICATIONS WITHDRAWN
4
$75,020
5
$53,602
54
$57,812
0
$0
1
$62,550
FILES CLOSED FOR INCOMPLETENESS
1
$43,390
2
$36,155
10
$62,739
0
$0
0
$0
Aggregated Statistics For Year 2000 (Based on 4 partial tracts)
A) FHA, FSA/RHS & VA Home Purchase Loans
B) Conventional Home Purchase Loans
C) Refinancings
D) Home Improvement Loans
E) Loans on Dwellings For 5+ Families
F) Non-occupant Loans on < 5 Family Dwellings (A B C & D)
Number
Average Value
Number
Average Value
Number
Average Value
Number
Average Value
Number
Average Value
Number
Average Value
LOANS ORIGINATED
39
$71,429
102
$65,663
87
$56,415
35
$14,351
2
$309,120
46
$50,984
APPLICATIONS APPROVED, NOT ACCEPTED
2
$46,630
11
$51,171
15
$62,505
2
$7,995
0
$0
2
$19,765
APPLICATIONS DENIED
3
$67,703
25
$43,860
59
$48,971
15
$13,613
0
$0
3
$31,160
APPLICATIONS WITHDRAWN
2
$49,445
3
$71,007
35
$50,298
3
$18,817
0
$0
1
$12,940
FILES CLOSED FOR INCOMPLETENESS
1
$97,850
2
$51,735
10
$49,326
0
$0
0
$0
0
$0
Aggregated Statistics For Year 1999 (Based on 2 partial tracts)
A) FHA, FSA/RHS & VA Home Purchase Loans
B) Conventional Home Purchase Loans
C) Refinancings
D) Home Improvement Loans
F) Non-occupant Loans on < 5 Family Dwellings (A B C & D)
Detailed PMIC statistics for the following Tracts:0004.00
, 0009.00
2002 - 2018 National Fire Incident Reporting System (NFIRS) incidents
According to the data from the years 2002 - 2018 the average number of fire incidents per year is 23. The highest number of reported fire incidents - 43 took place in 2007, and the least - 0 in 2011. The data has a dropping trend.
When looking into fire subcategories, the most incidents belonged to: Outside Fires (46.5%), and Structure Fires (28.6%).
Fire incident types reported to NFIRS in Zip Code 72411


+$6,500
-$5,941
 Nearest zip codes: 72467, 72472, 72437, 72401, 72417, 72404.


 According to the data from the years 2002 - 2018 the average number of fire incidents per year is 23. The highest number of reported fire incidents - 43 took place in 2007, and the least - 0 in 2011. The data has a dropping trend.
 When looking into fire subcategories, the most incidents belonged to: Outside Fires (46.5%), and Structure Fires (28.6%).