Averages for the 2020 tax year for zip code 72768, filed in 2021:
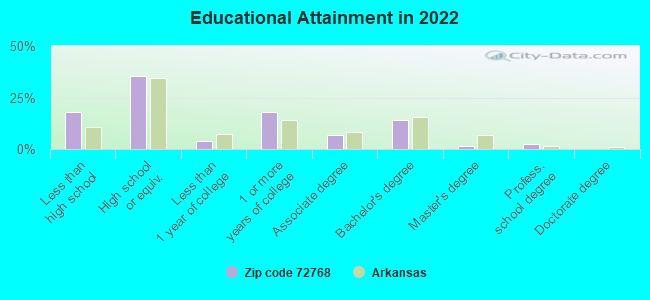
Average Adjusted Gross Income (AGI) in 2020: $46,606 (Individual Income Tax Returns)
Here:
$46,606
State:
$64,872
Salary/wage: $44,642 (reported on 85.1% of returns)
Here:
$44,642
State:
$50,644
(% of AGI for various income ranges: 1325.0% for AGIs below $25k, 3707.5% for AGIs $25k-50k, 7920.0% for AGIs $50k-75k, 37965.0% for AGIs $100k-200k)
Taxable interest for individuals: $189 (reported on 19.1% of returns)
This zip code:
$189
Arkansas:
$1,857
(% of AGI for various income ranges: 6.4% for AGIs below $25k, 10.0% for AGIs $50k-75k, 15.0% for AGIs $100k-200k)
Ordinary dividends: $475 (reported on 8.5% of returns)
Here:
$475
State:
$21,681
(% of AGI for various income ranges: 5.7% for AGIs below $25k)
Net capital gain/loss in AGI: +$2,575 (reported on 8.5% of returns)
Here:
+$2,575
State:
+$22,815
(% of AGI for various income ranges: 55.0% for AGIs below $25k, 130.0% for AGIs $100k-200k)
Profit/loss from business: +$11,886 (reported on 14.9% of returns)
Here:
+$11,886
State:
+$9,743
(% of AGI for various income ranges: 365.7% for AGIs below $25k, 640.0% for AGIs $50k-75k)
Earned income credit: $2,500 (reported on 27.7% of returns)
Here:
$2,500
State:
$2,546
(% of AGI for various income ranges: 150.0% for AGIs below $25k, 95.8% for AGIs $25k-50k)
Percentage of individuals using paid preparers for their 2020 taxes: 93.6%
Here:
94%
State:
94%
(% for various income ranges: 90.0% for AGIs below $25k, 100.0% for AGIs $25k-50k, 83.3% for AGIs $50k-75k, 100.0% for AGIs $75k-100k, 100.0% for AGIs $100k-200k)
Averages for the 2012 tax year for zip code 72768, filed in 2013:
Average Adjusted Gross Income (AGI) in 2012: $32,356 (Individual Income Tax Returns)
Here:
$32,356
State:
$52,148
Salary/wage: $30,030 (reported on 84.6% of returns)
Here:
$30,030
State:
$41,669
(% of AGI for various income ranges: 76.8% for AGIs below $25k, 79.7% for AGIs $25k-50k, 79.7% for AGIs $50k-75k, 77.6% for AGIs $75k-100k)
Taxable interest for individuals: $250 (reported on 20.5% of returns)
This zip code:
$250
Arkansas:
$1,648
(% of AGI for various income ranges: 0.2% for AGIs below $25k, 0.2% for AGIs $25k-50k, 0.2% for AGIs $50k-75k)
Ordinary dividends: $500 (reported on 10.3% of returns)
Here:
$500
State:
$20,675
Net capital gain/loss in AGI: +$1,350 (reported on 10.3% of returns)
Here:
+$1,350
State:
+$15,222
Profit/loss from business: +$4,929 (reported on 17.9% of returns)
Here:
+$4,929
State:
+$9,665
Taxable individual retirement arrangement distribution: $5,650 (reported on 5.1% of returns)
72768:
$5,650
Arkansas:
$13,644
Total itemized deductions: $17,600 (23% of AGI, reported on 10.3% of returns)
Here:
$17,600
State:
$23,276
Here:
22.6% of AGI
State:
19.1% of AGI
Charity contributions: $3,133 (reported on 7.7% of returns)
Here:
$3,133
State:
$5,996
Taxes paid: $4,750 (reported on 10.3% of returns)
72768:
$4,750
State:
$7,941
Earned income credit: $2,431 (reported on 33.3% of returns)
Here:
$2,431
State:
$2,455
(% of AGI for various income ranges: 8.4% for AGIs below $25k, 2.3% for AGIs $25k-50k)
Percentage of individuals using paid preparers for their 2012 taxes: 69.2%
Here:
69%
State:
61%
(% for various income ranges: 65.0% for AGIs below $25k, 75.0% for AGIs $25k-50k, 75.0% for AGIs $50k-75k, 66.7% for AGIs $75k-100k)
Averages for the 2004 tax year for zip code 72768, filed in 2005:
Average Adjusted Gross Income (AGI) in 2004: $29,799 (Individual Income Tax Returns)
Here:
$29,799
State:
$39,270
Salary/wage: $27,937 (reported on 84.2% of returns)
Here:
$27,937
State:
$34,079
(% of AGI for various income ranges: 110.0% for AGIs below $10k, 81.8% for AGIs $10k-25k, 86.0% for AGIs $25k-50k, 82.6% for AGIs $50k-75k, 83.0% for AGIs $75k-100k, 56.8% for AGIs over 100k)
Taxable interest for individuals: $659 (reported on 28.2% of returns)
This zip code:
$659
Arkansas:
$1,904
(% of AGI for various income ranges: 1.1% for AGIs below $10k, 0.6% for AGIs $10k-25k, 1.1% for AGIs $25k-50k, 0.5% for AGIs $50k-75k, 0.2% for AGIs over 100k)
Taxable dividends: $293 (reported on 12.4% of returns)
Here:
$293
State:
$5,995
Net capital gain/loss: +$5,290 (reported on 13.2% of returns)
Here:
+$5,290
State:
+$10,430
Profit/loss from business: +$4,625 (reported on 18.8% of returns)
Here:
+$4,625
State:
+$7,823
(% of AGI for various income ranges: 22.2% for AGIs below $10k, 3.7% for AGIs $10k-25k, 3.9% for AGIs $25k-50k, 1.4% for AGIs $50k-75k)
Total itemized deductions: $16,554 (20% of AGI, reported on 12.0% of returns)
Here:
$16,554
State:
$18,389
Here:
19.7% of AGI
State:
21.0% of AGI
Charity contributions deductions: $2,950 (3% of AGI, reported on 8.5% of returns)
Here:
$2,950
State:
$4,725
Here:
3.0% of AGI
State:
5.1% of AGI
(% of AGI for various income ranges: 3.1% for AGIs below $10k, 1.5% for AGIs $50k-75k, 2.2% for AGIs over 100k)
Total tax: $3,631 (reported on 67.1% of returns)
72768:
$3,631
State:
$6,047
(% of AGI for various income ranges: 4.4% for AGIs below $10k, 3.9% for AGIs $10k-25k, 6.1% for AGIs $25k-50k, 7.9% for AGIs $50k-75k, 10.7% for AGIs $75k-100k, 15.1% for AGIs over 100k)
Earned income credit: $1,835 (reported on 27.1% of returns)
Here:
$1,835
State:
$1,909
Percentage of individuals using paid preparers for their 2004 taxes: 74.6%
Here:
75%
State:
67%
(% for various income ranges: 66.1% for AGIs below $10k, 75.7% for AGIs $10k-25k, 77.3% for AGIs $25k-50k, 102.5% for AGIs $50k-75k, 92.3% for AGIs over 100k)
Household received Food Stamps/SNAP in the past 12 months: 76 Household did not receive Food Stamps/SNAP in the past 12 months: 427
Women who had a birth in the past 12 months: 54 (0 now married, 52 unmarried) Women who did not have a birth in the past 12 months: 394 (197 now married, 197 unmarried)
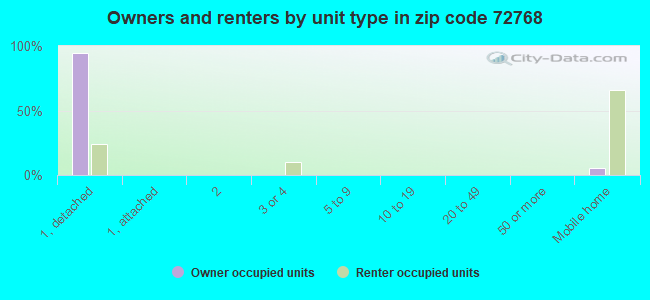
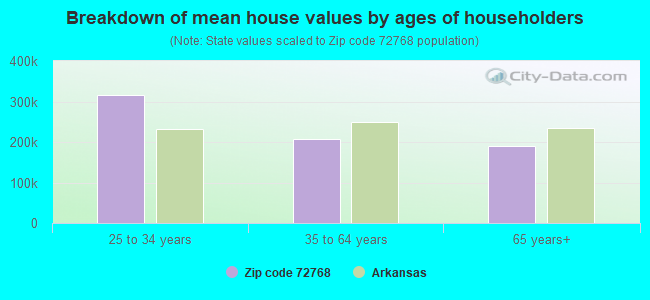
Housing units in zip code 72768 with a mortgage: 176 Median monthly owner costs for units with a mortgage: $1,344 Median monthly owner costs for units without a mortgage: $447
Residents with income below the poverty level in 2022:
This zip code:
9.1%
Whole state:
16.8%
Residents with income below 50% of the poverty level in 2022:
This zip code:
1.2%
Whole state:
8.5%
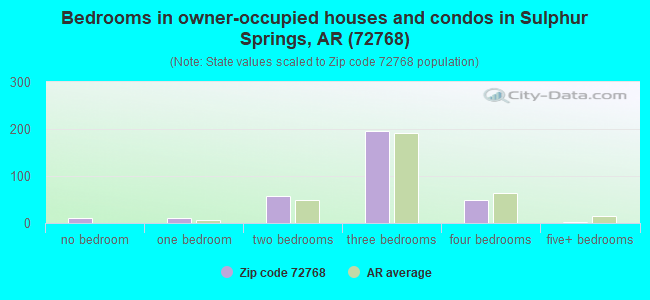
Median number of rooms in houses and condos:
Here:
5.4
State:
6.1
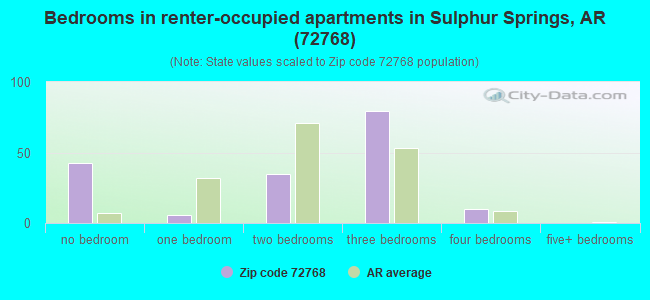
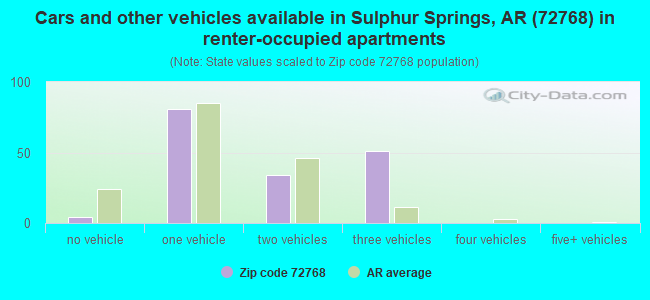
Median number of rooms in apartments:
Here:
4.5
State:
4.3
Notable locations in this zip code not listed on our city pages
Notable locations in zip code 72768: Circle L Ranch (A), Sulphur Springs Fire Station (B), Sulphur Springs Police Department (C). Display/hide their locations on the map
Cemeteries: Grand Army of the Republic Cemetery (1), Wann Cemetery (2), Lee Cemetery (3), Butler Creek Cemetery (4). Display/hide their locations on the map
In group quarters: 3 (-1 institutionalized population)
Size of family households: 97 2-persons, 60 3-persons, 147 4-persons, 42 5-persons, 9 6-persons
Size of nonfamily households: 138 1-person
251 married couples with children.
23 single-parent households (12 men, 11 women).
96.6% of residents of 72768 zip code speak English at home.
1.4% of residents speak Spanish at home (100% very well).
1.2% of residents speak Asian or Pacific Island language at home (44% well, 56% not well).
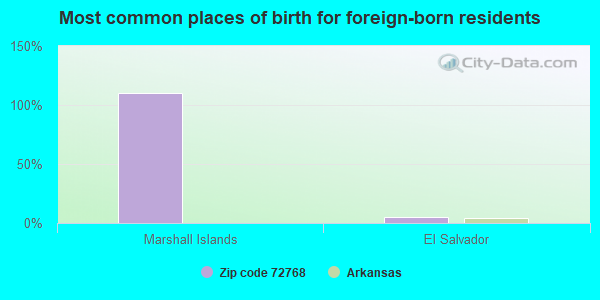
Foreign born population: 20 (1.4%) (0.0% of them are naturalized citizens)
:
1.4%
Whole state:
5.1%
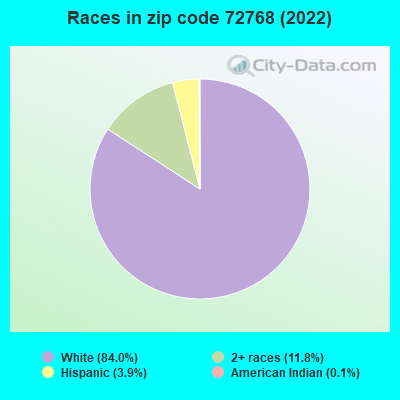
110%Marshall Islands
5%El Salvador
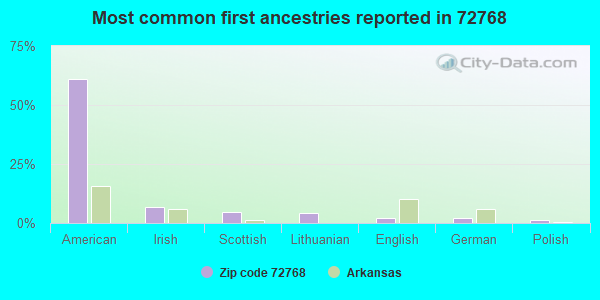
61%American
7%Irish
5%Scottish
4%Lithuanian
2%English
2%German
1%Polish
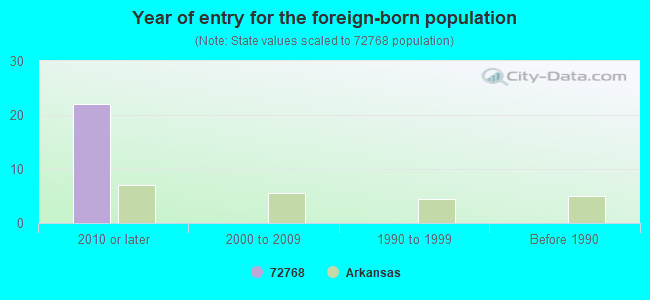
Year of entry for the foreign-born population
222010 or later
02000 to 2009
01990 to 1999
0Before 1990
Facilities with environmental interests located in this zip code:
SIBLEY ENGINEERING & MFG INC (SIBLEY ROAD in SULPHUR SPRINGS, AR)
Conditionally Exempt Small Quantity Generators, less than 100 kg/month of hazardous waste (Resource Conservation and Recovery Act (tracking hazardous waste)) - notification Organizations: FM STRUCTURAL PLASTIC TECHNOLOGY INC (CONTACT/OWNER)
Housing units lacking complete plumbing facilities: 13.3% Housing units lacking complete kitchen facilities: 14.7%
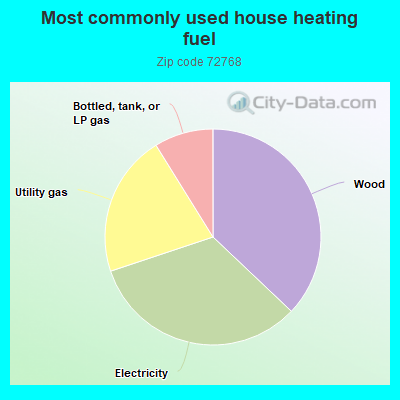
37.3%Wood
33.0%Electricity
21.4%Utility gas
8.9%Bottled, tank, or LP gas
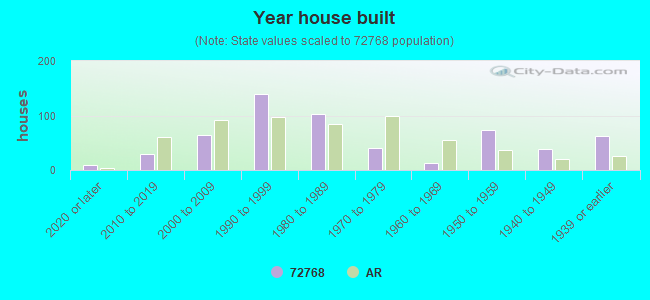
Population in 1990: 982. Population change in the 1990s: +599 (+61.0%).
Place of birth for U.S.-born residents:
This state: 686
Northeast: 108
Midwest: 176
South: 408
West: 46
61% of the 72768 zip code residents lived in the same house 5 years ago. Out of people who lived in different houses, 54% lived in this county. Out of people who lived in different counties, 50% lived in Arkansas.
67% of the 72768 zip code residents lived in the same house 1 year ago. Out of people who lived in different houses, 73% moved from this county. Out of people who lived in different houses, 12% moved from different state. Out of people who lived in different houses, 3% moved from abroad.
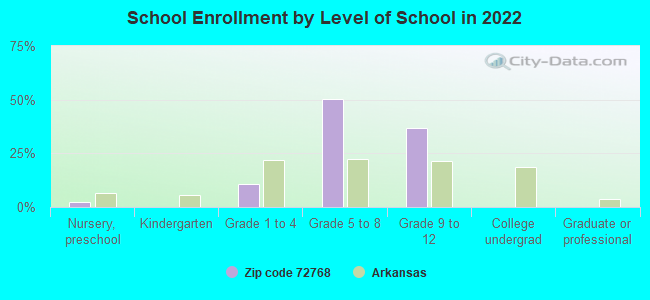
Private vs. public school enrollment:
Students in private schools in grades 1 to 8 (elementary and middle school): 87
Here:
54.5%
Arkansas:
10.5%
Students in private schools in grades 9 to 12 (high school): 70
Here:
74.2%
Arkansas:
8.7%
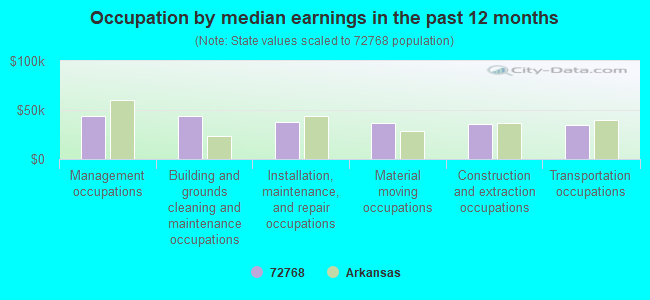
Occupation by median earnings in the past 12 months ($)
44,205Management occupations
43,660Building and grounds cleaning and maintenance occupations
37,867Installation, maintenance, and repair occupations
36,983Material moving occupations
35,595Construction and extraction occupations
35,153Transportation occupations
Top industries in this zip code by the number of employees in 2005:
Mining: Crushed and Broken Limestone Mining and Quarrying (20-49 employees: 1 establishment)
Construction: Commercial and Institutional Building Construction (5-9: 1)
Professional, Scientific, and Technical Services: Process, Physical Distribution, and Logistics Consulting Services (1-4: 1)
Construction: Electrical Contractors (1-4: 1)
Fatal accident statistics in 2012:
Fatal accident count: 1
Vehicles involved in fatal accidents: 1
Fatal accidents caused by drunken drivers: 1
Fatalities: 1
Persons involved in fatal accidents: 1
Pedestrians involved in fatal accidents: 0
Home Mortgage Disclosure Act Aggregated Statistics For Year 2009 (Based on 4 partial tracts)
A) FHA, FSA/RHS & VA Home Purchase Loans
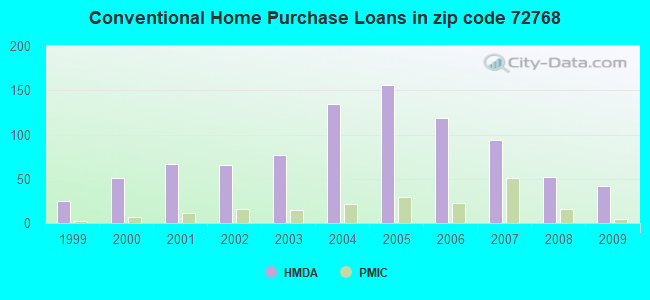
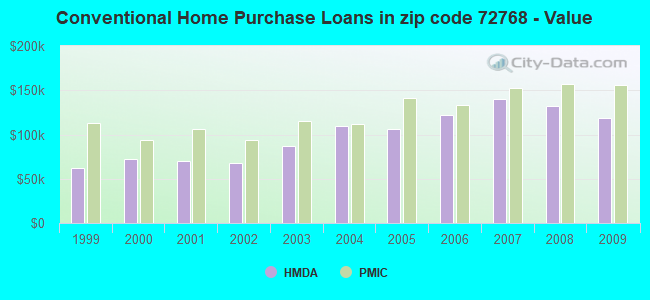
B) Conventional Home Purchase Loans
C) Refinancings
D) Home Improvement Loans
F) Non-occupant Loans on < 5 Family Dwellings (A B C & D)
G) Loans On Manufactured Home Dwelling (A B C & D)
Number
Average Value
Number
Average Value
Number
Average Value
Number
Average Value
Number
Average Value
Number
Average Value
LOANS ORIGINATED
67
$129,009
42
$118,474
95
$161,820
18
$34,186
19
$159,571
9
$51,027
APPLICATIONS APPROVED, NOT ACCEPTED
2
$105,760
2
$147,225
9
$154,064
2
$60,105
0
$0
1
$147,690
APPLICATIONS DENIED
14
$142,128
13
$108,405
47
$162,580
5
$26,438
4
$147,000
7
$64,780
APPLICATIONS WITHDRAWN
5
$139,398
6
$111,628
22
$151,385
2
$23,885
2
$74,270
0
$0
FILES CLOSED FOR INCOMPLETENESS
3
$119,180
0
$0
3
$159,940
0
$0
0
$0
0
$0
Aggregated Statistics For Year 2008 (Based on 4 partial tracts)
A) FHA, FSA/RHS & VA Home Purchase Loans
B) Conventional Home Purchase Loans
C) Refinancings
D) Home Improvement Loans
F) Non-occupant Loans on < 5 Family Dwellings (A B C & D)
G) Loans On Manufactured Home Dwelling (A B C & D)
Number
Average Value
Number
Average Value
Number
Average Value
Number
Average Value
Number
Average Value
Number
Average Value
LOANS ORIGINATED
48
$124,593
52
$132,088
93
$159,897
21
$40,366
29
$165,280
10
$60,236
APPLICATIONS APPROVED, NOT ACCEPTED
1
$143,610
2
$175,510
5
$169,406
2
$97,490
2
$107,350
0
$0
APPLICATIONS DENIED
10
$123,705
13
$125,120
43
$142,804
7
$26,419
5
$150,098
3
$58,427
APPLICATIONS WITHDRAWN
6
$124,528
4
$118,380
14
$134,953
1
$92,470
2
$101,820
2
$57,860
FILES CLOSED FOR INCOMPLETENESS
1
$109,510
1
$153,590
6
$128,765
0
$0
0
$0
0
$0
Aggregated Statistics For Year 2007 (Based on 4 partial tracts)
A) FHA, FSA/RHS & VA Home Purchase Loans
B) Conventional Home Purchase Loans
C) Refinancings
D) Home Improvement Loans
F) Non-occupant Loans on < 5 Family Dwellings (A B C & D)
G) Loans On Manufactured Home Dwelling (A B C & D)
Number
Average Value
Number
Average Value
Number
Average Value
Number
Average Value
Number
Average Value
Number
Average Value
LOANS ORIGINATED
25
$135,293
94
$139,827
108
$134,403
32
$43,517
44
$146,220
12
$72,692
APPLICATIONS APPROVED, NOT ACCEPTED
0
$0
7
$134,116
13
$158,708
3
$48,953
2
$159,265
1
$61,210
APPLICATIONS DENIED
4
$156,132
33
$152,820
56
$150,680
13
$42,526
20
$177,866
4
$67,798
APPLICATIONS WITHDRAWN
2
$115,645
9
$153,636
22
$121,116
3
$31,577
7
$140,607
0
$0
FILES CLOSED FOR INCOMPLETENESS
1
$120,800
1
$168,130
10
$142,888
0
$0
1
$176,310
0
$0
Aggregated Statistics For Year 2006 (Based on 4 partial tracts)
A) FHA, FSA/RHS & VA Home Purchase Loans
B) Conventional Home Purchase Loans
C) Refinancings
D) Home Improvement Loans
F) Non-occupant Loans on < 5 Family Dwellings (A B C & D)
G) Loans On Manufactured Home Dwelling (A B C & D)
Number
Average Value
Number
Average Value
Number
Average Value
Number
Average Value
Number
Average Value
Number
Average Value
LOANS ORIGINATED
22
$123,950
119
$122,149
96
$141,128
33
$44,853
38
$148,028
13
$75,478
APPLICATIONS APPROVED, NOT ACCEPTED
1
$61,760
11
$109,851
7
$155,869
2
$40,375
1
$207,210
3
$80,917
APPLICATIONS DENIED
4
$108,360
37
$96,224
49
$120,533
13
$43,478
13
$106,723
11
$72,328
APPLICATIONS WITHDRAWN
2
$204,705
15
$136,689
32
$133,150
2
$48,325
9
$115,419
2
$85,225
FILES CLOSED FOR INCOMPLETENESS
1
$84,510
3
$140,043
7
$141,419
0
$0
0
$0
1
$70,580
Aggregated Statistics For Year 2005 (Based on 4 partial tracts)
A) FHA, FSA/RHS & VA Home Purchase Loans
B) Conventional Home Purchase Loans
C) Refinancings
D) Home Improvement Loans
E) Loans on Dwellings For 5+ Families
F) Non-occupant Loans on < 5 Family Dwellings (A B C & D)
G) Loans On Manufactured Home Dwelling (A B C & D)
Number
Average Value
Number
Average Value
Number
Average Value
Number
Average Value
Number
Average Value
Number
Average Value
Number
Average Value
LOANS ORIGINATED
24
$124,316
156
$106,708
106
$110,603
32
$40,803
1
$1,634,160
39
$91,961
18
$48,276
APPLICATIONS APPROVED, NOT ACCEPTED
0
$0
14
$94,027
9
$101,879
2
$37,385
0
$0
1
$143,630
2
$45,300
APPLICATIONS DENIED
4
$120,630
34
$91,149
50
$101,603
14
$38,896
0
$0
7
$64,129
11
$58,183
APPLICATIONS WITHDRAWN
1
$123,600
19
$103,106
33
$120,578
5
$50,764
0
$0
4
$80,762
1
$144,990
FILES CLOSED FOR INCOMPLETENESS
3
$98,757
5
$134,128
4
$129,360
0
$0
0
$0
1
$109,200
0
$0
Aggregated Statistics For Year 2004 (Based on 4 partial tracts)
A) FHA, FSA/RHS & VA Home Purchase Loans
B) Conventional Home Purchase Loans
C) Refinancings
D) Home Improvement Loans
F) Non-occupant Loans on < 5 Family Dwellings (A B C & D)
G) Loans On Manufactured Home Dwelling (A B C & D)
Number
Average Value
Number
Average Value
Number
Average Value
Number
Average Value
Number
Average Value
Number
Average Value
LOANS ORIGINATED
25
$106,074
134
$109,467
92
$96,792
28
$43,706
36
$108,616
17
$54,106
APPLICATIONS APPROVED, NOT ACCEPTED
1
$67,480
9
$101,658
11
$97,498
0
$0
0
$0
4
$66,550
APPLICATIONS DENIED
4
$96,245
28
$88,725
32
$94,698
6
$23,568
3
$114,103
14
$49,650
APPLICATIONS WITHDRAWN
1
$173,070
9
$86,026
30
$100,214
1
$38,850
2
$85,315
2
$111,970
FILES CLOSED FOR INCOMPLETENESS
0
$0
2
$117,955
3
$100,830
1
$111,780
0
$0
0
$0
Aggregated Statistics For Year 2003 (Based on 4 partial tracts)
A) FHA, FSA/RHS & VA Home Purchase Loans
B) Conventional Home Purchase Loans
C) Refinancings
D) Home Improvement Loans
F) Non-occupant Loans on < 5 Family Dwellings (A B C & D)
Number
Average Value
Number
Average Value
Number
Average Value
Number
Average Value
Number
Average Value
LOANS ORIGINATED
26
$101,841
77
$87,097
149
$88,068
19
$32,609
30
$64,413
APPLICATIONS APPROVED, NOT ACCEPTED
1
$48,110
3
$72,620
13
$100,056
0
$0
1
$70,040
APPLICATIONS DENIED
4
$91,620
33
$80,702
43
$78,735
5
$11,438
2
$86,785
APPLICATIONS WITHDRAWN
2
$75,510
9
$76,850
19
$95,439
1
$19,770
1
$49,880
FILES CLOSED FOR INCOMPLETENESS
1
$80,310
2
$123,405
5
$88,110
0
$0
0
$0
Aggregated Statistics For Year 2002 (Based on 4 partial tracts)
A) FHA, FSA/RHS & VA Home Purchase Loans
B) Conventional Home Purchase Loans
C) Refinancings
D) Home Improvement Loans
F) Non-occupant Loans on < 5 Family Dwellings (A B C & D)
Number
Average Value
Number
Average Value
Number
Average Value
Number
Average Value
Number
Average Value
LOANS ORIGINATED
17
$82,581
66
$68,312
114
$87,502
18
$30,658
24
$46,317
APPLICATIONS APPROVED, NOT ACCEPTED
1
$119,630
6
$43,302
10
$92,127
1
$34,080
1
$21,190
APPLICATIONS DENIED
3
$60,533
25
$51,904
41
$85,992
5
$16,906
2
$41,040
APPLICATIONS WITHDRAWN
1
$82,960
6
$83,373
21
$83,698
0
$0
1
$54,030
FILES CLOSED FOR INCOMPLETENESS
0
$0
0
$0
6
$84,295
0
$0
0
$0
Aggregated Statistics For Year 2001 (Based on 4 partial tracts)
A) FHA, FSA/RHS & VA Home Purchase Loans
B) Conventional Home Purchase Loans
C) Refinancings
D) Home Improvement Loans
F) Non-occupant Loans on < 5 Family Dwellings (A B C & D)
Number
Average Value
Number
Average Value
Number
Average Value
Number
Average Value
Number
Average Value
LOANS ORIGINATED
24
$82,961
67
$69,976
93
$87,160
16
$25,496
19
$49,913
APPLICATIONS APPROVED, NOT ACCEPTED
0
$0
7
$47,976
9
$90,703
1
$125,250
2
$45,100
APPLICATIONS DENIED
3
$121,587
23
$58,431
42
$76,279
8
$11,395
2
$44,405
APPLICATIONS WITHDRAWN
2
$65,260
5
$63,854
22
$76,719
1
$14,180
1
$76,480
FILES CLOSED FOR INCOMPLETENESS
0
$0
2
$56,665
3
$59,597
0
$0
1
$26,470
Aggregated Statistics For Year 2000 (Based on 4 partial tracts)
A) FHA, FSA/RHS & VA Home Purchase Loans
B) Conventional Home Purchase Loans
C) Refinancings
D) Home Improvement Loans
F) Non-occupant Loans on < 5 Family Dwellings (A B C & D)
Number
Average Value
Number
Average Value
Number
Average Value
Number
Average Value
Number
Average Value
LOANS ORIGINATED
26
$78,277
51
$72,477
53
$79,622
13
$20,202
14
$46,058
APPLICATIONS APPROVED, NOT ACCEPTED
1
$83,040
9
$43,686
6
$71,763
2
$4,995
0
$0
APPLICATIONS DENIED
3
$71,730
32
$50,524
28
$69,121
6
$27,240
1
$51,680
APPLICATIONS WITHDRAWN
2
$56,685
3
$72,813
9
$57,392
2
$27,720
1
$13,230
FILES CLOSED FOR INCOMPLETENESS
0
$0
0
$0
2
$131,080
0
$0
0
$0
Aggregated Statistics For Year 1999 (Based on 2 partial tracts)
A) FHA, FSA/RHS & VA Home Purchase Loans
B) Conventional Home Purchase Loans
C) Refinancings
D) Home Improvement Loans
F) Non-occupant Loans on < 5 Family Dwellings (A B C & D)


 Nearest zip codes: 72736, 64854, 64863, 64847, 72747, 72722.