Cities: Tool, TX (1.76%) ,
Seven Points, TX (1.36%) ,
Kemp, TX (1.29%) ,
Mabank, TX (0.32%) Counties: Kaufman County, TX (53.55%) ,
Henderson County, TX (46.45%) Estimated zip code population in 2022: 14,976
Zip code population in 2010: 14,619
Zip code population in 2000: 13,008
Houses and condos: 7,466
Renter-occupied apartments: 1,010
% of renters here:
17%State:
38%
March 2022 cost of living index in zip code 75143: 84.4
(less than average, U.S. average is 100)
Land area: 177.8
sq. mi.
Water area: 24.6
sq. mi.
Population density: 84 people per square mile (very low).
OSM Map
General Map
Google Map
MSN Map
OSM Map
General Map
Google Map
MSN Map
OSM Map
General Map
Google Map
MSN Map
OSM Map
General Map
Google Map
MSN Map
Please wait while loading the map...
Real estate property taxes paid for housing units in 2022:
This zip code:
1.1% ($1,860)Texas:
1.5% ($4,050)
Median real estate property taxes paid for housing units with mortgages in 2022: $2,412 (1.0%)
Median real estate property taxes paid for housing units with no mortgage in 2022: $1,561 (1.4%)
Profiles of local businesses
Business Search - 14 Million verified businesses
Males: 7,458 Females: 7,517
For population 25 years and over in 75143:
High school or higher: 83.9%Bachelor's degree or higher: 17.6%Graduate or professional degree: 4.2%Unemployed: 4.9%Mean travel time to work (commute): 39.4 minutes
For population 15 years and over in 75143:
Never married: 18.1%Now married: 61.0%Separated: 3.3%Widowed: 7.3%Divorced: 10.2%
Zip code 75143 compared to state average:
Median house value below state average. Black race population percentage significantly below state average. Hispanic race population percentage significantly below state average. Median age above state average. Foreign-born population percentage significantly below state average. Renting percentage below state average. Length of stay since moving in above state average. Percentage of population with a bachelor's degree or higher below state average. 12,523 83.6% White 1,951 13.0% Hispanic or Latino 320 2.1% Two or more races 69 0.5% Black 59 0.4% Asian 46 0.3% American Indian 5 0.03% Native Hawaiian and Other
Data:
Median household income ($)
Median household income (% change since 2000)
Household income diversity
Ratio of average income to average house value (%)
Ratio of average income to average rent
Median household income ($) - White
Median household income ($) - Black or African American
Median household income ($) - Asian
Median household income ($) - Hispanic or Latino
Median household income ($) - American Indian and Alaska Native
Median household income ($) - Multirace
Median household income ($) - Other Race
Median household income for houses/condos with a mortgage ($)
Median household income for apartments without a mortgage ($)
Races - White alone (%)
Races - White alone (% change since 2000)
Races - Black alone (%)
Races - Black alone (% change since 2000)
Races - American Indian alone (%)
Races - American Indian alone (% change since 2000)
Races - Asian alone (%)
Races - Asian alone (% change since 2000)
Races - Hispanic (%)
Races - Hispanic (% change since 2000)
Races - Native Hawaiian and Other Pacific Islander alone (%)
Races - Native Hawaiian and Other Pacific Islander alone (% change since 2000)
Races - Two or more races (%)
Races - Two or more races (% change since 2000)
Races - Other race alone (%)
Races - Other race alone (% change since 2000)
Racial diversity
Unemployment (%)
Unemployment (% change since 2000)
Unemployment (%) - White
Unemployment (%) - Black or African American
Unemployment (%) - Asian
Unemployment (%) - Hispanic or Latino
Unemployment (%) - American Indian and Alaska Native
Unemployment (%) - Multirace
Unemployment (%) - Other Race
Population density (people per square mile)
Population - Males (%)
Population - Females (%)
Population - Males (%) - White
Population - Males (%) - Black or African American
Population - Males (%) - Asian
Population - Males (%) - Hispanic or Latino
Population - Males (%) - American Indian and Alaska Native
Population - Males (%) - Multirace
Population - Males (%) - Other Race
Population - Females (%) - White
Population - Females (%) - Black or African American
Population - Females (%) - Asian
Population - Females (%) - Hispanic or Latino
Population - Females (%) - American Indian and Alaska Native
Population - Females (%) - Multirace
Population - Females (%) - Other Race
Coronavirus confirmed cases (Jun 17, 2024)
Deaths caused by coronavirus (Jun 17, 2024)
Coronavirus confirmed cases (per 100k population) (Jun 17, 2024)
Deaths caused by coronavirus (per 100k population) (Jun 17, 2024)
Daily increase in number of cases (Jun 17, 2024)
Weekly increase in number of cases (Jun 17, 2024)
Cases doubled (in days) (Jun 17, 2024)
Hospitalized patients (Apr 18, 2022)
Negative test results (Apr 18, 2022)
Total test results (Apr 18, 2022)
COVID Vaccine doses distributed (per 100k population) (Sep 19, 2023)
COVID Vaccine doses administered (per 100k population) (Sep 19, 2023)
COVID Vaccine doses distributed (Sep 19, 2023)
COVID Vaccine doses administered (Sep 19, 2023)
Likely homosexual households (%)
Likely homosexual households (% change since 2000)
Likely homosexual households - Lesbian couples (%)
Likely homosexual households - Lesbian couples (% change since 2000)
Likely homosexual households - Gay men (%)
Likely homosexual households - Gay men (% change since 2000)
Cost of living index
Median gross rent ($)
Median contract rent ($)
Median monthly housing costs ($)
Median house or condo value ($)
Median house or condo value ($ change since 2000)
Mean house or condo value by units in structure - 1, detached ($)
Mean house or condo value by units in structure - 1, attached ($)
Mean house or condo value by units in structure - 2 ($)
Mean house or condo value by units in structure by units in structure - 3 or 4 ($)
Mean house or condo value by units in structure - 5 or more ($)
Mean house or condo value by units in structure - Boat, RV, van, etc. ($)
Mean house or condo value by units in structure - Mobile home ($)
Median house or condo value ($) - White
Median house or condo value ($) - Black or African American
Median house or condo value ($) - Asian
Median house or condo value ($) - Hispanic or Latino
Median house or condo value ($) - American Indian and Alaska Native
Median house or condo value ($) - Multirace
Median house or condo value ($) - Other Race
Median resident age
Resident age diversity
Median resident age - Males
Median resident age - Females
Median resident age - White
Median resident age - Black or African American
Median resident age - Asian
Median resident age - Hispanic or Latino
Median resident age - American Indian and Alaska Native
Median resident age - Multirace
Median resident age - Other Race
Median resident age - Males - White
Median resident age - Males - Black or African American
Median resident age - Males - Asian
Median resident age - Males - Hispanic or Latino
Median resident age - Males - American Indian and Alaska Native
Median resident age - Males - Multirace
Median resident age - Males - Other Race
Median resident age - Females - White
Median resident age - Females - Black or African American
Median resident age - Females - Asian
Median resident age - Females - Hispanic or Latino
Median resident age - Females - American Indian and Alaska Native
Median resident age - Females - Multirace
Median resident age - Females - Other Race
Commute - mean travel time to work (minutes)
Travel time to work - Less than 5 minutes (%)
Travel time to work - Less than 5 minutes (% change since 2000)
Travel time to work - 5 to 9 minutes (%)
Travel time to work - 5 to 9 minutes (% change since 2000)
Travel time to work - 10 to 19 minutes (%)
Travel time to work - 10 to 19 minutes (% change since 2000)
Travel time to work - 20 to 29 minutes (%)
Travel time to work - 20 to 29 minutes (% change since 2000)
Travel time to work - 30 to 39 minutes (%)
Travel time to work - 30 to 39 minutes (% change since 2000)
Travel time to work - 40 to 59 minutes (%)
Travel time to work - 40 to 59 minutes (% change since 2000)
Travel time to work - 60 to 89 minutes (%)
Travel time to work - 60 to 89 minutes (% change since 2000)
Travel time to work - 90 or more minutes (%)
Travel time to work - 90 or more minutes (% change since 2000)
Marital status - Never married (%)
Marital status - Now married (%)
Marital status - Separated (%)
Marital status - Widowed (%)
Marital status - Divorced (%)
Median family income ($)
Median family income (% change since 2000)
Median non-family income ($)
Median non-family income (% change since 2000)
Median per capita income ($)
Median per capita income (% change since 2000)
Median family income ($) - White
Median family income ($) - Black or African American
Median family income ($) - Asian
Median family income ($) - Hispanic or Latino
Median family income ($) - American Indian and Alaska Native
Median family income ($) - Multirace
Median family income ($) - Other Race
Median year house/condo built
Median year apartment built
Year house built - Built 2005 or later (%)
Year house built - Built 2000 to 2004 (%)
Year house built - Built 1990 to 1999 (%)
Year house built - Built 1980 to 1989 (%)
Year house built - Built 1970 to 1979 (%)
Year house built - Built 1960 to 1969 (%)
Year house built - Built 1950 to 1959 (%)
Year house built - Built 1940 to 1949 (%)
Year house built - Built 1939 or earlier (%)
Average household size
Household density (households per square mile)
Average household size - White
Average household size - Black or African American
Average household size - Asian
Average household size - Hispanic or Latino
Average household size - American Indian and Alaska Native
Average household size - Multirace
Average household size - Other Race
Occupied housing units (%)
Vacant housing units (%)
Owner occupied housing units (%)
Renter occupied housing units (%)
Vacancy status - For rent (%)
Vacancy status - For sale only (%)
Vacancy status - Rented or sold, not occupied (%)
Vacancy status - For seasonal, recreational, or occasional use (%)
Vacancy status - For migrant workers (%)
Vacancy status - Other vacant (%)
Residents with income below the poverty level (%)
Residents with income below 50% of the poverty level (%)
Children below poverty level (%)
Poor families by family type - Married-couple family (%)
Poor families by family type - Male, no wife present (%)
Poor families by family type - Female, no husband present (%)
Poverty status for native-born residents (%)
Poverty status for foreign-born residents (%)
Poverty among high school graduates not in families (%)
Poverty among people who did not graduate high school not in families (%)
Residents with income below the poverty level (%) - White
Residents with income below the poverty level (%) - Black or African American
Residents with income below the poverty level (%) - Asian
Residents with income below the poverty level (%) - Hispanic or Latino
Residents with income below the poverty level (%) - American Indian and Alaska Native
Residents with income below the poverty level (%) - Multirace
Residents with income below the poverty level (%) - Other Race
Air pollution - Air Quality Index (AQI)
Air pollution - CO
Air pollution - NO2
Air pollution - SO2
Air pollution - Ozone
Air pollution - PM10
Air pollution - PM25
Air pollution - Pb
Crime - Murders per 100,000 population
Crime - Rapes per 100,000 population
Crime - Robberies per 100,000 population
Crime - Assaults per 100,000 population
Crime - Burglaries per 100,000 population
Crime - Thefts per 100,000 population
Crime - Auto thefts per 100,000 population
Crime - Arson per 100,000 population
Crime - City-data.com crime index
Crime - Violent crime index
Crime - Property crime index
Crime - Murders per 100,000 population (5 year average)
Crime - Rapes per 100,000 population (5 year average)
Crime - Robberies per 100,000 population (5 year average)
Crime - Assaults per 100,000 population (5 year average)
Crime - Burglaries per 100,000 population (5 year average)
Crime - Thefts per 100,000 population (5 year average)
Crime - Auto thefts per 100,000 population (5 year average)
Crime - Arson per 100,000 population (5 year average)
Crime - City-data.com crime index (5 year average)
Crime - Violent crime index (5 year average)
Crime - Property crime index (5 year average)
1996 Presidential Elections Results (%) - Democratic Party (Clinton)
1996 Presidential Elections Results (%) - Republican Party (Dole)
1996 Presidential Elections Results (%) - Other
2000 Presidential Elections Results (%) - Democratic Party (Gore)
2000 Presidential Elections Results (%) - Republican Party (Bush)
2000 Presidential Elections Results (%) - Other
2004 Presidential Elections Results (%) - Democratic Party (Kerry)
2004 Presidential Elections Results (%) - Republican Party (Bush)
2004 Presidential Elections Results (%) - Other
2008 Presidential Elections Results (%) - Democratic Party (Obama)
2008 Presidential Elections Results (%) - Republican Party (McCain)
2008 Presidential Elections Results (%) - Other
2012 Presidential Elections Results (%) - Democratic Party (Obama)
2012 Presidential Elections Results (%) - Republican Party (Romney)
2012 Presidential Elections Results (%) - Other
2016 Presidential Elections Results (%) - Democratic Party (Clinton)
2016 Presidential Elections Results (%) - Republican Party (Trump)
2016 Presidential Elections Results (%) - Other
2020 Presidential Elections Results (%) - Democratic Party (Biden)
2020 Presidential Elections Results (%) - Republican Party (Trump)
2020 Presidential Elections Results (%) - Other
Ancestries Reported - Arab (%)
Ancestries Reported - Czech (%)
Ancestries Reported - Danish (%)
Ancestries Reported - Dutch (%)
Ancestries Reported - English (%)
Ancestries Reported - French (%)
Ancestries Reported - French Canadian (%)
Ancestries Reported - German (%)
Ancestries Reported - Greek (%)
Ancestries Reported - Hungarian (%)
Ancestries Reported - Irish (%)
Ancestries Reported - Italian (%)
Ancestries Reported - Lithuanian (%)
Ancestries Reported - Norwegian (%)
Ancestries Reported - Polish (%)
Ancestries Reported - Portuguese (%)
Ancestries Reported - Russian (%)
Ancestries Reported - Scotch-Irish (%)
Ancestries Reported - Scottish (%)
Ancestries Reported - Slovak (%)
Ancestries Reported - Subsaharan African (%)
Ancestries Reported - Swedish (%)
Ancestries Reported - Swiss (%)
Ancestries Reported - Ukrainian (%)
Ancestries Reported - United States (%)
Ancestries Reported - Welsh (%)
Ancestries Reported - West Indian (%)
Ancestries Reported - Other (%)
Educational Attainment - No schooling completed (%)
Educational Attainment - Less than high school (%)
Educational Attainment - High school or equivalent (%)
Educational Attainment - Less than 1 year of college (%)
Educational Attainment - 1 or more years of college (%)
Educational Attainment - Associate degree (%)
Educational Attainment - Bachelor's degree (%)
Educational Attainment - Master's degree (%)
Educational Attainment - Professional school degree (%)
Educational Attainment - Doctorate degree (%)
School Enrollment - Nursery, preschool (%)
School Enrollment - Kindergarten (%)
School Enrollment - Grade 1 to 4 (%)
School Enrollment - Grade 5 to 8 (%)
School Enrollment - Grade 9 to 12 (%)
School Enrollment - College undergrad (%)
School Enrollment - Graduate or professional (%)
School Enrollment - Not enrolled in school (%)
School enrollment - Public schools (%)
School enrollment - Private schools (%)
School enrollment - Not enrolled (%)
Median number of rooms in houses and condos
Median number of rooms in apartments
Housing units lacking complete plumbing facilities (%)
Housing units lacking complete kitchen facilities (%)
Density of houses
Urban houses (%)
Rural houses (%)
Households with people 60 years and over (%)
Households with people 65 years and over (%)
Households with people 75 years and over (%)
Households with one or more nonrelatives (%)
Households with no nonrelatives (%)
Population in households (%)
Family households (%)
Nonfamily households (%)
Population in families (%)
Family households with own children (%)
Median number of bedrooms in owner occupied houses
Mean number of bedrooms in owner occupied houses
Median number of bedrooms in renter occupied houses
Mean number of bedrooms in renter occupied houses
Median number of vehichles in owner occupied houses
Mean number of vehichles in owner occupied houses
Median number of vehichles in renter occupied houses
Mean number of vehichles in renter occupied houses
Mortgage status - with mortgage (%)
Mortgage status - with second mortgage (%)
Mortgage status - with home equity loan (%)
Mortgage status - with both second mortgage and home equity loan (%)
Mortgage status - without a mortgage (%)
Average family size
Average family size - White
Average family size - Black or African American
Average family size - Asian
Average family size - Hispanic or Latino
Average family size - American Indian and Alaska Native
Average family size - Multirace
Average family size - Other Race
Geographical mobility - Same house 1 year ago (%)
Geographical mobility - Moved within same county (%)
Geographical mobility - Moved from different county within same state (%)
Geographical mobility - Moved from different state (%)
Geographical mobility - Moved from abroad (%)
Place of birth - Born in state of residence (%)
Place of birth - Born in other state (%)
Place of birth - Native, outside of US (%)
Place of birth - Foreign born (%)
Housing units in structures - 1, detached (%)
Housing units in structures - 1, attached (%)
Housing units in structures - 2 (%)
Housing units in structures - 3 or 4 (%)
Housing units in structures - 5 to 9 (%)
Housing units in structures - 10 to 19 (%)
Housing units in structures - 20 to 49 (%)
Housing units in structures - 50 or more (%)
Housing units in structures - Mobile home (%)
Housing units in structures - Boat, RV, van, etc. (%)
House/condo owner moved in on average (years ago)
Renter moved in on average (years ago)
Year householder moved into unit - Moved in 1999 to March 2000 (%)
Year householder moved into unit - Moved in 1995 to 1998 (%)
Year householder moved into unit - Moved in 1990 to 1994 (%)
Year householder moved into unit - Moved in 1980 to 1989 (%)
Year householder moved into unit - Moved in 1970 to 1979 (%)
Year householder moved into unit - Moved in 1969 or earlier (%)
Means of transportation to work - Drove car alone (%)
Means of transportation to work - Carpooled (%)
Means of transportation to work - Public transportation (%)
Means of transportation to work - Bus or trolley bus (%)
Means of transportation to work - Streetcar or trolley car (%)
Means of transportation to work - Subway or elevated (%)
Means of transportation to work - Railroad (%)
Means of transportation to work - Ferryboat (%)
Means of transportation to work - Taxicab (%)
Means of transportation to work - Motorcycle (%)
Means of transportation to work - Bicycle (%)
Means of transportation to work - Walked (%)
Means of transportation to work - Other means (%)
Working at home (%)
Industry diversity
Most Common Industries - Agriculture, forestry, fishing and hunting, and mining (%)
Most Common Industries - Agriculture, forestry, fishing and hunting (%)
Most Common Industries - Mining, quarrying, and oil and gas extraction (%)
Most Common Industries - Construction (%)
Most Common Industries - Manufacturing (%)
Most Common Industries - Wholesale trade (%)
Most Common Industries - Retail trade (%)
Most Common Industries - Transportation and warehousing, and utilities (%)
Most Common Industries - Transportation and warehousing (%)
Most Common Industries - Utilities (%)
Most Common Industries - Information (%)
Most Common Industries - Finance and insurance, and real estate and rental and leasing (%)
Most Common Industries - Finance and insurance (%)
Most Common Industries - Real estate and rental and leasing (%)
Most Common Industries - Professional, scientific, and management, and administrative and waste management services (%)
Most Common Industries - Professional, scientific, and technical services (%)
Most Common Industries - Management of companies and enterprises (%)
Most Common Industries - Administrative and support and waste management services (%)
Most Common Industries - Educational services, and health care and social assistance (%)
Most Common Industries - Educational services (%)
Most Common Industries - Health care and social assistance (%)
Most Common Industries - Arts, entertainment, and recreation, and accommodation and food services (%)
Most Common Industries - Arts, entertainment, and recreation (%)
Most Common Industries - Accommodation and food services (%)
Most Common Industries - Other services, except public administration (%)
Most Common Industries - Public administration (%)
Occupation diversity
Most Common Occupations - Management, business, science, and arts occupations (%)
Most Common Occupations - Management, business, and financial occupations (%)
Most Common Occupations - Management occupations (%)
Most Common Occupations - Business and financial operations occupations (%)
Most Common Occupations - Computer, engineering, and science occupations (%)
Most Common Occupations - Computer and mathematical occupations (%)
Most Common Occupations - Architecture and engineering occupations (%)
Most Common Occupations - Life, physical, and social science occupations (%)
Most Common Occupations - Education, legal, community service, arts, and media occupations (%)
Most Common Occupations - Community and social service occupations (%)
Most Common Occupations - Legal occupations (%)
Most Common Occupations - Education, training, and library occupations (%)
Most Common Occupations - Arts, design, entertainment, sports, and media occupations (%)
Most Common Occupations - Healthcare practitioners and technical occupations (%)
Most Common Occupations - Health diagnosing and treating practitioners and other technical occupations (%)
Most Common Occupations - Health technologists and technicians (%)
Most Common Occupations - Service occupations (%)
Most Common Occupations - Healthcare support occupations (%)
Most Common Occupations - Protective service occupations (%)
Most Common Occupations - Fire fighting and prevention, and other protective service workers including supervisors (%)
Most Common Occupations - Law enforcement workers including supervisors (%)
Most Common Occupations - Food preparation and serving related occupations (%)
Most Common Occupations - Building and grounds cleaning and maintenance occupations (%)
Most Common Occupations - Personal care and service occupations (%)
Most Common Occupations - Sales and office occupations (%)
Most Common Occupations - Sales and related occupations (%)
Most Common Occupations - Office and administrative support occupations (%)
Most Common Occupations - Natural resources, construction, and maintenance occupations (%)
Most Common Occupations - Farming, fishing, and forestry occupations (%)
Most Common Occupations - Construction and extraction occupations (%)
Most Common Occupations - Installation, maintenance, and repair occupations (%)
Most Common Occupations - Production, transportation, and material moving occupations (%)
Most Common Occupations - Production occupations (%)
Most Common Occupations - Transportation occupations (%)
Most Common Occupations - Material moving occupations (%)
People in Group quarters - Institutionalized population (%)
People in Group quarters - Correctional institutions (%)
People in Group quarters - Federal prisons and detention centers (%)
People in Group quarters - Halfway houses (%)
People in Group quarters - Local jails and other confinement facilities (including police lockups) (%)
People in Group quarters - Military disciplinary barracks (%)
People in Group quarters - State prisons (%)
People in Group quarters - Other types of correctional institutions (%)
People in Group quarters - Nursing homes (%)
People in Group quarters - Hospitals/wards, hospices, and schools for the handicapped (%)
People in Group quarters - Hospitals/wards and hospices for chronically ill (%)
People in Group quarters - Hospices or homes for chronically ill (%)
People in Group quarters - Military hospitals or wards for chronically ill (%)
People in Group quarters - Other hospitals or wards for chronically ill (%)
People in Group quarters - Hospitals or wards for drug/alcohol abuse (%)
People in Group quarters - Mental (Psychiatric) hospitals or wards (%)
People in Group quarters - Schools, hospitals, or wards for the mentally retarded (%)
People in Group quarters - Schools, hospitals, or wards for the physically handicapped (%)
People in Group quarters - Institutions for the deaf (%)
People in Group quarters - Institutions for the blind (%)
People in Group quarters - Orthopedic wards and institutions for the physically handicapped (%)
People in Group quarters - Wards in general hospitals for patients who have no usual home elsewhere (%)
People in Group quarters - Wards in military hospitals for patients who have no usual home elsewhere (%)
People in Group quarters - Juvenile institutions (%)
People in Group quarters - Long-term care (%)
People in Group quarters - Homes for abused, dependent, and neglected children (%)
People in Group quarters - Residential treatment centers for emotionally disturbed children (%)
People in Group quarters - Training schools for juvenile delinquents (%)
People in Group quarters - Short-term care, detention or diagnostic centers for delinquent children (%)
People in Group quarters - Type of juvenile institution unknown (%)
People in Group quarters - Noninstitutionalized population (%)
People in Group quarters - College dormitories (includes college quarters off campus) (%)
People in Group quarters - Military quarters (%)
People in Group quarters - On base (%)
People in Group quarters - Barracks, unaccompanied personnel housing (UPH), (Enlisted/Officer), ;and similar group living quarters for military personnel (%)
People in Group quarters - Transient quarters for temporary residents (%)
People in Group quarters - Military ships (%)
People in Group quarters - Group homes (%)
People in Group quarters - Homes or halfway houses for drug/alcohol abuse (%)
People in Group quarters - Homes for the mentally ill (%)
People in Group quarters - Homes for the mentally retarded (%)
People in Group quarters - Homes for the physically handicapped (%)
People in Group quarters - Other group homes (%)
People in Group quarters - Religious group quarters (%)
People in Group quarters - Dormitories (%)
People in Group quarters - Agriculture workers' dormitories on farms (%)
People in Group quarters - Job Corps and vocational training facilities (%)
People in Group quarters - Other workers' dormitories (%)
People in Group quarters - Crews of maritime vessels (%)
People in Group quarters - Other nonhousehold living situations (%)
People in Group quarters - Other noninstitutional group quarters (%)
Residents speaking English at home (%)
Residents speaking English at home - Born in the United States (%)
Residents speaking English at home - Native, born elsewhere (%)
Residents speaking English at home - Foreign born (%)
Residents speaking Spanish at home (%)
Residents speaking Spanish at home - Born in the United States (%)
Residents speaking Spanish at home - Native, born elsewhere (%)
Residents speaking Spanish at home - Foreign born (%)
Residents speaking other language at home (%)
Residents speaking other language at home - Born in the United States (%)
Residents speaking other language at home - Native, born elsewhere (%)
Residents speaking other language at home - Foreign born (%)
Class of Workers - Employee of private company (%)
Class of Workers - Self-employed in own incorporated business (%)
Class of Workers - Private not-for-profit wage and salary workers (%)
Class of Workers - Local government workers (%)
Class of Workers - State government workers (%)
Class of Workers - Federal government workers (%)
Class of Workers - Self-employed workers in own not incorporated business and Unpaid family workers (%)
House heating fuel used in houses and condos - Utility gas (%)
House heating fuel used in houses and condos - Bottled, tank, or LP gas (%)
House heating fuel used in houses and condos - Electricity (%)
House heating fuel used in houses and condos - Fuel oil, kerosene, etc. (%)
House heating fuel used in houses and condos - Coal or coke (%)
House heating fuel used in houses and condos - Wood (%)
House heating fuel used in houses and condos - Solar energy (%)
House heating fuel used in houses and condos - Other fuel (%)
House heating fuel used in houses and condos - No fuel used (%)
House heating fuel used in apartments - Utility gas (%)
House heating fuel used in apartments - Bottled, tank, or LP gas (%)
House heating fuel used in apartments - Electricity (%)
House heating fuel used in apartments - Fuel oil, kerosene, etc. (%)
House heating fuel used in apartments - Coal or coke (%)
House heating fuel used in apartments - Wood (%)
House heating fuel used in apartments - Solar energy (%)
House heating fuel used in apartments - Other fuel (%)
House heating fuel used in apartments - No fuel used (%)
Armed forces status - In Armed Forces (%)
Armed forces status - Civilian (%)
Armed forces status - Civilian - Veteran (%)
Armed forces status - Civilian - Nonveteran (%)
Fatal accidents locations in years 2005-2021
Fatal accidents locations in 2005
Fatal accidents locations in 2006
Fatal accidents locations in 2007
Fatal accidents locations in 2008
Fatal accidents locations in 2009
Fatal accidents locations in 2010
Fatal accidents locations in 2011
Fatal accidents locations in 2012
Fatal accidents locations in 2013
Fatal accidents locations in 2014
Fatal accidents locations in 2015
Fatal accidents locations in 2016
Fatal accidents locations in 2017
Fatal accidents locations in 2018
Fatal accidents locations in 2019
Fatal accidents locations in 2020
Fatal accidents locations in 2021
Alcohol use - People drinking some alcohol every month (%)
Alcohol use - People not drinking at all (%)
Alcohol use - Average days/month drinking alcohol
Alcohol use - Average drinks/week
Alcohol use - Average days/year people drink much
Audiometry - Average condition of hearing (%)
Audiometry - People that can hear a whisper from across a quiet room (%)
Audiometry - People that can hear normal voice from across a quiet room (%)
Audiometry - Ears ringing, roaring, buzzing (%)
Audiometry - Had a job exposure to loud noise (%)
Audiometry - Had off-work exposure to loud noise (%)
Blood Pressure & Cholesterol - Has high blood pressure (%)
Blood Pressure & Cholesterol - Checking blood pressure at home (%)
Blood Pressure & Cholesterol - Frequently checking blood cholesterol (%)
Blood Pressure & Cholesterol - Has high cholesterol level (%)
Consumer Behavior - Money monthly spent on food at supermarket/grocery store
Consumer Behavior - Money monthly spent on food at other stores
Consumer Behavior - Money monthly spent on eating out
Consumer Behavior - Money monthly spent on carryout/delivered foods
Consumer Behavior - Income spent on food at supermarket/grocery store (%)
Consumer Behavior - Income spent on food at other stores (%)
Consumer Behavior - Income spent on eating out (%)
Consumer Behavior - Income spent on carryout/delivered foods (%)
Current Health Status - General health condition (%)
Current Health Status - Blood donors (%)
Current Health Status - Has blood ever tested for HIV virus (%)
Current Health Status - Left-handed people (%)
Dermatology - People using sunscreen (%)
Diabetes - Diabetics (%)
Diabetes - Had a blood test for high blood sugar (%)
Diabetes - People taking insulin (%)
Diet Behavior & Nutrition - Diet health (%)
Diet Behavior & Nutrition - Milk product consumption (# of products/month)
Diet Behavior & Nutrition - Meals not home prepared (#/week)
Diet Behavior & Nutrition - Meals from fast food or pizza place (#/week)
Diet Behavior & Nutrition - Ready-to-eat foods (#/month)
Diet Behavior & Nutrition - Frozen meals/pizza (#/month)
Drug Use - People that ever used marijuana or hashish (%)
Drug Use - Ever used hard drugs (%)
Drug Use - Ever used any form of cocaine (%)
Drug Use - Ever used heroin (%)
Drug Use - Ever used methamphetamine (%)
Health Insurance - People covered by health insurance (%)
Kidney Conditions-Urology - Avg. # of times urinating at night
Medical Conditions - People with asthma (%)
Medical Conditions - People with anemia (%)
Medical Conditions - People with psoriasis (%)
Medical Conditions - People with overweight (%)
Medical Conditions - Elderly people having difficulties in thinking or remembering (%)
Medical Conditions - People who ever received blood transfusion (%)
Medical Conditions - People having trouble seeing even with glass/contacts (%)
Medical Conditions - People with arthritis (%)
Medical Conditions - People with gout (%)
Medical Conditions - People with congestive heart failure (%)
Medical Conditions - People with coronary heart disease (%)
Medical Conditions - People with angina pectoris (%)
Medical Conditions - People who ever had heart attack (%)
Medical Conditions - People who ever had stroke (%)
Medical Conditions - People with emphysema (%)
Medical Conditions - People with thyroid problem (%)
Medical Conditions - People with chronic bronchitis (%)
Medical Conditions - People with any liver condition (%)
Medical Conditions - People who ever had cancer or malignancy (%)
Mental Health - People who have little interest in doing things (%)
Mental Health - People feeling down, depressed, or hopeless (%)
Mental Health - People who have trouble sleeping or sleeping too much (%)
Mental Health - People feeling tired or having little energy (%)
Mental Health - People with poor appetite or overeating (%)
Mental Health - People feeling bad about themself (%)
Mental Health - People who have trouble concentrating on things (%)
Mental Health - People moving or speaking slowly or too fast (%)
Mental Health - People having thoughts they would be better off dead (%)
Oral Health - Average years since last visit a dentist
Oral Health - People embarrassed because of mouth (%)
Oral Health - People with gum disease (%)
Oral Health - General health of teeth and gums (%)
Oral Health - Average days a week using dental floss/device
Oral Health - Average days a week using mouthwash for dental problem
Oral Health - Average number of teeth
Pesticide Use - Households using pesticides to control insects (%)
Pesticide Use - Households using pesticides to kill weeds (%)
Physical Activity - People doing vigorous-intensity work activities (%)
Physical Activity - People doing moderate-intensity work activities (%)
Physical Activity - People walking or bicycling (%)
Physical Activity - People doing vigorous-intensity recreational activities (%)
Physical Activity - People doing moderate-intensity recreational activities (%)
Physical Activity - Average hours a day doing sedentary activities
Physical Activity - Average hours a day watching TV or videos
Physical Activity - Average hours a day using computer
Physical Functioning - People having limitations keeping them from working (%)
Physical Functioning - People limited in amount of work they can do (%)
Physical Functioning - People that need special equipment to walk (%)
Physical Functioning - People experiencing confusion/memory problems (%)
Physical Functioning - People requiring special healthcare equipment (%)
Prescription Medications - Average number of prescription medicines taking
Preventive Aspirin Use - Adults 40+ taking low-dose aspirin (%)
Reproductive Health - Vaginal deliveries (%)
Reproductive Health - Cesarean deliveries (%)
Reproductive Health - Deliveries resulted in a live birth (%)
Reproductive Health - Pregnancies resulted in a delivery (%)
Reproductive Health - Women breastfeeding newborns (%)
Reproductive Health - Women that had a hysterectomy (%)
Reproductive Health - Women that had both ovaries removed (%)
Reproductive Health - Women that have ever taken birth control pills (%)
Reproductive Health - Women taking birth control pills (%)
Reproductive Health - Women that have ever used Depo-Provera or injectables (%)
Reproductive Health - Women that have ever used female hormones (%)
Sexual Behavior - People 18+ that ever had sex (vaginal, anal, or oral) (%)
Sexual Behavior - Males 18+ that ever had vaginal sex with a woman (%)
Sexual Behavior - Males 18+ that ever performed oral sex on a woman (%)
Sexual Behavior - Males 18+ that ever had anal sex with a woman (%)
Sexual Behavior - Males 18+ that ever had any sex with a man (%)
Sexual Behavior - Females 18+ that ever had vaginal sex with a man (%)
Sexual Behavior - Females 18+ that ever performed oral sex on a man (%)
Sexual Behavior - Females 18+ that ever had anal sex with a man (%)
Sexual Behavior - Females 18+ that ever had any kind of sex with a woman (%)
Sexual Behavior - Average age people first had sex
Sexual Behavior - Average number of female sex partners in lifetime (males 18+)
Sexual Behavior - Average number of female vaginal sex partners in lifetime (males 18+)
Sexual Behavior - Average age people first performed oral sex on a woman (18+)
Sexual Behavior - Average number of woman performed oral sex on in lifetime (18+)
Sexual Behavior - Average number of male sex partners in lifetime (males 18+)
Sexual Behavior - Average number of male anal sex partners in lifetime (males 18+)
Sexual Behavior - Average age people first performed oral sex on a man (18+)
Sexual Behavior - Average number of male oral sex partners in lifetime (18+)
Sexual Behavior - People using protection when performing oral sex (%)
Sexual Behavior - Average number of times people have vaginal or anal sex a year
Sexual Behavior - People having sex without condom (%)
Sexual Behavior - Average number of male sex partners in lifetime (females 18+)
Sexual Behavior - Average number of male vaginal sex partners in lifetime (females 18+)
Sexual Behavior - Average number of female sex partners in lifetime (females 18+)
Sexual Behavior - Circumcised males 18+ (%)
Sleep Disorders - Average hours sleeping at night
Sleep Disorders - People that has trouble sleeping (%)
Smoking-Cigarette Use - People smoking cigarettes (%)
Taste & Smell - People 40+ having problems with smell (%)
Taste & Smell - People 40+ having problems with taste (%)
Taste & Smell - People 40+ that ever had wisdom teeth removed (%)
Taste & Smell - People 40+ that ever had tonsils teeth removed (%)
Taste & Smell - People 40+ that ever had a loss of consciousness because of a head injury (%)
Taste & Smell - People 40+ that ever had a broken nose or other serious injury to face or skull (%)
Taste & Smell - People 40+ that ever had two or more sinus infections (%)
Weight - Average height (inches)
Weight - Average weight (pounds)
Weight - Average BMI
Weight - People that are obese (%)
Weight - People that ever were obese (%)
Weight - People trying to lose weight (%)
Urban population: 4,252
Rural population: 10,723
Estimated median house/condo value in 2022: $169,521
75143:
$169,521Texas:
$275,400
Median resident age: This zip code:
42.8 yearsTexas median age:
35.6 years
Average household size: This zip code:
2.6 peopleTexas:
2.6 people
Averages for the 2020 tax year for zip code 75143, filed in 2021:
Average Adjusted Gross Income (AGI) in 2020: $54,895 (Individual Income Tax Returns) Here:
$54,895State:
$77,054
Salary/wage: $48,343 (reported on 78.0% of returns )Here:
$48,343State:
$62,766
(% of AGI for various income ranges: 1111.5% for AGIs below $25k , 3395.2% for AGIs $25k-50k , 6235.1% for AGIs $50k-75k , 9195.0% for AGIs $75k-100k , 15827.6% for AGIs $100k-200k , 57268.3% for AGIs over 200k ) Taxable interest for individuals: $2,020 (reported on 19.0% of returns )This zip code:
$2,020Texas:
$2,665
(% of AGI for various income ranges: 10.7% for AGIs below $25k , 18.5% for AGIs $25k-50k , 26.4% for AGIs $50k-75k , 72.5% for AGIs $75k-100k , 123.8% for AGIs $100k-200k , 1856.7% for AGIs over 200k ) Ordinary dividends: $5,837 (reported on 9.4% of returns )(% of AGI for various income ranges: 12.2% for AGIs below $25k , 19.7% for AGIs $25k-50k , 57.6% for AGIs $50k-75k , 67.2% for AGIs $75k-100k , 273.6% for AGIs $100k-200k , 2200.0% for AGIs over 200k ) Net capital gain/loss in AGI: +$23,691 (reported on 10.1% of returns )Here:
+$23,691State:
+$39,590
(% of AGI for various income ranges: 5.2% for AGIs below $25k , 12.3% for AGIs $25k-50k , 80.4% for AGIs $50k-75k , 158.2% for AGIs $75k-100k , 654.0% for AGIs $100k-200k , 19766.7% for AGIs over 200k ) Profit/loss from business: +$11,168 (reported on 20.8% of returns )Here:
+$11,168State:
+$10,888
(% of AGI for various income ranges: 212.5% for AGIs below $25k , 226.8% for AGIs $25k-50k , 269.2% for AGIs $50k-75k , 496.3% for AGIs $75k-100k , 396.4% for AGIs $100k-200k , 4555.0% for AGIs over 200k ) Taxable individual retirement arrangement distribution: $24,406 (reported on 7.4% of returns )75143:
$24,406Texas:
$24,740
(% of AGI for various income ranges: 39.5% for AGIs below $25k , 105.0% for AGIs $25k-50k , 198.9% for AGIs $50k-75k , 338.5% for AGIs $75k-100k , 869.0% for AGIs $100k-200k , 5798.3% for AGIs over 200k ) Total itemized deductions: $35,400 (reported on 4.3% of returns )Here:
$35,400State:
$40,428
(% of AGI for various income ranges: 29.0% for AGIs below $25k , 49.0% for AGIs $25k-50k , 156.4% for AGIs $50k-75k , 261.5% for AGIs $75k-100k , 745.7% for AGIs $100k-200k , 6136.7% for AGIs over 200k ) Charity contributions: $11,913 (reported on 3.4% of returns )Here:
$11,913State:
$18,201
(% of AGI for various income ranges: 12.2% for AGIs $25k-50k , 15.4% for AGIs $50k-75k , 54.0% for AGIs $75k-100k , 228.8% for AGIs $100k-200k , 2125.0% for AGIs over 200k ) Taxes paid: $6,421 (reported on 4.2% of returns )(% of AGI for various income ranges: 4.8% for AGIs below $25k , 7.2% for AGIs $25k-50k , 22.0% for AGIs $50k-75k , 55.5% for AGIs $75k-100k , 149.5% for AGIs $100k-200k , 985.0% for AGIs over 200k ) Earned income credit: $2,521 (reported on 23.2% of returns )(% of AGI for various income ranges: 132.8% for AGIs below $25k , 98.0% for AGIs $25k-50k , 3.0% for AGIs $50k-75k ) Percentage of individuals using paid preparers for their 2020 taxes: 92.1%(% for various income ranges: 91.3% for AGIs below $25k , 92.6% for AGIs $25k-50k , 92.9% for AGIs $50k-75k , 93.0% for AGIs $75k-100k , 92.9% for AGIs $100k-200k , 89.5% for AGIs over 200k )
Averages for the 2012 tax year for zip code 75143, filed in 2013:
Average Adjusted Gross Income (AGI) in 2012: $43,507 (Individual Income Tax Returns) Here:
$43,507State:
$65,384
Salary/wage: $39,128 (reported on 78.2% of returns )Here:
$39,128State:
$52,524
(% of AGI for various income ranges: 68.6% for AGIs below $25k , 77.2% for AGIs $25k-50k , 75.8% for AGIs $50k-75k , 73.3% for AGIs $75k-100k , 69.5% for AGIs $100k-200k , 46.7% for AGIs over 200k ) Taxable interest for individuals: $1,568 (reported on 21.6% of returns )This zip code:
$1,568Texas:
$2,372
(% of AGI for various income ranges: 1.1% for AGIs below $25k , 0.5% for AGIs $25k-50k , 0.7% for AGIs $50k-75k , 0.8% for AGIs $75k-100k , 0.7% for AGIs $100k-200k , 1.1% for AGIs over 200k ) Ordinary dividends: $3,173 (reported on 10.1% of returns )(% of AGI for various income ranges: 1.2% for AGIs below $25k , 0.4% for AGIs $25k-50k , 0.7% for AGIs $50k-75k , 0.4% for AGIs $75k-100k , 0.8% for AGIs $100k-200k , 1.3% for AGIs over 200k ) Net capital gain/loss in AGI: +$9,228 (reported on 9.7% of returns )Here:
+$9,228State:
+$35,319
(% of AGI for various income ranges: 0.1% for AGIs below $25k , 0.1% for AGIs $25k-50k , 0.8% for AGIs $50k-75k , 0.3% for AGIs $75k-100k , 1.0% for AGIs $100k-200k , 14.6% for AGIs over 200k ) Profit/loss from business: +$11,808 (reported on 20.4% of returns )Here:
+$11,808State:
+$13,732
(% of AGI for various income ranges: 13.6% for AGIs below $25k , 3.8% for AGIs $25k-50k , 3.5% for AGIs $50k-75k , 1.8% for AGIs $75k-100k , 4.1% for AGIs $100k-200k , 10.7% for AGIs over 200k ) Taxable individual retirement arrangement distribution: $16,344 (reported on 9.4% of returns )75143:
$16,344Texas:
$19,511
(% of AGI for various income ranges: 3.5% for AGIs below $25k , 3.0% for AGIs $25k-50k , 2.6% for AGIs $50k-75k , 3.8% for AGIs $75k-100k , 6.5% for AGIs $100k-200k ) Total itemized deductions: $20,931 (25% of AGI, reported on 18.7% of returns )Here:
$20,931State:
$24,724
Here:
24.5% of AGIState:
15.9% of AGI
(% of AGI for various income ranges: 6.8% for AGIs below $25k , 8.2% for AGIs $25k-50k , 9.2% for AGIs $50k-75k , 9.6% for AGIs $75k-100k , 10.9% for AGIs $100k-200k , 8.4% for AGIs over 200k ) Charity contributions: $5,001 (reported on 13.0% of returns )(% of AGI for various income ranges: 0.6% for AGIs below $25k , 0.8% for AGIs $25k-50k , 1.4% for AGIs $50k-75k , 1.5% for AGIs $75k-100k , 2.0% for AGIs $100k-200k , 3.2% for AGIs over 200k ) Taxes paid: $4,809 (reported on 18.2% of returns )(% of AGI for various income ranges: 1.3% for AGIs below $25k , 1.3% for AGIs $25k-50k , 2.0% for AGIs $50k-75k , 2.2% for AGIs $75k-100k , 2.9% for AGIs $100k-200k , 2.5% for AGIs over 200k ) Earned income credit: $2,407 (reported on 26.7% of returns )(% of AGI for various income ranges: 9.2% for AGIs below $25k , 1.3% for AGIs $25k-50k ) Percentage of individuals using paid preparers for their 2012 taxes: 56.4%(% for various income ranges: 53.8% for AGIs below $25k , 56.2% for AGIs $25k-50k , 59.7% for AGIs $50k-75k , 59.0% for AGIs $75k-100k , 60.0% for AGIs $100k-200k , 75.0% for AGIs over 200k )
Averages for the 2004 tax year for zip code 75143, filed in 2005:
Average Adjusted Gross Income (AGI) in 2004: $34,564 (Individual Income Tax Returns) Here:
$34,564State:
$47,881
Salary/wage: $33,358 (reported on 79.1% of returns )Here:
$33,358State:
$41,947
(% of AGI for various income ranges: 112.3% for AGIs below $10k , 72.4% for AGIs $10k-25k , 79.8% for AGIs $25k-50k , 80.3% for AGIs $50k-75k , 74.8% for AGIs $75k-100k , 67.3% for AGIs over 100k ) Taxable interest for individuals: $1,949 (reported on 28.2% of returns )This zip code:
$1,949Texas:
$2,255
(% of AGI for various income ranges: 5.0% for AGIs below $10k , 2.0% for AGIs $10k-25k , 1.1% for AGIs $25k-50k , 1.4% for AGIs $50k-75k , 2.1% for AGIs $75k-100k , 1.6% for AGIs over 100k ) Taxable dividends: $2,060 (reported on 13.5% of returns )(% of AGI for various income ranges: 1.6% for AGIs below $10k , 0.8% for AGIs $10k-25k , 0.4% for AGIs $25k-50k , 0.6% for AGIs $50k-75k , 1.2% for AGIs $75k-100k , 1.3% for AGIs over 100k ) Net capital gain/loss: +$6,363 (reported on 12.8% of returns )Here:
+$6,363State:
+$16,110
(% of AGI for various income ranges: -1.2% for AGIs below $10k , 0.5% for AGIs $10k-25k , 0.5% for AGIs $25k-50k , 0.8% for AGIs $50k-75k , 2.3% for AGIs $75k-100k , 8.3% for AGIs over 100k ) Profit/loss from business: +$7,279 (reported on 22.3% of returns )Here:
+$7,279State:
+$11,013
(% of AGI for various income ranges: 17.6% for AGIs below $10k , 10.6% for AGIs $10k-25k , 3.7% for AGIs $25k-50k , 1.8% for AGIs $50k-75k , 4.2% for AGIs $75k-100k , 4.5% for AGIs over 100k ) IRA payment deduction: $3,130 (reported on 1.7% of returns )(% of AGI for various income ranges: 0.1% for AGIs $10k-25k , 0.2% for AGIs $25k-50k , 0.2% for AGIs $50k-75k , 0.2% for AGIs over 100k ) Total itemized deductions: $16,720 (25% of AGI, reported on 18.7% of returns )Here:
$16,720State:
$19,631
Here:
24.7% of AGIState:
18.9% of AGI
(% of AGI for various income ranges: 15.8% for AGIs below $10k , 6.3% for AGIs $10k-25k , 7.8% for AGIs $25k-50k , 10.1% for AGIs $50k-75k , 10.2% for AGIs $75k-100k , 9.9% for AGIs over 100k ) Charity contributions deductions: $3,312 (5% of AGI, reported on 14.1% of returns )Here:
4.6% of AGIState:
4.2% of AGI
(% of AGI for various income ranges: 1.4% for AGIs below $10k , 0.6% for AGIs $10k-25k , 0.8% for AGIs $25k-50k , 1.5% for AGIs $50k-75k , 1.5% for AGIs $75k-100k , 2.2% for AGIs over 100k ) Total tax: $4,721 (reported on 70.6% of returns )(% of AGI for various income ranges: 6.1% for AGIs below $10k , 4.1% for AGIs $10k-25k , 6.3% for AGIs $25k-50k , 8.6% for AGIs $50k-75k , 11.3% for AGIs $75k-100k , 18.1% for AGIs over 100k ) Earned income credit: $1,879 (reported on 24.4% of returns )Percentage of individuals using paid preparers for their 2004 taxes: 65.1%(% for various income ranges: 61.1% for AGIs below $10k , 69.8% for AGIs $10k-25k , 65.0% for AGIs $25k-50k , 64.0% for AGIs $50k-75k , 59.7% for AGIs $75k-100k , 67.1% for AGIs over 100k )
Estimated median household income in 2022: This zip code:
$63,518Texas:
$72,284
Nearest zip codes: 75156 ,
75105 ,
75147 ,
75158 ,
75142 ,
75157 .
Tool Zip Code Map
Percentage of family households: This zip code:
46.3%Texas:
50.5%
Percentage of households with unmarried partners: This zip code:
5.3%Texas:
48.7%
Likely homosexual households (counted as self-reported same-sex unmarried-partner households)
Lesbian couples: 0.1% of all households Gay men: 0.0% of all households
Household received Food Stamps/SNAP in the past 12 months: 837Household did not receive Food Stamps/SNAP in the past 12 months: 4,955
Women who had a birth in the past 12 months: 185 (168 now married , 18 unmarried) Women who did not have a birth in the past 12 months: 2,727 (1,624 now married , 1,090 unmarried)
Housing units in zip code 75143 with a mortgage: 2,139 (123
second mortgage , 30
home equity loan , 97
both second mortgage and home equity loan )
Houses without a mortgage: 54
Median monthly owner costs for units with a mortgage: $1,327
Median monthly owner costs for units without a mortgage: $509
Residents with income below the poverty level in 2022:
This zip code:
13.0%Whole state:
14.0%
Residents with income below 50% of the poverty level in 2022:
This zip code:
8.3%Whole state:
7.4%
Median number of rooms in houses and condos: Median number of rooms in apartments: Notable locations in this zip code not listed on our city pages
Click to draw/clear zip code borders Notable locations in zip code 75143: (A) , Clubhouse Farm (B) , Seven Points Volunteer Fire Department (C) , Kemp Volunteer Fire Department (D) , Tool Volunteer Fire Department (E) , Seven Points Volunteer Fire Department Substation (F) , East Texas Medical Center Emergency Medical Service Kemp (G) . Display/hide their locations on the map
Churches in zip code 75143 include: (A) , Shady Grove Church (B) , Shilo Church (C) , Calvary Church (D) , Flag Lake Church (E) , Gossett Church (F) , Kemp Church of Christ (G) , Millers Church (H) . Display/hide their locations on the map
Cemeteries: (1) , Ware Cemetery (2) , Baker Cemetery (3) , Berry Cemetery (4) , Guthrie Cemetery (5) , King Cemetery (6) . Display/hide their locations on the map
Lakes and reservoirs: (A) , Whitaker Pond (B) , McDougle Lake (C) , Flag Lake (D) , Mud Lake (E) , Twin Lakes (F) , Kemp Lake (G) , Soil Conservation Service Site 71 Reservoir (H) . Display/hide their locations on the map
Creeks: (A) , Humphries Creek (B) , Kings Creek (C) , Cottonwood Creek (D) , Bridge Creek (E) . Display/hide their locations on the map
Parks in zip code 75143 include: (1) , Cedar Creek Wildlife Management Area - Big Island Unit (2) , Cedar Creek Wildlife Management Area - Bird Island Unt (3) . Display/hide their locations on the map
Year house built (houses)
25 2020 or later1,075 2010 to 20191,164 2000 to 2009877 1990 to 19991,360 1980 to 19891,532 1970 to 1979698 1960 to 1969189 1950 to 195960 1940 to 1949213 1939 or earlier
Zip code 75143 household income distribution in 2022 359 Less than $10,000259 $10,000 to $14,999298 $15,000 to $19,999141 $20,000 to $24,999165 $25,000 to $29,999313 $30,000 to $34,999222 $35,000 to $39,999435 $40,000 to $44,999233 $45,000 to $49,999382 $50,000 to $59,999606 $60,000 to $74,999825 $75,000 to $99,999448 $100,000 to $124,999375 $125,000 to $149,999380 $150,000 to $199,999350 $200,000 or moreEstimate of home value of owner-occupied houses/condos in 2022 in zip code 75143 113 Less than $10,0003 $10,000 to $14,9995 $15,000 to $19,999170 $20,000 to $24,99938 $25,000 to $29,99915 $30,000 to $34,99960 $35,000 to $39,99969 $40,000 to $49,999137 $50,000 to $59,999136 $60,000 to $69,999236 $70,000 to $79,999359 $80,000 to $89,999181 $90,000 to $99,999352 $100,000 to $124,999104 $125,000 to $149,999417 $150,000 to $174,999176 $175,000 to $199,999525 $200,000 to $249,999267 $250,000 to $299,999333 $300,000 to $399,999317 $400,000 to $499,999236 $500,000 to $749,999116 $750,000 to $999,999Rent paid by renters in 2022 in zip code 75143 4 Less than $10012 $200 to $2493 $250 to $29961 $300 to $34919 $400 to $44910 $450 to $49933 $500 to $54949 $550 to $599145 $600 to $64923 $650 to $69944 $700 to $74910 $750 to $799125 $800 to $899142 $900 to $999145 $1,000 to $1,24920 $1,250 to $1,49937 $1,500 to $1,99991 No cash rent
Median gross rent in 2022: $1,119.
Median price asked for vacant for-sale houses and condos in 2022: $134,559.
Estimated median house (or condo) value in 2022 for: White Non-Hispanic householders: $200,518Black or African American householders: $113,288American Indian or Alaska Native householders: $175,007Asian householders: $246,875Some other race householders: $226,302Two or more races householders: $109,722Hispanic or Latino householders: $218,073Estimated median house or condo value in 2022: $169,521
75143:
$169,521Texas:
$275,400
Lower value quartile - upper value quartile: $96,259 - $274,193
Housing units in structures:
One, detached: 4,645One, attached: 15Two: 703 or 4: 665 to 9: 5810 to 19: 13120 to 49: 51Mobile homes: 2,263Boats, RVs, vans, etc.: 24Unemployment : 4.9%
Means of transportation to work in zip code 75143 73.7% 4,547 Drove a car alone14.8% 916 Carpooled0.5% 30 Walked0.3% 19 Other means9.4% 581 Worked at homeTravel time to work (commute) in zip code 75143 117 Less than 5 minutes277 5 to 9 minutes395 10 to 14 minutes696 15 to 19 minutes461 20 to 24 minutes183 25 to 29 minutes708 30 to 34 minutes157 35 to 39 minutes173 40 to 44 minutes1,075 45 to 59 minutes773 60 to 89 minutes485 90 or more minutes
Percentage of zip code residents living and working in this county: 43.2%
Household type by relationship:
Households: 14,976
Male householders: 2,857 (594 living alone ), Female householders: 2,930 (781 living alone )3,275 spouses (3,213 opposite-sex spouses ), 263 unmarried partners , (189 opposite-sex unmarried partners ), 3,912 children (3,300 natural , 63 adopted , 552 stepchildren ), 534 grandchildren , 264 brothers or sisters , 287 parents , 35 foster children , 330 other relatives , 181 non-relatives In group quarters: 143 (-1 institutionalized population )
Size of family households: 1,979 2-persons , 968 3-persons , 652 4-persons , 325 5-persons , 98 6-persons , 106 7-or-more-persons
Size of nonfamily households: 1,375 1-person , 278 2-persons , 9 3-persons , 2 5-persons
1,968 married couples with children. single-parent households (265 men , 604 women ).
89.9% of residents of 75143 zip code speak English at home. of residents speak Spanish at home (86% very well, 11% well, 2% not well ).of residents speak other Indo-European language at home (100% very well ).of residents speak Asian or Pacific Island language at home (100% very well ).of residents speak other language at home (100% well ).
Foreign born population: 682 (4.6%)
(37.1%
of them are naturalized citizens )
This zip code:
4.6%Whole state:
17.2%
55% Honduras 5% France 5% Ethiopia 5% Barbados 5% Singapore 4% Sweden 2% Brazil 17% American 14% Irish 12% English 11% German 3% European 1% French 1% Italian
Year of entry for the foreign-born population
191 2010 or later 245 2000 to 2009 137 1990 to 1999 212 Before 1990
Facilities with environmental interests located in this zip code:
A & G ENVIRONMENTAL SERVICES (19753 STATE HWY 274 in KEMP, TX)
TRANSPORTER (Resource Conservation and Recovery Act (tracking hazardous waste)) Organizations: AL AMOS AND GAY IRVIN (CONTACT/OWNER)
Housing units lacking complete plumbing facilities: 2.3%
Housing units lacking complete kitchen facilities: 2.8%
83.7% Electricity 10.0% Bottled, tank, or LP gas 4.7% Utility gas 1.0% No fuel used
Population in 1990: 5,268. Population change in the 1990s: +7,740 (+146.9%).
Place of birth for U.S.-born residents:
This state: 10,658Northeast: 618Midwest: 897South: 1,219West: 712
55% of the 75143 zip code residents lived in the same house 5 years ago.
Out of people who lived in different houses, 28% lived in this county.
Out of people who lived in different counties, 50% lived in Texas.
87% of the 75143 zip code residents lived in the same house 1 year ago.
Out of people who lived in different houses, 35% moved from this county.
Out of people who lived in different houses, 52% moved from different county within same state.
Out of people who lived in different houses, 14% moved from different state.
Private vs. public school enrollment:
Students in private schools in grades 1 to 8 (elementary and middle school): 483
Students in private schools in grades 9 to 12 (high school): 108
Students in private undergraduate colleges: 105
Occupation by median earnings in the past 12 months ($)
109,325 Legal occupations 103,577 Management occupations 84,723 Architecture and engineering occupations 82,195 Business and financial operations occupations 65,849 Computer and mathematical occupations 60,637 Health diagnosing and treating practitioners and other technical occupations
Companies with federal contracts located in this zip code (KEMP, TX):
THORNTON, JESSE F (423 NORTH 7 POINTS DR; small business) in 10 contracts from 2004 to 2006
Contracts for Other Housekeeping Services by ArmySigned by year: 2000: $0; 2001: $0; 2002: $0; 2003: $0; 2004: $79,200; 2005: $43,200; 2006: $47,750.
Biggest contracts: with Army for Other Housekeeping Services. Signed on 2004-10-01. Completion date: 2005-09-30.
, same as above. Signed on 2005-03-28. Completion date: 2005-09-30.
, same as above. Signed on 2006-04-05. Completion date: 2005-10-31.
, same as above. Signed on 2006-05-18. Effective on 2006-05-16. Completion date: 2006-09-30.
RIDDLE, DANETTE (12830 COUNTY ROAD 2141; small business)
$38,790 with Army for Medical and Surgical Instruments, Equipment, and Supplies. Signed on 2000-07-26. Completion date: 2000-08-18.
ERNEST B SHOTWELL (18575 COUNTY ROAD 4069; small business) in 8 contracts from 2004 to 2006
Contracts for Recreation Site Maintenance Services (non-construction), Guard Services, Recreational Services by Army, U.S. Army Corps of Engineers - civil program financing onlySigned by year: 2000: $0; 2001: $0; 2002: $0; 2003: $0; 2004: $6,540; 2005: $21,930; 2006: $9,430.
Biggest contracts: with Army for Recreation Site Maintenance Services (non-construction). Signed on 2005-02-15. Completion date: 2005-11-11.
with U.S. Army Corps of Engineers - civil program financing only for Recreation Site Maintenance Services (non-construction). Signed on 2005-02-15. Completion date: 2005-11-11.
with Army for Recreation Site Maintenance Services (non-construction). Signed on 2006-02-15. Completion date: 2006-09-30.
with Army for Guard Services. Signed on 2004-04-27. Completion date: 2004-09-30.
J BOB ENTERPRISES (11834 SOUTHVIEW DR; small business) in 3 contracts in 2004
$11,190 with Army for Insect and Rodent Control Services. Signed on 2004-01-14. Completion date: 2004-09-30.
with Army for Recreation Site Maintenance Services (non-construction). Signed on 2004-10-01. Completion date: 2005-09-30.
with U.S. Army Corps of Engineers - civil program financing only for Recreation Site Maintenance Services (non-construction). Signed on 2004-10-01. Completion date: 2005-09-30.
MANN, CAROLYN (17992 FM 2613; small business) in 2 contracts from 2003 to 2004
$8,125 with Army for Guard Services. Signed on 2004-02-25. Completion date: 2004-08-13.
with Army for Landscaping/Groundskeeping Services. Signed on 2003-10-14. Completion date: 2003-10-01.
WASHCODE SYSTEMS (5327 CEDAR CREEK; small business)
$3,650 with Army for Cameras, Motion Picture. Signed on 2003-03-17. Completion date: 2003-03-21.
Top industries in this zip code by the number of employees in 2005:
Health Care and Social Assistance: Home Health Care Services (100-249 employees: 1 establishment, 10-19 employees: 1 establishment, 1-4 employees: 1 establishment)Accommodation and Food Services: Full-Service Restaurants (50-99: 1, 10-19: 3, 5-9: 3, 1-4: 1)Construction: Plumbing, Heating, and Air-Conditioning Contractors (50-99: 1, 10-19: 2, 5-9: 1)Health Care and Social Assistance: Nursing Care Facilities (50-99: 1)Accommodation and Food Services: Limited-Service Restaurants (20-49: 1, 10-19: 2, 5-9: 1)Arts, Entertainment, and Recreation: Golf Courses and Country Clubs (20-49: 1, 10-19: 1, 5-9: 1)Other Services (except Public Administration): Religious Organizations (10-19: 2, 5-9: 1, 1-4: 8)Other Services (except Public Administration): Civic and Social Organizations (10-19: 3, 5-9: 1)
People in group quarters in 2010:
49 people in nursing facilities/skilled-nursing facilities
People in group quarters in 2000:
45 people in nursing homes
Fatal accident statistics in 2014:
Fatal accident count: 6Vehicles involved in fatal accidents: 9Fatal accidents caused by drunken drivers: 2Fatalities: 7Persons involved in fatal accidents: 10Pedestrians involved in fatal accidents: 0
Fatal accident statistics in 2013:
Fatal accident count: 3Vehicles involved in fatal accidents: 5Fatal accidents caused by drunken drivers: 1Fatalities: 3Persons involved in fatal accidents: 7Pedestrians involved in fatal accidents: 0
Home Mortgage Disclosure Act Aggregated Statistics For Year 2009(Based on 6 partial tracts) A) FHA, FSA/RHS & VA B) Conventional C) Refinancings D) Home Improvement Loans F) Non-occupant Loans on G) Loans On Manufactured Number Average Value Number Average Value Number Average Value Number Average Value Number Average Value Number Average Value
LOANS ORIGINATED 51 $107,660 49 $149,345 110 $154,878 35 $23,281 28 $161,325 19 $58,134 APPLICATIONS APPROVED, NOT ACCEPTED 3 $87,940 7 $98,994 17 $103,391 4 $60,630 1 $158,550 6 $77,603 APPLICATIONS DENIED 21 $102,444 41 $81,318 79 $146,889 43 $25,543 5 $420,276 27 $47,741 APPLICATIONS WITHDRAWN 11 $107,197 20 $130,124 44 $131,871 13 $50,531 4 $113,345 17 $79,831 FILES CLOSED FOR INCOMPLETENESS 1 $101,760 4 $140,940 11 $123,986 3 $67,943 2 $171,565 2 $51,635
Aggregated Statistics For Year 2008(Based on 6 partial tracts) A) FHA, FSA/RHS & VA B) Conventional C) Refinancings D) Home Improvement Loans E) Loans on Dwellings For 5+ Families F) Non-occupant Loans on G) Loans On Manufactured Number Average Value Number Average Value Number Average Value Number Average Value Number Average Value Number Average Value Number Average Value
LOANS ORIGINATED 54 $116,562 78 $165,037 83 $120,847 49 $30,512 5 $98,268 43 $114,415 29 $63,152 APPLICATIONS APPROVED, NOT ACCEPTED 4 $130,225 14 $84,674 11 $82,012 7 $25,130 0 $0 2 $28,305 11 $53,750 APPLICATIONS DENIED 6 $107,615 36 $67,926 75 $117,173 54 $33,953 0 $0 6 $78,892 21 $52,315 APPLICATIONS WITHDRAWN 7 $128,907 20 $90,802 43 $123,912 9 $57,847 0 $0 6 $86,667 6 $59,723 FILES CLOSED FOR INCOMPLETENESS 0 $0 4 $61,070 8 $132,820 1 $15,180 0 $0 2 $44,185 2 $54,620
Aggregated Statistics For Year 2007(Based on 6 partial tracts) A) FHA, FSA/RHS & VA B) Conventional C) Refinancings D) Home Improvement Loans F) Non-occupant Loans on G) Loans On Manufactured Number Average Value Number Average Value Number Average Value Number Average Value Number Average Value Number Average Value
LOANS ORIGINATED 36 $114,009 168 $113,488 122 $110,241 55 $22,255 48 $102,647 40 $71,468 APPLICATIONS APPROVED, NOT ACCEPTED 3 $79,160 27 $89,227 17 $135,582 9 $75,208 1 $164,280 14 $53,336 APPLICATIONS DENIED 8 $127,611 75 $120,007 141 $121,333 64 $37,750 14 $59,863 39 $61,478 APPLICATIONS WITHDRAWN 3 $124,947 30 $87,121 77 $109,197 10 $45,874 9 $44,097 2 $90,160 FILES CLOSED FOR INCOMPLETENESS 2 $88,150 7 $152,453 25 $146,896 3 $57,747 0 $0 2 $77,910
Aggregated Statistics For Year 2006(Based on 6 partial tracts) A) FHA, FSA/RHS & VA B) Conventional C) Refinancings D) Home Improvement Loans E) Loans on Dwellings For 5+ Families F) Non-occupant Loans on G) Loans On Manufactured Number Average Value Number Average Value Number Average Value Number Average Value Number Average Value Number Average Value Number Average Value
LOANS ORIGINATED 60 $94,787 198 $88,056 121 $99,848 61 $29,960 1 $945,090 50 $70,863 67 $66,964 APPLICATIONS APPROVED, NOT ACCEPTED 3 $74,813 38 $74,026 22 $110,616 11 $40,604 0 $0 6 $84,010 9 $54,611 APPLICATIONS DENIED 9 $75,009 109 $72,435 127 $95,070 64 $29,371 0 $0 27 $53,193 57 $53,824 APPLICATIONS WITHDRAWN 11 $83,939 41 $91,920 97 $98,438 9 $93,628 0 $0 4 $56,202 13 $70,308 FILES CLOSED FOR INCOMPLETENESS 0 $0 4 $94,760 22 $125,377 2 $50,915 0 $0 0 $0 2 $134,885
Aggregated Statistics For Year 2005(Based on 6 partial tracts) A) FHA, FSA/RHS & VA B) Conventional C) Refinancings D) Home Improvement Loans F) Non-occupant Loans on G) Loans On Manufactured Number Average Value Number Average Value Number Average Value Number Average Value Number Average Value Number Average Value
LOANS ORIGINATED 50 $107,045 193 $91,588 125 $97,474 54 $31,761 46 $76,972 54 $77,606 APPLICATIONS APPROVED, NOT ACCEPTED 4 $71,012 47 $68,905 32 $95,565 3 $33,977 1 $38,320 33 $49,373 APPLICATIONS DENIED 6 $99,362 103 $71,698 162 $84,194 53 $26,667 18 $97,104 49 $49,083 APPLICATIONS WITHDRAWN 6 $125,192 35 $105,617 91 $111,092 14 $86,003 10 $72,424 5 $99,956 FILES CLOSED FOR INCOMPLETENESS 1 $127,480 17 $84,496 43 $107,575 0 $0 4 $67,315 0 $0
Aggregated Statistics For Year 2004(Based on 6 partial tracts) A) FHA, FSA/RHS & VA B) Conventional C) Refinancings D) Home Improvement Loans E) Loans on Dwellings For 5+ Families F) Non-occupant Loans on G) Loans On Manufactured Number Average Value Number Average Value Number Average Value Number Average Value Number Average Value Number Average Value Number Average Value
LOANS ORIGINATED 41 $98,456 158 $101,396 192 $91,155 60 $35,738 2 $502,875 46 $98,898 50 $77,815 APPLICATIONS APPROVED, NOT ACCEPTED 6 $91,303 28 $89,030 38 $76,461 9 $47,144 0 $0 6 $112,812 20 $43,266 APPLICATIONS DENIED 14 $87,797 85 $79,806 190 $90,259 54 $24,009 0 $0 15 $106,827 55 $60,230 APPLICATIONS WITHDRAWN 5 $63,234 27 $105,456 94 $88,854 8 $23,354 0 $0 6 $80,617 4 $44,708 FILES CLOSED FOR INCOMPLETENESS 1 $68,630 4 $97,872 37 $104,548 2 $104,635 0 $0 1 $127,790 0 $0
Aggregated Statistics For Year 2003(Based on 10 partial tracts) A) FHA, FSA/RHS & VA B) Conventional C) Refinancings D) Home Improvement Loans F) Non-occupant Loans on Number Average Value Number Average Value Number Average Value Number Average Value Number Average Value
LOANS ORIGINATED 53 $96,091 341 $96,641 621 $110,375 89 $19,949 210 $133,807 APPLICATIONS APPROVED, NOT ACCEPTED 7 $78,526 52 $72,247 100 $80,710 5 $15,338 17 $83,462 APPLICATIONS DENIED 15 $90,603 153 $60,855 409 $82,346 88 $16,301 29 $111,511 APPLICATIONS WITHDRAWN 19 $81,796 34 $82,927 249 $90,412 8 $29,380 19 $84,412 FILES CLOSED FOR INCOMPLETENESS 2 $87,440 2 $162,730 24 $109,597 6 $36,355 2 $184,950
Aggregated Statistics For Year 2002(Based on 6 partial tracts) A) FHA, FSA/RHS & VA B) Conventional C) Refinancings D) Home Improvement Loans F) Non-occupant Loans on Number Average Value Number Average Value Number Average Value Number Average Value Number Average Value
LOANS ORIGINATED 31 $104,227 212 $108,655 225 $114,621 43 $25,196 127 $159,076 APPLICATIONS APPROVED, NOT ACCEPTED 3 $56,400 27 $77,940 43 $93,934 9 $14,416 5 $123,768 APPLICATIONS DENIED 7 $72,511 117 $59,136 101 $87,366 29 $17,082 19 $42,557 APPLICATIONS WITHDRAWN 3 $77,930 21 $75,685 56 $77,578 4 $5,568 12 $107,675 FILES CLOSED FOR INCOMPLETENESS 0 $0 5 $56,408 23 $74,209 0 $0 3 $39,743
Aggregated Statistics For Year 2001(Based on 6 partial tracts) A) FHA, FSA/RHS & VA B) Conventional C) Refinancings D) Home Improvement Loans F) Non-occupant Loans on Number Average Value Number Average Value Number Average Value Number Average Value Number Average Value
LOANS ORIGINATED 38 $90,435 196 $90,148 150 $107,374 55 $10,861 75 $112,892 APPLICATIONS APPROVED, NOT ACCEPTED 1 $113,820 39 $73,656 30 $85,094 7 $38,751 4 $210,375 APPLICATIONS DENIED 6 $57,745 174 $44,379 86 $62,205 35 $17,546 18 $27,748 APPLICATIONS WITHDRAWN 2 $168,860 26 $87,572 52 $91,145 15 $12,421 4 $127,212 FILES CLOSED FOR INCOMPLETENESS 0 $0 4 $53,215 9 $77,350 0 $0 0 $0
Aggregated Statistics For Year 2000(Based on 6 partial tracts) A) FHA, FSA/RHS & VA B) Conventional C) Refinancings D) Home Improvement Loans F) Non-occupant Loans on Number Average Value Number Average Value Number Average Value Number Average Value Number Average Value
LOANS ORIGINATED 17 $71,891 192 $73,529 46 $74,956 84 $9,954 63 $78,818 APPLICATIONS APPROVED, NOT ACCEPTED 4 $76,932 33 $66,022 16 $94,174 10 $16,438 5 $114,348 APPLICATIONS DENIED 4 $83,440 139 $43,289 36 $41,474 38 $16,889 10 $37,481 APPLICATIONS WITHDRAWN 3 $94,167 24 $76,741 30 $69,400 8 $10,864 9 $81,119 FILES CLOSED FOR INCOMPLETENESS 0 $0 8 $62,585 12 $101,817 0 $0 5 $71,536
Aggregated Statistics For Year 1999(Based on 6 partial tracts) A) FHA, FSA/RHS & VA B) Conventional C) Refinancings D) Home Improvement Loans F) Non-occupant Loans on Number Average Value Number Average Value Number Average Value Number Average Value Number Average Value
LOANS ORIGINATED 18 $71,093 214 $64,213 77 $72,906 59 $13,581 54 $71,144 APPLICATIONS APPROVED, NOT ACCEPTED 0 $0 57 $50,584 34 $51,946 9 $26,550 5 $69,766 APPLICATIONS DENIED 2 $75,650 248 $47,482 34 $46,834 39 $11,753 14 $57,371 APPLICATIONS WITHDRAWN 3 $68,353 24 $72,881 32 $64,991 8 $23,530 2 $54,295 FILES CLOSED FOR INCOMPLETENESS 0 $0 4 $81,592 13 $58,503 1 $41,790 1 $46,470
Detailed HMDA statistics for the following Tracts:
0512.00
,
0513.00 ,
9507.00 ,
9508.00
Private Mortgage Insurance Companies Aggregated Statistics For Year 2009(Based on 6 partial tracts) A) Conventional B) Refinancings C) Non-occupant Loans on Number Average Value Number Average Value Number Average Value
LOANS ORIGINATED 7 $238,637 3 $178,453 0 $0 APPLICATIONS APPROVED, NOT ACCEPTED 4 $168,902 1 $110,780 0 $0 APPLICATIONS DENIED 1 $70,990 0 $0 1 $70,990 APPLICATIONS WITHDRAWN 0 $0 0 $0 0 $0 FILES CLOSED FOR INCOMPLETENESS 0 $0 1 $125,420 0 $0
Aggregated Statistics For Year 2008(Based on 6 partial tracts) A) Conventional B) Refinancings C) Non-occupant Loans on Number Average Value Number Average Value Number Average Value
LOANS ORIGINATED 14 $153,733 4 $219,298 1 $42,600 APPLICATIONS APPROVED, NOT ACCEPTED 3 $211,213 2 $125,420 0 $0 APPLICATIONS DENIED 1 $62,710 0 $0 0 $0 APPLICATIONS WITHDRAWN 2 $118,065 0 $0 0 $0 FILES CLOSED FOR INCOMPLETENESS 0 $0 1 $125,420 0 $0
Aggregated Statistics For Year 2007(Based on 6 partial tracts) A) Conventional B) Refinancings C) Non-occupant Loans on D) Loans On Manufactured Number Average Value Number Average Value Number Average Value Number Average Value
LOANS ORIGINATED 43 $121,768 5 $111,834 3 $110,943 1 $78,090 APPLICATIONS APPROVED, NOT ACCEPTED 7 $113,969 2 $410,020 2 $78,685 0 $0 APPLICATIONS DENIED 0 $0 0 $0 0 $0 0 $0 APPLICATIONS WITHDRAWN 3 $120,017 0 $0 0 $0 0 $0 FILES CLOSED FOR INCOMPLETENESS 0 $0 0 $0 0 $0 0 $0
Aggregated Statistics For Year 2006(Based on 6 partial tracts) A) Conventional B) Refinancings C) Non-occupant Loans on D) Loans On Manufactured Number Average Value Number Average Value Number Average Value Number Average Value
LOANS ORIGINATED 23 $98,870 2 $163,920 4 $71,132 2 $94,560 APPLICATIONS APPROVED, NOT ACCEPTED 2 $89,330 2 $172,345 0 $0 0 $0 APPLICATIONS DENIED 0 $0 0 $0 0 $0 0 $0 APPLICATIONS WITHDRAWN 2 $153,015 0 $0 0 $0 0 $0 FILES CLOSED FOR INCOMPLETENESS 0 $0 0 $0 0 $0 0 $0
Aggregated Statistics For Year 2005(Based on 6 partial tracts) A) Conventional B) Refinancings C) Non-occupant Loans on D) Loans On Manufactured Number Average Value Number Average Value Number Average Value Number Average Value
LOANS ORIGINATED 31 $110,283 10 $134,024 8 $104,121 1 $115,950 APPLICATIONS APPROVED, NOT ACCEPTED 5 $62,290 1 $162,380 0 $0 0 $0 APPLICATIONS DENIED 0 $0 0 $0 0 $0 0 $0 APPLICATIONS WITHDRAWN 2 $178,070 0 $0 0 $0 0 $0 FILES CLOSED FOR INCOMPLETENESS 0 $0 0 $0 0 $0 0 $0
Aggregated Statistics For Year 2004(Based on 6 partial tracts) A) Conventional B) Refinancings C) Non-occupant Loans on D) Loans On Manufactured Number Average Value Number Average Value Number Average Value Number Average Value
LOANS ORIGINATED 38 $109,824 8 $108,675 4 $78,090 2 $73,535 APPLICATIONS APPROVED, NOT ACCEPTED 6 $117,262 4 $117,948 0 $0 0 $0 APPLICATIONS DENIED 5 $81,640 0 $0 0 $0 0 $0 APPLICATIONS WITHDRAWN 5 $99,568 2 $156,110 0 $0 1 $153,820 FILES CLOSED FOR INCOMPLETENESS 0 $0 0 $0 0 $0 0 $0
Aggregated Statistics For Year 2003(Based on 10 partial tracts) A) Conventional B) Refinancings C) Non-occupant Loans on Number Average Value Number Average Value Number Average Value
LOANS ORIGINATED 83 $107,451 38 $125,823 21 $108,266 APPLICATIONS APPROVED, NOT ACCEPTED 10 $136,145 12 $127,915 1 $167,940 APPLICATIONS DENIED 1 $73,360 1 $189,740 1 $73,360 APPLICATIONS WITHDRAWN 4 $173,905 3 $77,940 1 $160,250 FILES CLOSED FOR INCOMPLETENESS 2 $90,835 0 $0 0 $0
Aggregated Statistics For Year 2002(Based on 6 partial tracts) A) Conventional B) Refinancings C) Non-occupant Loans on Number Average Value Number Average Value Number Average Value
LOANS ORIGINATED 35 $103,946 13 $159,296 15 $125,952 APPLICATIONS APPROVED, NOT ACCEPTED 6 $117,907 4 $190,195 0 $0 APPLICATIONS DENIED 0 $0 1 $75,500 0 $0 APPLICATIONS WITHDRAWN 3 $134,057 0 $0 1 $105,120 FILES CLOSED FOR INCOMPLETENESS 0 $0 2 $97,145 0 $0
Aggregated Statistics For Year 2001(Based on 6 partial tracts) A) Conventional B) Refinancings C) Non-occupant Loans on Number Average Value Number Average Value Number Average Value
LOANS ORIGINATED 56 $86,541 6 $158,550 12 $94,009 APPLICATIONS APPROVED, NOT ACCEPTED 7 $60,697 4 $85,385 2 $55,110 APPLICATIONS DENIED 3 $63,247 0 $0 1 $103,840 APPLICATIONS WITHDRAWN 4 $74,728 0 $0 0 $0 FILES CLOSED FOR INCOMPLETENESS 0 $0 0 $0 0 $0
Aggregated Statistics For Year 2000(Based on 6 partial tracts) A) Conventional B) Refinancings C) Non-occupant Loans on Number Average Value Number Average Value Number Average Value
LOANS ORIGINATED 23 $94,333 5 $139,790 6 $99,792 APPLICATIONS APPROVED, NOT ACCEPTED 7 $81,533 0 $0 0 $0 APPLICATIONS DENIED 2 $68,845 1 $103,200 0 $0 APPLICATIONS WITHDRAWN 0 $0 0 $0 0 $0 FILES CLOSED FOR INCOMPLETENESS 0 $0 0 $0 0 $0
Aggregated Statistics For Year 1999(Based on 5 partial tracts) A) Conventional B) Refinancings C) Non-occupant Loans on Number Average Value Number Average Value Number Average Value
LOANS ORIGINATED 22 $97,041 6 $94,127 5 $106,776 APPLICATIONS APPROVED, NOT ACCEPTED 2 $99,860 1 $53,750 0 $0 APPLICATIONS DENIED 4 $82,098 0 $0 0 $0 APPLICATIONS WITHDRAWN 1 $137,090 0 $0 1 $89,590 FILES CLOSED FOR INCOMPLETENESS 1 $72,180 0 $0 0 $0
Detailed PMIC statistics for the following Tracts:
0512.00
,
0513.00 ,
9507.00 ,
9508.00
2002 - 2018 National Fire Incident Reporting System (NFIRS) incidents See full 2006 National Fire Incident Reporting System statistics for zip code 75143, Texas
Most common first names in zip code 75143 among deceased individuals Name Count Lived (average)
James 135 71.9 years William 94 72.3 years Robert 75 72.1 years John 75 74.9 years Mary 71 79.9 years Charles 56 70.5 years George 45 72.0 years Dorothy 36 77.0 years Willie 27 75.3 years Roy 25 74.1 years
Most common last names in zip code 75143 among deceased individuals Last name Count Lived (average)
Smith 49 76.4 years Johnson 41 75.6 years Jones 40 77.0 years Williams 36 76.7 years Brown 29 71.4 years Davis 25 72.5 years Miller 24 72.1 years Thompson 21 78.2 years Wilson 20 74.3 years Taylor 19 66.2 years
Businesses in zip code 75143
Name Count Name Count
Dairy Queen 1 Subway 2 H&R Block 1 U-Haul 2 SONIC Drive-In 2

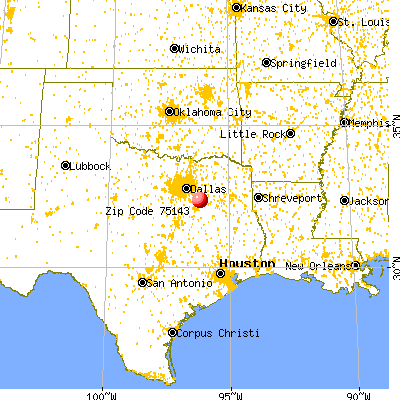


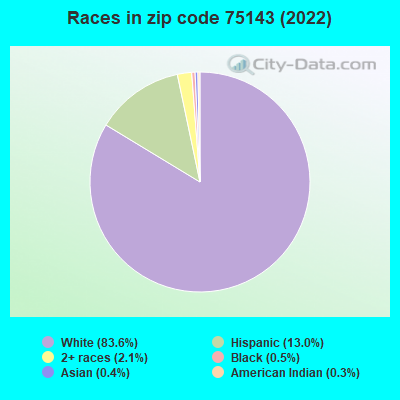


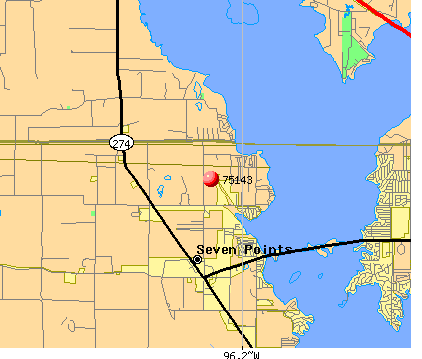 Nearest zip codes: 75156, 75105, 75147, 75158, 75142, 75157.
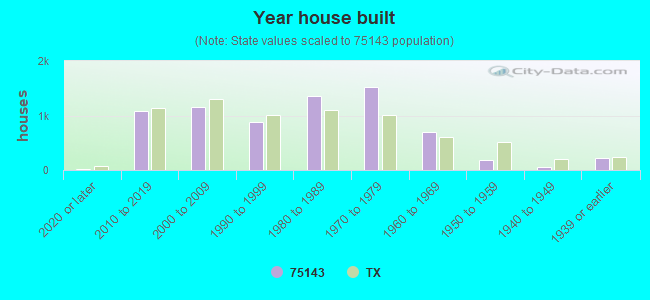


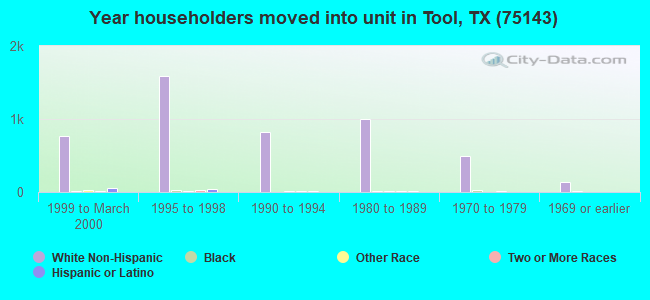
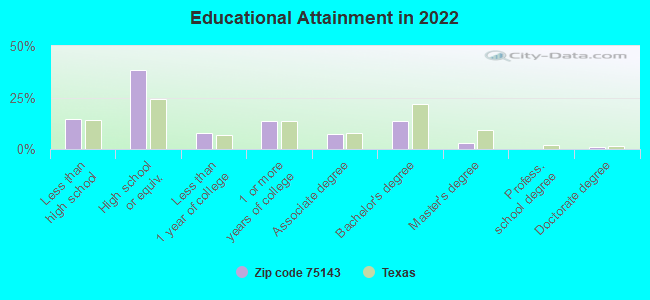
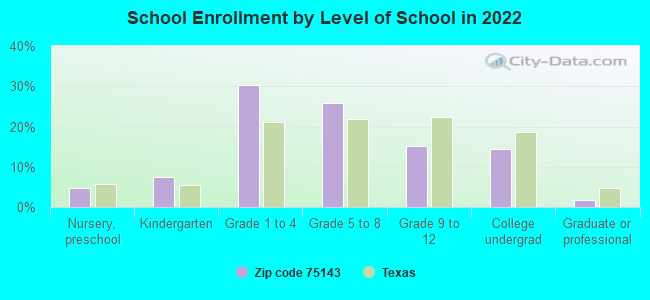
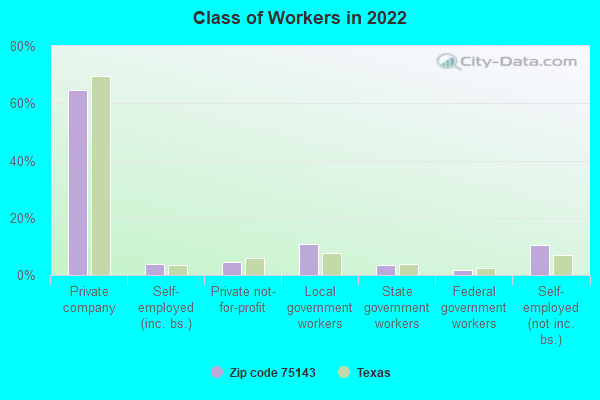
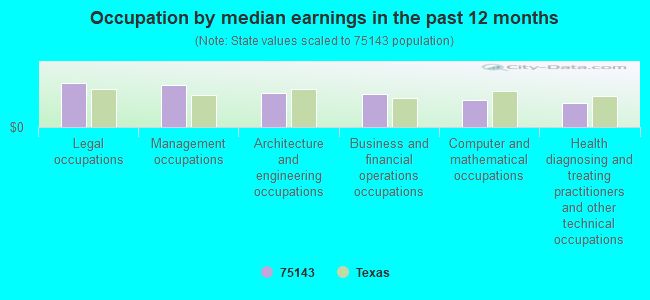
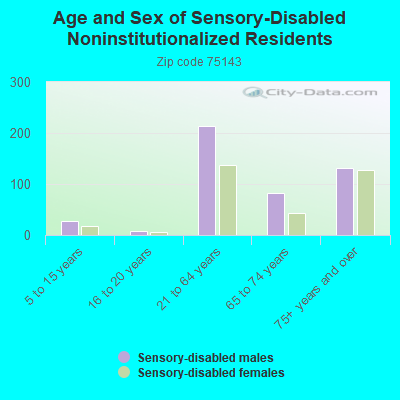
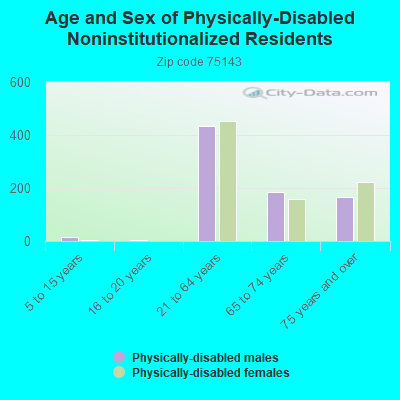


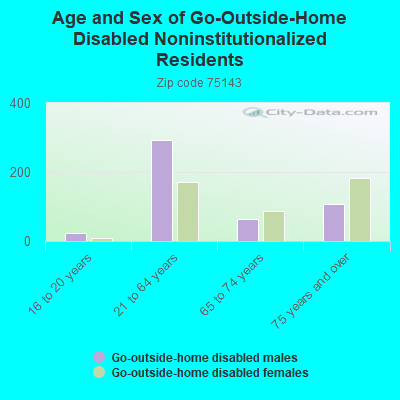
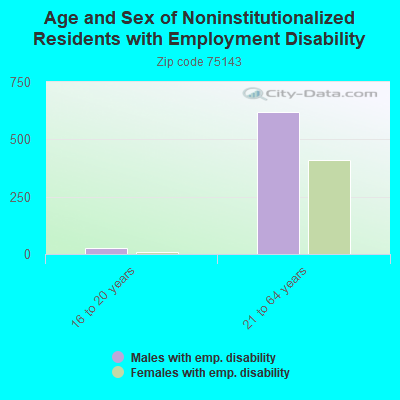
 According to the data from the years 2002 - 2018 the average number of fire incidents per year is 165. The highest number of reported fire incidents - 262 took place in 2018, and the least - 73 in 2007. The data has a growing trend.
 When looking into fire subcategories, the most reports belonged to: Outside Fires (55.8%), and Structure Fires (32.2%).