Estimated zip code population in 2022: 2,608 Zip code population in 2010: 2,285 Zip code population in 2000: 2,614
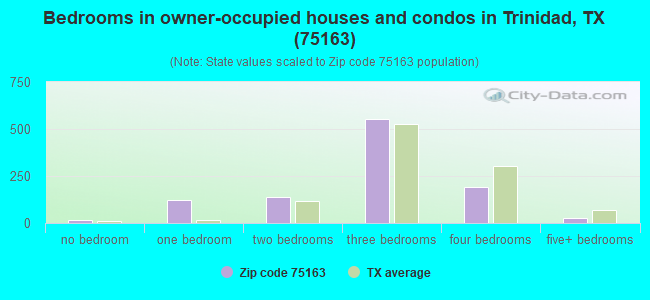
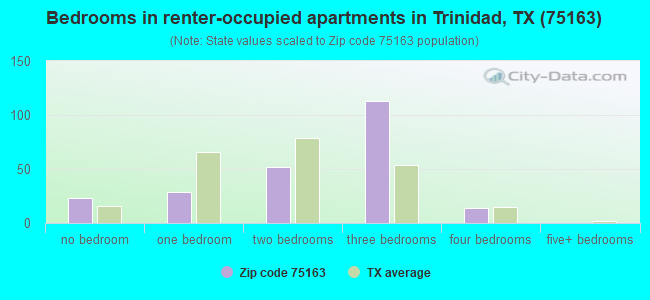
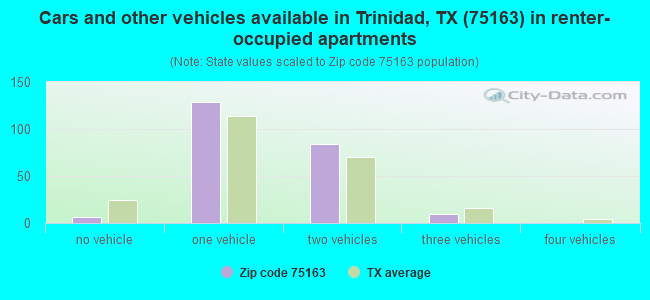
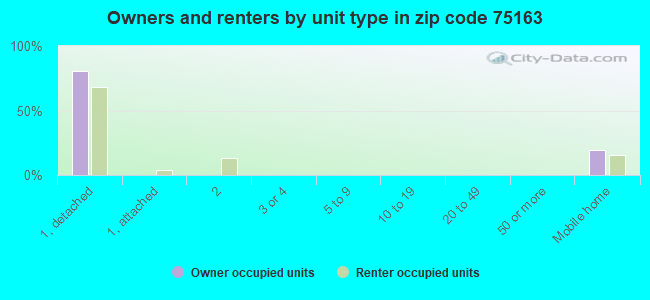
Houses and condos: 1,653 Renter-occupied apartments: 229
% of renters here:
18%
State:
38%
March 2022 cost of living index in zip code 75163: 84.7 (less than average, U.S. average is 100)
Land area: 33.8 sq. mi. Water area: 6.0 sq. mi.
Population density: 77 people per square mile
(very low).
OSM Map
General Map
Google Map
MSN Map
OSM Map
General Map
Google Map
MSN Map
OSM Map
General Map
Google Map
MSN Map
OSM Map
General Map
Google Map
MSN Map
Please wait while loading the map...
Real estate property taxes paid for housing units in 2022:
This zip code:
0.8% ($1,686)
Texas:
1.5% ($4,050)
Median real estate property taxes paid for housing units with mortgages in 2022: $4,955 (1.1%) Median real estate property taxes paid for housing units with no mortgage in 2022: $911 (0.5%)
Business Search- 14 Million verified businesses
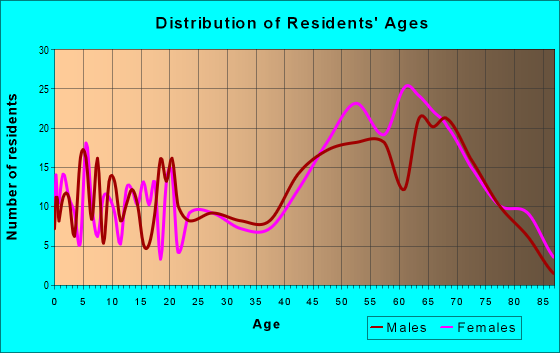
Males: 1,331
(51.0%)
Females: 1,277
(49.0%)
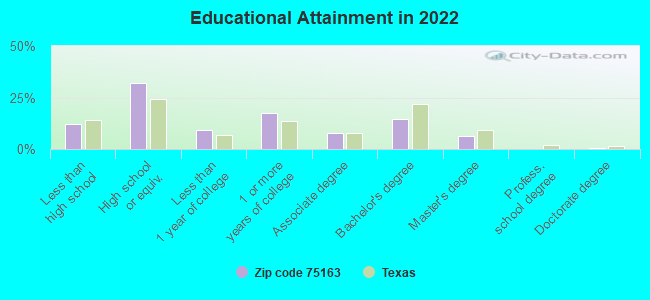
For population 25 years and over in 75163:
High school or higher: 86.4%
Bachelor's degree or higher: 20.7%
Graduate or professional degree: 6.5%
Unemployed: 14.3%
Mean travel time to work (commute): 42.1 minutes
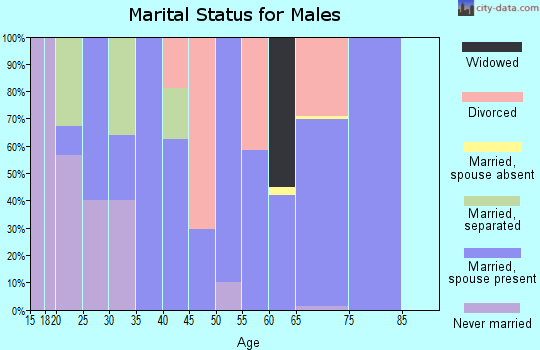
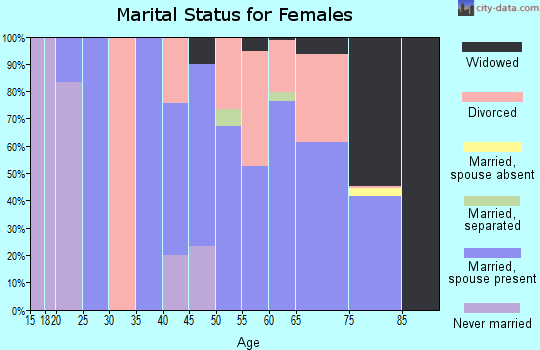
For population 15 years and over in 75163:
Never married: 15.4%
Now married: 58.6%
Separated: 5.4%
Widowed: 9.8%
Divorced: 10.8%
Zip code 75163 compared to state average:
Unemployed percentage significantly above state average.
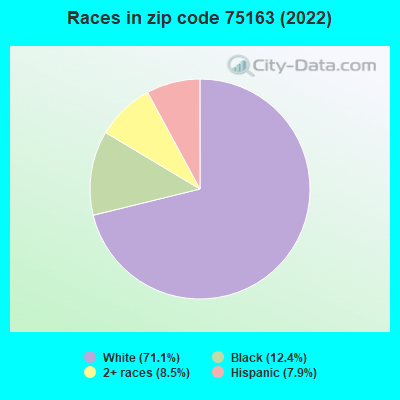
Hispanic race population percentage significantly below state average.
Median age significantly above state average.
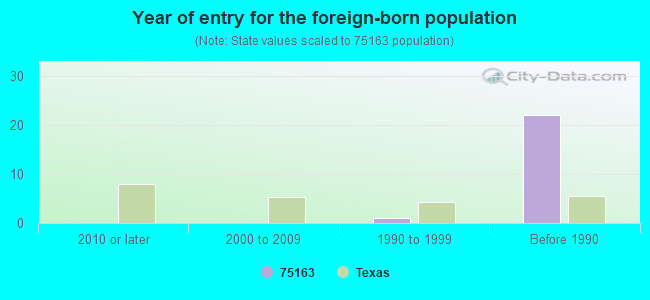
Foreign-born population percentage significantly below state average.
Renting percentage below state average.
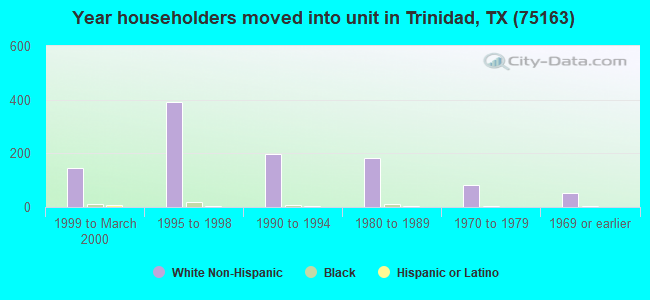
Length of stay since moving in significantly above state average.
Averages for the 2020 tax year for zip code 75163, filed in 2021:
Average Adjusted Gross Income (AGI) in 2020: $61,532 (Individual Income Tax Returns)
Here:
$61,532
State:
$77,054
Salary/wage: $52,699 (reported on 72.4% of returns)
Here:
$52,699
State:
$62,766
(% of AGI for various income ranges: 1045.5% for AGIs below $25k, 2974.2% for AGIs $25k-50k, 5079.1% for AGIs $50k-75k, 8076.7% for AGIs $75k-100k, 12931.2% for AGIs $100k-200k)
Taxable interest for individuals: $1,540 (reported on 28.6% of returns)
This zip code:
$1,540
Texas:
$2,665
(% of AGI for various income ranges: 15.5% for AGIs below $25k, 42.6% for AGIs $25k-50k, 62.7% for AGIs $50k-75k, 78.3% for AGIs $75k-100k, 211.2% for AGIs $100k-200k)
Ordinary dividends: $6,447 (reported on 18.1% of returns)
Here:
$6,447
State:
$10,044
(% of AGI for various income ranges: 20.3% for AGIs below $25k, 67.9% for AGIs $25k-50k, 164.5% for AGIs $50k-75k, 236.7% for AGIs $75k-100k, 485.0% for AGIs $100k-200k)
Net capital gain/loss in AGI: +$10,367 (reported on 17.1% of returns)
Here:
+$10,367
State:
+$39,590
(% of AGI for various income ranges: 19.3% for AGIs below $25k, 45.8% for AGIs $25k-50k, 203.6% for AGIs $50k-75k, 371.7% for AGIs $75k-100k, 671.2% for AGIs $100k-200k)
Profit/loss from business: +$9,160 (reported on 19.0% of returns)
Here:
+$9,160
State:
+$10,888
(% of AGI for various income ranges: 100.7% for AGIs below $25k, 155.8% for AGIs $25k-50k, 860.9% for AGIs $50k-75k, 371.2% for AGIs $100k-200k)
Taxable individual retirement arrangement distribution: $19,969 (reported on 12.4% of returns)
75163:
$19,969
Texas:
$24,740
(% of AGI for various income ranges: 50.0% for AGIs below $25k, 114.2% for AGIs $25k-50k, 502.7% for AGIs $50k-75k, 2101.2% for AGIs $100k-200k)
Total itemized deductions: $36,125 (reported on 3.8% of returns)
Here:
$36,125
State:
$40,428
(% of AGI for various income ranges: 1806.2% for AGIs $100k-200k)
Charity contributions: $11,200 (reported on 2.9% of returns)
Here:
$11,200
State:
$18,201
(% of AGI for various income ranges: 420.0% for AGIs $100k-200k)
Taxes paid: $8,525 (reported on 3.8% of returns)
75163:
$8,525
State:
$7,821
(% of AGI for various income ranges: 426.2% for AGIs $100k-200k)
Earned income credit: $2,405 (reported on 21.0% of returns)
Here:
$2,405
State:
$2,584
(% of AGI for various income ranges: 120.0% for AGIs below $25k, 95.3% for AGIs $25k-50k)
Percentage of individuals using paid preparers for their 2020 taxes: 92.4%
Here:
92%
State:
92%
(% for various income ranges: 92.1% for AGIs below $25k, 91.7% for AGIs $25k-50k, 93.8% for AGIs $50k-75k, 88.9% for AGIs $75k-100k, 92.9% for AGIs $100k-200k, 100.0% for AGIs over 200k)
Averages for the 2012 tax year for zip code 75163, filed in 2013:
Average Adjusted Gross Income (AGI) in 2012: $50,449 (Individual Income Tax Returns)
Here:
$50,449
State:
$65,384
Salary/wage: $41,943 (reported on 73.5% of returns)
Here:
$41,943
State:
$52,524
(% of AGI for various income ranges: 69.1% for AGIs below $25k, 68.0% for AGIs $25k-50k, 61.4% for AGIs $50k-75k, 63.2% for AGIs $75k-100k, 91.3% for AGIs $100k-200k)
Taxable interest for individuals: $1,334 (reported on 29.6% of returns)
This zip code:
$1,334
Texas:
$2,372
(% of AGI for various income ranges: 1.2% for AGIs below $25k, 0.6% for AGIs $25k-50k, 1.0% for AGIs $50k-75k, 0.2% for AGIs $75k-100k, 1.2% for AGIs $100k-200k, 0.3% for AGIs over 200k)
Ordinary dividends: $6,240 (reported on 15.3% of returns)
Here:
$6,240
State:
$9,721
(% of AGI for various income ranges: 0.8% for AGIs below $25k, 0.5% for AGIs $25k-50k, 2.6% for AGIs $50k-75k, 5.1% for AGIs $100k-200k)
Net capital gain/loss in AGI: +$7,023 (reported on 13.3% of returns)
Here:
+$7,023
State:
+$35,319
(% of AGI for various income ranges: 13.1% for AGIs below $25k, 0.6% for AGIs $50k-75k, 6.7% for AGIs $100k-200k)
Profit/loss from business: +$13,095 (reported on 19.4% of returns)
Here:
+$13,095
State:
+$13,732
(% of AGI for various income ranges: 11.9% for AGIs below $25k, 4.7% for AGIs $25k-50k, 10.4% for AGIs $50k-75k, 5.1% for AGIs $100k-200k)
Taxable individual retirement arrangement distribution: $20,279 (reported on 14.3% of returns)
75163:
$20,279
Texas:
$19,511
(% of AGI for various income ranges: 4.2% for AGIs below $25k, 3.5% for AGIs $25k-50k, 12.1% for AGIs $50k-75k, 10.8% for AGIs $100k-200k)
Total itemized deductions: $23,086 (23% of AGI, reported on 22.4% of returns)
Here:
$23,086
State:
$24,724
Here:
22.7% of AGI
State:
15.9% of AGI
(% of AGI for various income ranges: 8.6% for AGIs below $25k, 7.6% for AGIs $25k-50k, 11.9% for AGIs $50k-75k, 11.1% for AGIs $75k-100k, 12.7% for AGIs $100k-200k, 8.6% for AGIs over 200k)
Charity contributions: $4,994 (reported on 16.3% of returns)
Here:
$4,994
State:
$6,808
(% of AGI for various income ranges: 1.3% for AGIs $25k-50k, 1.5% for AGIs $50k-75k, 1.7% for AGIs $75k-100k, 3.6% for AGIs $100k-200k)
Taxes paid: $5,923 (reported on 22.4% of returns)
75163:
$5,923
State:
$6,921
(% of AGI for various income ranges: 1.7% for AGIs below $25k, 1.1% for AGIs $25k-50k, 2.8% for AGIs $50k-75k, 2.8% for AGIs $75k-100k, 3.5% for AGIs $100k-200k, 3.2% for AGIs over 200k)
Earned income credit: $2,652 (reported on 23.5% of returns)
Here:
$2,652
State:
$2,570
(% of AGI for various income ranges: 9.7% for AGIs below $25k, 1.1% for AGIs $25k-50k)
Percentage of individuals using paid preparers for their 2012 taxes: 57.1%
Here:
57%
State:
51%
(% for various income ranges: 55.0% for AGIs below $25k, 50.0% for AGIs $25k-50k, 66.7% for AGIs $50k-75k, 57.1% for AGIs $75k-100k, 90.0% for AGIs $100k-200k)
Averages for the 2004 tax year for zip code 75163, filed in 2005:
Average Adjusted Gross Income (AGI) in 2004: $41,028 (Individual Income Tax Returns)
Here:
$41,028
State:
$47,881
Salary/wage: $36,019 (reported on 73.2% of returns)
Here:
$36,019
State:
$41,947
(% of AGI for various income ranges: 67.7% for AGIs below $10k, 63.7% for AGIs $10k-25k, 71.4% for AGIs $25k-50k, 63.8% for AGIs $50k-75k, 68.8% for AGIs $75k-100k, 57.4% for AGIs over 100k)
Taxable interest for individuals: $3,145 (reported on 38.3% of returns)
This zip code:
$3,145
Texas:
$2,255
(% of AGI for various income ranges: 5.7% for AGIs below $10k, 3.0% for AGIs $10k-25k, 1.9% for AGIs $25k-50k, 1.1% for AGIs $50k-75k, 1.4% for AGIs $75k-100k, 5.5% for AGIs over 100k)
Taxable dividends: $4,032 (reported on 18.5% of returns)
Here:
$4,032
State:
$4,261
(% of AGI for various income ranges: 2.8% for AGIs below $10k, 1.1% for AGIs $10k-25k, 1.4% for AGIs $25k-50k, 0.5% for AGIs $50k-75k, 0.8% for AGIs $75k-100k, 3.8% for AGIs over 100k)
Net capital gain/loss: +$2,071 (reported on 16.4% of returns)
Here:
+$2,071
State:
+$16,110
(% of AGI for various income ranges: -1.9% for AGIs below $10k, -0.7% for AGIs $10k-25k, 0.5% for AGIs $25k-50k, 0.1% for AGIs $50k-75k, -0.4% for AGIs $75k-100k, 3.0% for AGIs over 100k)
Profit/loss from business: +$8,258 (reported on 18.9% of returns)
Here:
+$8,258
State:
+$11,013
(% of AGI for various income ranges: 15.2% for AGIs below $10k, 6.9% for AGIs $10k-25k, 3.8% for AGIs $25k-50k, 5.0% for AGIs $50k-75k, 8.0% for AGIs $75k-100k, -1.1% for AGIs over 100k)
IRA payment deduction: $2,769 (reported on 1.3% of returns)
75163:
$2,769
Texas:
$3,120
Total itemized deductions: $18,211 (23% of AGI, reported on 23.6% of returns)
Here:
$18,211
State:
$19,631
Here:
23.4% of AGI
State:
18.9% of AGI
(% of AGI for various income ranges: 15.0% for AGIs below $10k, 7.2% for AGIs $10k-25k, 10.0% for AGIs $25k-50k, 11.8% for AGIs $50k-75k, 11.3% for AGIs $75k-100k, 10.4% for AGIs over 100k)
Charity contributions deductions: $3,439 (4% of AGI, reported on 19.3% of returns)
Here:
$3,439
State:
$4,753
Here:
4.1% of AGI
State:
4.2% of AGI
(% of AGI for various income ranges: 1.0% for AGIs $10k-25k, 1.4% for AGIs $25k-50k, 1.8% for AGIs $50k-75k, 1.6% for AGIs $75k-100k, 2.0% for AGIs over 100k)
Total tax: $6,748 (reported on 70.0% of returns)
75163:
$6,748
State:
$9,058
(% of AGI for various income ranges: 3.0% for AGIs below $10k, 3.3% for AGIs $10k-25k, 6.0% for AGIs $25k-50k, 9.7% for AGIs $50k-75k, 12.8% for AGIs $75k-100k, 19.9% for AGIs over 100k)
Earned income credit: $2,000 (reported on 23.1% of returns)
Here:
$2,000
State:
$2,024
Percentage of individuals using paid preparers for their 2004 taxes: 65.5%
Here:
65%
State:
57%
(% for various income ranges: 62.6% for AGIs below $10k, 68.8% for AGIs $10k-25k, 64.3% for AGIs $25k-50k, 61.1% for AGIs $50k-75k, 63.4% for AGIs $75k-100k, 75.0% for AGIs over 100k)
Likely homosexual households (counted as self-reported same-sex unmarried-partner households)
Lesbian couples: 0.0% of all households
Gay men: 1.0% of all households
Household received Food Stamps/SNAP in the past 12 months: 177 Household did not receive Food Stamps/SNAP in the past 12 months: 1,096
Women who had a birth in the past 12 months: 19 (20 now married, 0 unmarried) Women who did not have a birth in the past 12 months: 392 (196 now married, 194 unmarried)
Housing units in zip code 75163 with a mortgage: 369 Median monthly owner costs for units with a mortgage: $2,201 Median monthly owner costs for units without a mortgage: $385
Residents with income below the poverty level in 2022:
This zip code:
19.2%
Whole state:
14.0%
Residents with income below 50% of the poverty level in 2022:
This zip code:
7.5%
Whole state:
7.4%
Median number of rooms in houses and condos:
Here:
5.7
State:
6.3
Median number of rooms in apartments:
Here:
4.9
State:
4.0
Notable locations in this zip code not listed on our city pages
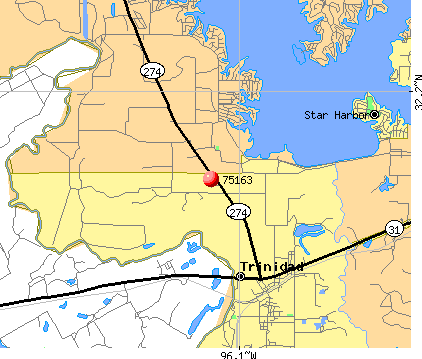
Notable locations in zip code 75163: Creslenn Ranch (A), Trinidad Volunteer Fire Department Station 1 (B), Trinidad Volunteer Fire Department Station 3 (C), Trinidad Volunteer Fire Department Station 2 (D). Display/hide their locations on the map
Lakes and reservoirs: City Lake (A), Gallimo Lake (B), Flag Lake (C), Trinidad Lake (D), Texas Power and Light Company Lake (E), Trinidad City Lake (F). Display/hide their locations on the map
Size of family households: 587 2-persons, 54 3-persons, 94 4-persons, 7 5-persons, 30 6-persons
Size of nonfamily households: 423 1-person, 88 2-persons
268 married couples with children.
91 single-parent households (25 men, 66 women).
94.9% of residents of 75163 zip code speak English at home.
5.6% of residents speak Spanish at home (18% very well, 82% well).
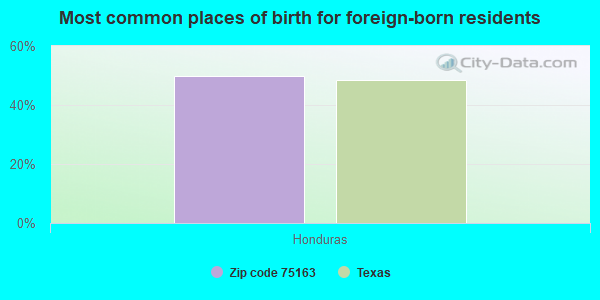
Foreign born population: 1 (0.1%) (0.0% of them are naturalized citizens)
:
0.1%
Whole state:
17.2%
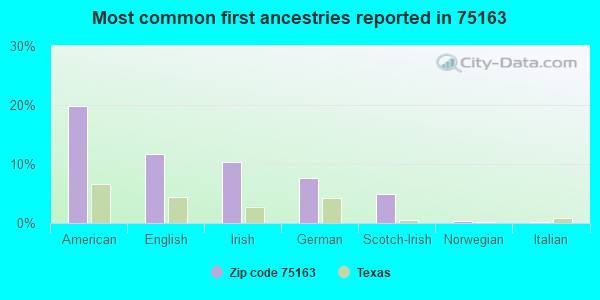
50%Honduras
20%American
12%English
10%Irish
8%German
5%Scotch-Irish
0%Norwegian
0%Italian
Year of entry for the foreign-born population
02010 or later
02000 to 2009
11990 to 1999
22Before 1990
Facilities with environmental interests located in this zip code:
A L P H A CAMPUS (105 W EATON in TRINIDAD, TX)
(National Center for Education Statistics) - STATE ID-107907002 Organizations: TRINIDAD ISD (SCHOOL DISTRICT)
Housing units lacking complete plumbing facilities: 8.4% Housing units lacking complete kitchen facilities: 2.5%
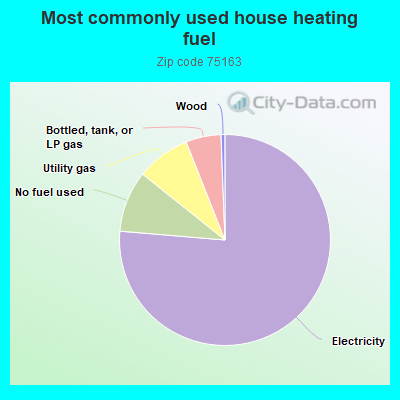
76.5%Electricity
9.4%No fuel used
8.3%Utility gas
5.4%Bottled, tank, or LP gas
0.6%Wood
Population in 1990: 1,246. Population change in the 1990s: +1,368 (+109.8%).
Place of birth for U.S.-born residents:
This state: 1,929
Northeast: 74
Midwest: 187
South: 272
West: 103
51% of the 75163 zip code residents lived in the same house 5 years ago. Out of people who lived in different houses, 26% lived in this county. Out of people who lived in different counties, 50% lived in Texas.
90% of the 75163 zip code residents lived in the same house 1 year ago. Out of people who lived in different houses, 27% moved from this county. Out of people who lived in different houses, 75% moved from different county within same state.
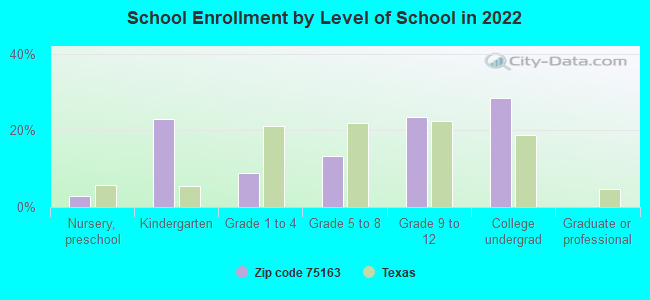
Private vs. public school enrollment:
Students in private schools in grades 1 to 8 (elementary and middle school):
Here:
0.0%
Texas:
8.8%
Students in private schools in grades 9 to 12 (high school):
Here:
0.0%
Texas:
8.0%
Students in private undergraduate colleges: 59
Here:
52.5%
Texas:
16.2%
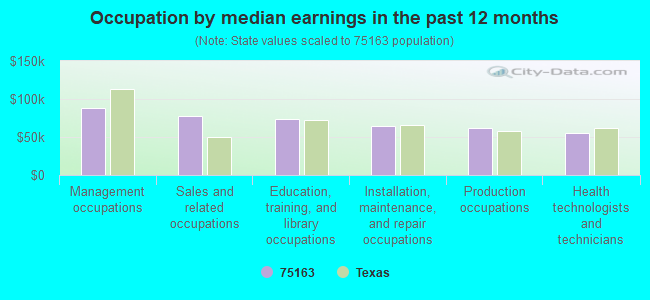
Occupation by median earnings in the past 12 months ($)
87,896Management occupations
77,102Sales and related occupations
73,866Education, training, and library occupations
64,471Installation, maintenance, and repair occupations
62,381Production occupations
55,134Health technologists and technicians
Top industries in this zip code by the number of employees in 2005:
Construction: Plumbing, Heating, and Air-Conditioning Contractors (20-49 employees: 1 establishment)
Utilities: Fossil Fuel Electric Power Generation (10-19: 1)
Health Care and Social Assistance: Offices of Dentists (5-9: 1)
Accommodation and Food Services: Drinking Places (Alcoholic Beverages) (5-9: 1)
Other Services (except Public Administration): Drycleaning and Laundry Services (except Coin-Operated) (5-9: 1)
Professional, Scientific, and Technical Services: All Other Professional, Scientific, and Technical Services (1-4: 1)
Health Care and Social Assistance: Vocational Rehabilitation Services (1-4: 1)
Arts, Entertainment, and Recreation: Amusement Arcades (1-4: 1)
Professional, Scientific, and Technical Services: Other Accounting Services (1-4: 1)
Home Mortgage Disclosure Act Aggregated Statistics For Year 2003 (Based on 4 partial tracts)
A) FHA, FSA/RHS & VA Home Purchase Loans
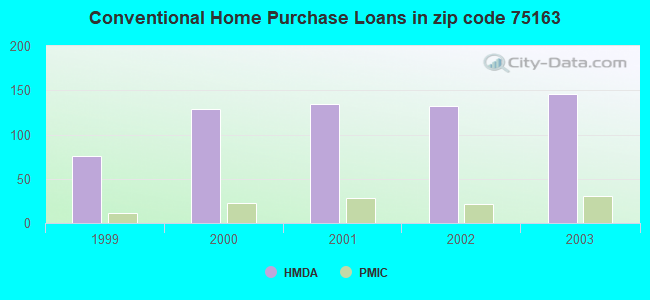
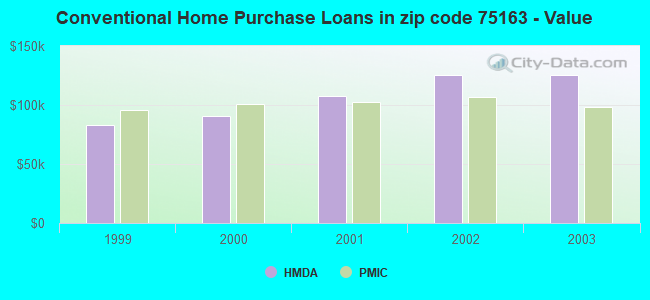
B) Conventional Home Purchase Loans
C) Refinancings
D) Home Improvement Loans
F) Non-occupant Loans on < 5 Family Dwellings (A B C & D)
Number
Average Value
Number
Average Value
Number
Average Value
Number
Average Value
Number
Average Value
LOANS ORIGINATED
9
$78,680
146
$125,254
221
$148,924
20
$23,806
138
$169,788
APPLICATIONS APPROVED, NOT ACCEPTED
0
$0
13
$115,456
28
$107,689
3
$27,490
8
$112,460
APPLICATIONS DENIED
0
$0
26
$54,057
107
$96,872
17
$17,046
14
$131,007
APPLICATIONS WITHDRAWN
3
$50,807
10
$106,548
54
$91,712
1
$14,830
9
$127,364
FILES CLOSED FOR INCOMPLETENESS
0
$0
4
$134,972
6
$136,998
0
$0
2
$152,515
Aggregated Statistics For Year 2002 (Based on 4 partial tracts)
A) FHA, FSA/RHS & VA Home Purchase Loans
B) Conventional Home Purchase Loans
C) Refinancings
D) Home Improvement Loans
F) Non-occupant Loans on < 5 Family Dwellings (A B C & D)
Number
Average Value
Number
Average Value
Number
Average Value
Number
Average Value
Number
Average Value
LOANS ORIGINATED
11
$98,472
132
$125,205
134
$133,095
12
$34,136
98
$178,887
APPLICATIONS APPROVED, NOT ACCEPTED
0
$0
11
$67,540
18
$111,477
2
$75,765
5
$142,916
APPLICATIONS DENIED
1
$107,320
44
$67,908
53
$91,198
10
$15,065
9
$59,838
APPLICATIONS WITHDRAWN
2
$56,840
7
$114,504
26
$109,475
4
$28,635
5
$202,078
FILES CLOSED FOR INCOMPLETENESS
0
$0
3
$51,400
9
$78,946
0
$0
1
$65,700
Aggregated Statistics For Year 2001 (Based on 4 partial tracts)
A) FHA, FSA/RHS & VA Home Purchase Loans
B) Conventional Home Purchase Loans
C) Refinancings
D) Home Improvement Loans
F) Non-occupant Loans on < 5 Family Dwellings (A B C & D)
Number
Average Value
Number
Average Value
Number
Average Value
Number
Average Value
Number
Average Value
LOANS ORIGINATED
11
$87,941
134
$107,859
96
$129,859
16
$16,672
70
$149,603
APPLICATIONS APPROVED, NOT ACCEPTED
0
$0
27
$65,674
10
$64,063
2
$47,560
3
$123,130
APPLICATIONS DENIED
1
$74,840
68
$54,948
39
$67,296
9
$18,441
8
$123,228
APPLICATIONS WITHDRAWN
1
$175,400
14
$93,599
24
$114,170
4
$21,018
4
$132,952
FILES CLOSED FOR INCOMPLETENESS
1
$61,560
3
$100,387
5
$61,842
0
$0
0
$0
Aggregated Statistics For Year 2000 (Based on 4 partial tracts)
A) FHA, FSA/RHS & VA Home Purchase Loans
B) Conventional Home Purchase Loans
C) Refinancings
D) Home Improvement Loans
F) Non-occupant Loans on < 5 Family Dwellings (A B C & D)
Number
Average Value
Number
Average Value
Number
Average Value
Number
Average Value
Number
Average Value
LOANS ORIGINATED
9
$74,628
129
$90,630
27
$87,978
17
$25,889
44
$100,049
APPLICATIONS APPROVED, NOT ACCEPTED
2
$92,060
27
$70,869
8
$94,105
6
$15,872
6
$117,567
APPLICATIONS DENIED
4
$63,135
98
$44,252
14
$68,390
12
$18,691
7
$68,653
APPLICATIONS WITHDRAWN
4
$78,822
13
$94,802
16
$67,934
1
$12,010
4
$104,600
FILES CLOSED FOR INCOMPLETENESS
0
$0
4
$59,338
5
$67,780
0
$0
3
$87,793
Aggregated Statistics For Year 1999 (Based on 2 partial tracts)
A) FHA, FSA/RHS & VA Home Purchase Loans
B) Conventional Home Purchase Loans
C) Refinancings
D) Home Improvement Loans
F) Non-occupant Loans on < 5 Family Dwellings (A B C & D)
Detailed PMIC statistics for the following Tracts:9508.00
, 9509.00
2002 - 2018 National Fire Incident Reporting System (NFIRS) incidents
Based on the data from the years 2002 - 2018 the average number of fire incidents per year is 43. The highest number of reported fire incidents - 89 took place in 2011, and the least - 15 in 2002. The data has an increasing trend.
When looking into fire subcategories, the most incidents belonged to: Outside Fires (69.1%), and Structure Fires (21.9%).
Fire incident types reported to NFIRS in Zip Code 75163
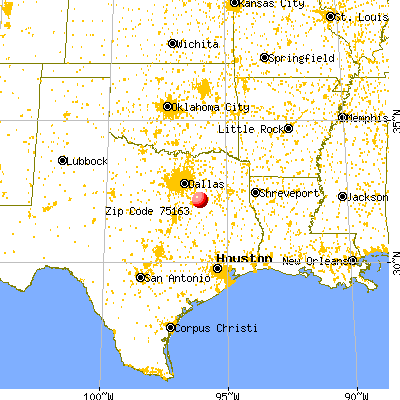


 Nearest zip codes: 75148, 75144, 75156, 75153, 75124, 75751.
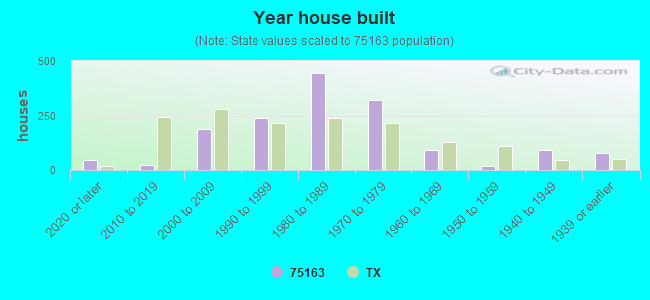


 Based on the data from the years 2002 - 2018 the average number of fire incidents per year is 43. The highest number of reported fire incidents - 89 took place in 2011, and the least - 15 in 2002. The data has an increasing trend.
 When looking into fire subcategories, the most incidents belonged to: Outside Fires (69.1%), and Structure Fires (21.9%).