Estimated zip code population in 2022: 2,656 Zip code population in 2010: 2,231 Zip code population in 2000: 2,284
Houses and condos: 1,145 Renter-occupied apartments: 90
% of renters here:
9%
State:
38%
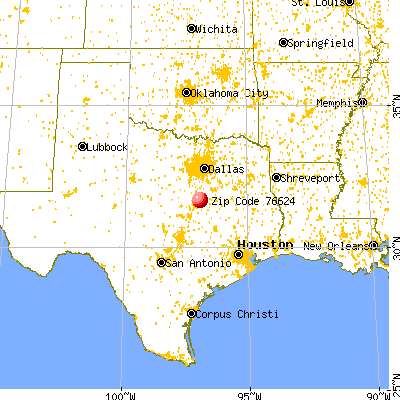
March 2022 cost of living index in zip code 76624: 78.6 (low, U.S. average is 100)
Land area: 64.2 sq. mi. Water area: 0.7 sq. mi.
Population density: 41 people per square mile
(very low).
OSM Map
General Map
Google Map
MSN Map
OSM Map
General Map
Google Map
MSN Map
OSM Map
General Map
Google Map
MSN Map
OSM Map
General Map
Google Map
MSN Map
Please wait while loading the map...
Real estate property taxes paid for housing units in 2022:
This zip code:
1.6% ($2,385)
Texas:
1.5% ($4,050)
Median real estate property taxes paid for housing units with mortgages in 2022: $2,598 (1.5%) Median real estate property taxes paid for housing units with no mortgage in 2022: $1,687 (1.9%)
Business Search- 14 Million verified businesses
Males: 1,403
(52.8%)
Females: 1,253
(47.2%)
For population 25 years and over in 76624:
High school or higher: 83.7%
Bachelor's degree or higher: 10.6%
Graduate or professional degree: 2.8%
Unemployed: 19.2%
Mean travel time to work (commute): 40.0 minutes
For population 15 years and over in 76624:
Never married: 26.1%
Now married: 55.4%
Separated: 0.7%
Widowed: 10.8%
Divorced: 7.0%
Zip code 76624 compared to state average:
Median house value below state average.
Unemployed percentage significantly above state average.
Black race population percentage below state average.
Hispanic race population percentage significantly below state average.
Median age significantly above state average.
Foreign-born population percentage significantly below state average.
Renting percentage significantly below state average.
Length of stay since moving in significantly above state average.
Number of college students above state average.
Percentage of population with a bachelor's degree or higher significantly below state average.
Averages for the 2020 tax year for zip code 76624, filed in 2021:
Average Adjusted Gross Income (AGI) in 2020: $60,540 (Individual Income Tax Returns)
Here:
$60,540
State:
$77,054
Salary/wage: $54,687 (reported on 79.8% of returns)
Here:
$54,687
State:
$62,766
(% of AGI for various income ranges: 1255.2% for AGIs below $25k, 3739.6% for AGIs $25k-50k, 6681.7% for AGIs $50k-75k, 9802.9% for AGIs $75k-100k, 15730.9% for AGIs $100k-200k)
Taxable interest for individuals: $1,000 (reported on 29.4% of returns)
This zip code:
$1,000
Texas:
$2,665
(% of AGI for various income ranges: 23.7% for AGIs below $25k, 34.1% for AGIs $25k-50k, 19.2% for AGIs $50k-75k, 104.3% for AGIs $75k-100k, 66.4% for AGIs $100k-200k)
Ordinary dividends: $1,736 (reported on 9.2% of returns)
Here:
$1,736
State:
$10,044
(% of AGI for various income ranges: 16.3% for AGIs below $25k, 30.0% for AGIs $50k-75k, 100.9% for AGIs $100k-200k)
Net capital gain/loss in AGI: +$19,025 (reported on 10.1% of returns)
Here:
+$19,025
State:
+$39,590
(% of AGI for various income ranges: 31.5% for AGIs below $25k, 127.5% for AGIs $50k-75k, 1859.1% for AGIs $100k-200k)
Profit/loss from business: +$10,854 (reported on 20.2% of returns)
Here:
+$10,854
State:
+$10,888
(% of AGI for various income ranges: 164.8% for AGIs below $25k, 219.6% for AGIs $25k-50k, 360.0% for AGIs $50k-75k, 591.4% for AGIs $75k-100k, 655.5% for AGIs $100k-200k)
Taxable individual retirement arrangement distribution: $11,570 (reported on 8.4% of returns)
76624:
$11,570
Texas:
$24,740
(% of AGI for various income ranges: 67.4% for AGIs below $25k, 201.5% for AGIs $25k-50k, 615.7% for AGIs $75k-100k)
Total itemized deductions: $31,525 (reported on 3.4% of returns)
Here:
$31,525
State:
$40,428
(% of AGI for various income ranges: 218.9% for AGIs $25k-50k, 957.1% for AGIs $75k-100k)
Charity contributions: $10,350 (reported on 1.7% of returns)
Here:
$10,350
State:
$18,201
(% of AGI for various income ranges: 76.7% for AGIs $25k-50k)
Taxes paid: $5,125 (reported on 3.4% of returns)
76624:
$5,125
State:
$7,821
(% of AGI for various income ranges: 27.8% for AGIs $25k-50k, 185.7% for AGIs $75k-100k)
Earned income credit: $2,481 (reported on 17.6% of returns)
Here:
$2,481
State:
$2,584
(% of AGI for various income ranges: 109.3% for AGIs below $25k, 83.7% for AGIs $25k-50k)
Percentage of individuals using paid preparers for their 2020 taxes: 93.3%
Here:
93%
State:
92%
(% for various income ranges: 89.5% for AGIs below $25k, 94.1% for AGIs $25k-50k, 93.8% for AGIs $50k-75k, 100.0% for AGIs $75k-100k, 93.8% for AGIs $100k-200k, 100.0% for AGIs over 200k)
Averages for the 2012 tax year for zip code 76624, filed in 2013:
Average Adjusted Gross Income (AGI) in 2012: $44,948 (Individual Income Tax Returns)
Here:
$44,948
State:
$65,384
Salary/wage: $41,740 (reported on 83.5% of returns)
Here:
$41,740
State:
$52,524
(% of AGI for various income ranges: 75.7% for AGIs below $25k, 83.6% for AGIs $25k-50k, 82.8% for AGIs $50k-75k, 80.0% for AGIs $75k-100k, 68.3% for AGIs $100k-200k)
Taxable interest for individuals: $503 (reported on 30.1% of returns)
This zip code:
$503
Texas:
$2,372
(% of AGI for various income ranges: 1.0% for AGIs below $25k, 0.4% for AGIs $25k-50k, 0.2% for AGIs $50k-75k, 0.2% for AGIs $75k-100k, 0.2% for AGIs $100k-200k)
Ordinary dividends: $838 (reported on 7.8% of returns)
Here:
$838
State:
$9,721
(% of AGI for various income ranges: 0.3% for AGIs below $25k, 0.2% for AGIs $25k-50k, 0.4% for AGIs $75k-100k)
Net capital gain/loss in AGI: +$1,978 (reported on 8.7% of returns)
Here:
+$1,978
State:
+$35,319
(% of AGI for various income ranges: 0.3% for AGIs below $25k, 0.4% for AGIs $50k-75k, 1.0% for AGIs $100k-200k)
Profit/loss from business: +$7,926 (reported on 18.4% of returns)
Here:
+$7,926
State:
+$13,732
(% of AGI for various income ranges: 6.4% for AGIs below $25k, 2.0% for AGIs $25k-50k, 2.7% for AGIs $50k-75k, 1.6% for AGIs $75k-100k, 4.5% for AGIs $100k-200k)
Taxable individual retirement arrangement distribution: $14,570 (reported on 9.7% of returns)
76624:
$14,570
Texas:
$19,511
(% of AGI for various income ranges: 2.2% for AGIs below $25k, 5.6% for AGIs $25k-50k, 8.7% for AGIs $75k-100k)
Total itemized deductions: $16,047 (22% of AGI, reported on 14.6% of returns)
Here:
$16,047
State:
$24,724
Here:
21.7% of AGI
State:
15.9% of AGI
(% of AGI for various income ranges: 5.9% for AGIs $25k-50k, 4.9% for AGIs $50k-75k, 5.3% for AGIs $75k-100k, 6.7% for AGIs $100k-200k)
Charity contributions: $4,880 (reported on 9.7% of returns)
Here:
$4,880
State:
$6,808
(% of AGI for various income ranges: 0.9% for AGIs $25k-50k, 1.7% for AGIs $50k-75k, 1.8% for AGIs $100k-200k)
Taxes paid: $3,885 (reported on 12.6% of returns)
76624:
$3,885
State:
$6,921
(% of AGI for various income ranges: 1.0% for AGIs $25k-50k, 1.0% for AGIs $50k-75k, 1.1% for AGIs $75k-100k, 1.6% for AGIs $100k-200k)
Earned income credit: $2,305 (reported on 18.4% of returns)
Here:
$2,305
State:
$2,570
(% of AGI for various income ranges: 6.4% for AGIs below $25k, 1.1% for AGIs $25k-50k)
Percentage of individuals using paid preparers for their 2012 taxes: 49.5%
Here:
50%
State:
51%
(% for various income ranges: 43.9% for AGIs below $25k, 48.3% for AGIs $25k-50k, 50.0% for AGIs $50k-75k, 60.0% for AGIs $75k-100k, 66.7% for AGIs $100k-200k)
Averages for the 2004 tax year for zip code 76624, filed in 2005:
Average Adjusted Gross Income (AGI) in 2004: $34,746 (Individual Income Tax Returns)
Here:
$34,746
State:
$47,881
Salary/wage: $34,688 (reported on 86.4% of returns)
Here:
$34,688
State:
$41,947
(% of AGI for various income ranges: 82.6% for AGIs $10k-25k, 85.7% for AGIs $25k-50k, 86.6% for AGIs $50k-75k, 87.4% for AGIs $75k-100k, 66.5% for AGIs over 100k)
Taxable interest for individuals: $945 (reported on 41.0% of returns)
This zip code:
$945
Texas:
$2,255
(% of AGI for various income ranges: 1.9% for AGIs $10k-25k, 0.9% for AGIs $25k-50k, 0.9% for AGIs $50k-75k, 0.7% for AGIs $75k-100k, 0.6% for AGIs over 100k)
Taxable dividends: $607 (reported on 11.9% of returns)
Here:
$607
State:
$4,261
(% of AGI for various income ranges: 0.5% for AGIs $10k-25k, 0.1% for AGIs $25k-50k, 0.0% for AGIs $50k-75k, 0.1% for AGIs $75k-100k, 0.2% for AGIs over 100k)
Net capital gain/loss: +$7,509 (reported on 11.2% of returns)
Here:
+$7,509
State:
+$16,110
(% of AGI for various income ranges: -0.3% for AGIs $10k-25k, 0.6% for AGIs $25k-50k, 1.6% for AGIs $50k-75k, 1.1% for AGIs $75k-100k, 11.1% for AGIs over 100k)
Profit/loss from business: +$4,923 (reported on 17.1% of returns)
Here:
+$4,923
State:
+$11,013
(% of AGI for various income ranges: 5.6% for AGIs $10k-25k, 2.6% for AGIs $25k-50k, 3.0% for AGIs $50k-75k, 2.0% for AGIs over 100k)
Total itemized deductions: $13,946 (22% of AGI, reported on 13.1% of returns)
Here:
$13,946
State:
$19,631
Here:
22.2% of AGI
State:
18.9% of AGI
(% of AGI for various income ranges: 5.6% for AGIs $10k-25k, 3.1% for AGIs $25k-50k, 6.0% for AGIs $50k-75k, 5.8% for AGIs $75k-100k, 6.6% for AGIs over 100k)
Charity contributions deductions: $3,744 (5% of AGI, reported on 9.2% of returns)
Here:
$3,744
State:
$4,753
Here:
5.5% of AGI
State:
4.2% of AGI
(% of AGI for various income ranges: 0.5% for AGIs $10k-25k, 0.4% for AGIs $25k-50k, 1.0% for AGIs $50k-75k, 1.1% for AGIs $75k-100k, 2.0% for AGIs over 100k)
Total tax: $4,356 (reported on 73.3% of returns)
76624:
$4,356
State:
$9,058
(% of AGI for various income ranges: 4.1% for AGIs $10k-25k, 6.3% for AGIs $25k-50k, 8.8% for AGIs $50k-75k, 11.3% for AGIs $75k-100k, 15.8% for AGIs over 100k)
Earned income credit: $1,665 (reported on 19.1% of returns)
Here:
$1,665
State:
$2,024
Percentage of individuals using paid preparers for their 2004 taxes: 53.8%
Here:
54%
State:
57%
(% for various income ranges: 50.8% for AGIs below $10k, 54.4% for AGIs $10k-25k, 55.3% for AGIs $25k-50k, 49.6% for AGIs $50k-75k, 55.4% for AGIs $75k-100k, 65.0% for AGIs over 100k)
Household received Food Stamps/SNAP in the past 12 months: 177 Household did not receive Food Stamps/SNAP in the past 12 months: 795
Women who had a birth in the past 12 months: 21 (22 now married, 0 unmarried) Women who did not have a birth in the past 12 months: 435 (125 now married, 312 unmarried)
Housing units in zip code 76624 with a mortgage: 340 (4 second mortgage, 5 both second mortgage and home equity loan) Median monthly owner costs for units with a mortgage: $1,414 Median monthly owner costs for units without a mortgage: $536
Residents with income below the poverty level in 2022:
This zip code:
7.3%
Whole state:
14.0%
Residents with income below 50% of the poverty level in 2022:
This zip code:
4.8%
Whole state:
7.4%
Median number of rooms in houses and condos:
Here:
6.1
State:
6.3
Median number of rooms in apartments:
Here:
4.5
State:
4.0
Notable locations in this zip code not listed on our city pages
Reservoirs: Soil Conservation Service Site 19 Reservoir (A), Double Tanks (B), Soil Conservation Service Site 14 Reservoir (C), Soil Conservation Service Site 25 Reservoir (D), Soil Conservation Service Site 11 Reservoir (E), Soil Conservation Service Site 12 Reservoir (F), Soil Conservation Service Site 20 Reservoir (G), Soil Conservation Service Site 21 Reservoir (H). Display/hide their locations on the map
Streams, rivers, and creeks: Wolf Creek (A), Rice Creek (B), Wildcat Creek (C), Little Tehuacana Creek (D), Salt Creek (E), Roberts Creek (F), Kirkland Branch (G), Horse Creek (H), Hog Creek (I). Display/hide their locations on the map
Size of family households: 413 2-persons, 82 3-persons, 51 4-persons, 122 5-persons, 24 6-persons, 38 7-or-more-persons
Size of nonfamily households: 222 1-person, 14 2-persons
216 married couples with children.
95 single-parent households (12 men, 83 women).
97.2% of residents of 76624 zip code speak English at home.
2.6% of residents speak Spanish at home (100% very well).
0.3% of residents speak other Indo-European language at home (100% very well).
Foreign born population: 73 (2.8%) (0.0% of them are naturalized citizens)
:
2.8%
Whole state:
17.2%
96%Honduras
14%German
12%Irish
10%Czech
9%American
8%English
2%European
1%Scotch-Irish
Year of entry for the foreign-born population
02010 or later
02000 to 2009
711990 to 1999
7Before 1990
Facilities with environmental interests located in this zip code:
AXTELL EL (308 OTTAWA in AXTELL, TX)
(National Center for Education Statistics) - STATE ID-161918101 Organizations: AXTELL ISD (SCHOOL DISTRICT)
AXTELL H S (308 OTTAWA in AXTELL, TX)
(National Center for Education Statistics) - STATE ID-161918001 Organizations: AXTELL ISD (SCHOOL DISTRICT)
AXTELL MIDDLE SCHOOL (308 OTTAWA in AXTELL, TX)
(National Center for Education Statistics) - STATE ID-161918041 Organizations: AXTELL ISD (SCHOOL DISTRICT)
AGRIPRO BIOSCIENCES INC (1 GREENBRIAR STABLE RD in AXTELL, TX)
(Resource Conservation and Recovery Act (tracking hazardous waste)) Alternative names: MAXELL HYBRIDS INC
Housing units lacking complete plumbing facilities: 2.4% Housing units lacking complete kitchen facilities: 2.9%
76.9%Electricity
15.9%Bottled, tank, or LP gas
3.9%Utility gas
3.4%Solar energy
Population in 1990: 3,235.
Place of birth for U.S.-born residents:
This state: 2,040
Northeast: 29
Midwest: 180
South: 141
West: 165
63% of the 76624 zip code residents lived in the same house 5 years ago. Out of people who lived in different houses, 64% lived in this county. Out of people who lived in different counties, 50% lived in Texas.
97% of the 76624 zip code residents lived in the same house 1 year ago. Out of people who lived in different houses, 36% moved from this county. Out of people who lived in different houses, 72% moved from different county within same state.
Private vs. public school enrollment:
Students in private schools in grades 1 to 8 (elementary and middle school):
Here:
0.0%
Texas:
8.8%
Students in private schools in grades 9 to 12 (high school):
Here:
0.0%
Texas:
8.0%
Students in private undergraduate colleges: 58
Here:
15.7%
Texas:
16.2%
Occupation by median earnings in the past 12 months ($)
130,268Transportation occupations
96,739Management occupations
67,515Health diagnosing and treating practitioners and other technical occupations
62,065Business and financial operations occupations
60,311Construction and extraction occupations
41,631Office and administrative support occupations
Companies with federal contracts located in this zip code:
DEITLER, GILBERT (702 BAYS RD in AXTELL, TX; small business)
$3,640 with Army for Other Administrative Support Services. Signed on 2006-04-04. Completion date: 2006-04-01.
Top industries in this zip code by the number of employees in 2005:
Health Care and Social Assistance: Other Residential Care Facilities (20-49 employees: 1 establishment)
Other Services (except Public Administration): Religious Organizations (5-9: 1, 1-4: 1)
Utilities: Water Supply and Irrigation Systems (1-4: 2)
Health Care and Social Assistance: Child Day Care Services (1-4: 2)
Construction: Plumbing, Heating, and Air-Conditioning Contractors (1-4: 2)
Health Care and Social Assistance: Offices of Physicians (except Mental Health Specialists) (1-4: 1)
Construction: Painting and Wall Covering Contractors (1-4: 1)
People in group quarters in 2010:
2 people in group homes intended for adults
People in group quarters in 2000:
6 people in schools, hospitals, or wards for the intellectually disabled
6 people in homes for the mentally retarded
Fatal accident statistics in 2013:
Fatal accident count: 2
Vehicles involved in fatal accidents: 3
Fatal accidents caused by drunken drivers: 1
Fatalities: 3
Persons involved in fatal accidents: 6
Pedestrians involved in fatal accidents: 0
Fatal accident statistics in 2012:
Fatal accident count: 2
Vehicles involved in fatal accidents: 4
Fatal accidents caused by drunken drivers: 0
Fatalities: 2
Persons involved in fatal accidents: 4
Pedestrians involved in fatal accidents: 0
Home Mortgage Disclosure Act Aggregated Statistics For Year 2009 (Based on 4 partial tracts)
A) FHA, FSA/RHS & VA Home Purchase Loans
B) Conventional Home Purchase Loans
C) Refinancings
D) Home Improvement Loans
F) Non-occupant Loans on < 5 Family Dwellings (A B C & D)
G) Loans On Manufactured Home Dwelling (A B C & D)
Number
Average Value
Number
Average Value
Number
Average Value
Number
Average Value
Number
Average Value
Number
Average Value
LOANS ORIGINATED
9
$114,043
16
$89,389
47
$121,986
4
$57,780
2
$123,015
7
$71,716
APPLICATIONS APPROVED, NOT ACCEPTED
0
$0
4
$101,582
6
$140,413
1
$12,430
0
$0
2
$119,290
APPLICATIONS DENIED
5
$180,176
6
$78,905
11
$85,401
6
$54,467
1
$74,560
5
$40,260
APPLICATIONS WITHDRAWN
1
$329,290
1
$145,380
11
$118,951
1
$29,820
1
$145,380
0
$0
FILES CLOSED FOR INCOMPLETENESS
0
$0
0
$0
2
$262,810
0
$0
0
$0
0
$0
Aggregated Statistics For Year 2008 (Based on 4 partial tracts)
A) FHA, FSA/RHS & VA Home Purchase Loans
B) Conventional Home Purchase Loans
C) Refinancings
D) Home Improvement Loans
F) Non-occupant Loans on < 5 Family Dwellings (A B C & D)
G) Loans On Manufactured Home Dwelling (A B C & D)
Number
Average Value
Number
Average Value
Number
Average Value
Number
Average Value
Number
Average Value
Number
Average Value
LOANS ORIGINATED
14
$120,177
22
$96,358
32
$132,725
15
$30,817
7
$101,183
12
$70,000
APPLICATIONS APPROVED, NOT ACCEPTED
0
$0
6
$53,638
4
$214,348
2
$65,860
0
$0
6
$53,638
APPLICATIONS DENIED
0
$0
12
$98,372
16
$98,942
7
$30,000
1
$106,860
6
$72,278
APPLICATIONS WITHDRAWN
1
$236,090
4
$129,230
7
$103,669
1
$74,560
1
$330,530
0
$0
FILES CLOSED FOR INCOMPLETENESS
0
$0
0
$0
0
$0
1
$124,260
0
$0
0
$0
Aggregated Statistics For Year 2007 (Based on 4 partial tracts)
A) FHA, FSA/RHS & VA Home Purchase Loans
B) Conventional Home Purchase Loans
C) Refinancings
D) Home Improvement Loans
F) Non-occupant Loans on < 5 Family Dwellings (A B C & D)
G) Loans On Manufactured Home Dwelling (A B C & D)
Number
Average Value
Number
Average Value
Number
Average Value
Number
Average Value
Number
Average Value
Number
Average Value
LOANS ORIGINATED
11
$122,453
36
$103,274
22
$98,956
14
$44,024
5
$78,532
9
$69,171
APPLICATIONS APPROVED, NOT ACCEPTED
0
$0
2
$127,365
4
$109,038
0
$0
1
$31,070
1
$44,730
APPLICATIONS DENIED
1
$96,920
10
$109,970
25
$115,015
17
$41,518
1
$68,340
6
$48,875
APPLICATIONS WITHDRAWN
4
$81,390
4
$46,908
16
$104,223
2
$21,745
0
$0
2
$113,075
FILES CLOSED FOR INCOMPLETENESS
1
$236,090
2
$150,975
0
$0
0
$0
0
$0
0
$0
Aggregated Statistics For Year 2006 (Based on 4 partial tracts)
A) FHA, FSA/RHS & VA Home Purchase Loans
B) Conventional Home Purchase Loans
C) Refinancings
D) Home Improvement Loans
F) Non-occupant Loans on < 5 Family Dwellings (A B C & D)
G) Loans On Manufactured Home Dwelling (A B C & D)
Number
Average Value
Number
Average Value
Number
Average Value
Number
Average Value
Number
Average Value
Number
Average Value
LOANS ORIGINATED
10
$94,935
34
$92,574
31
$104,418
16
$47,064
7
$38,520
11
$59,419
APPLICATIONS APPROVED, NOT ACCEPTED
0
$0
21
$71,242
5
$138,922
1
$24,850
1
$26,090
7
$47,219
APPLICATIONS DENIED
4
$49,705
21
$57,337
30
$128,733
14
$60,799
2
$40,385
9
$38,521
APPLICATIONS WITHDRAWN
1
$75,800
7
$67,456
24
$91,642
1
$98,170
1
$55,920
0
$0
FILES CLOSED FOR INCOMPLETENESS
0
$0
1
$546,740
11
$122,792
0
$0
1
$94,440
0
$0
Aggregated Statistics For Year 2005 (Based on 4 partial tracts)
A) FHA, FSA/RHS & VA Home Purchase Loans
B) Conventional Home Purchase Loans
C) Refinancings
D) Home Improvement Loans
F) Non-occupant Loans on < 5 Family Dwellings (A B C & D)
G) Loans On Manufactured Home Dwelling (A B C & D)
Number
Average Value
Number
Average Value
Number
Average Value
Number
Average Value
Number
Average Value
Number
Average Value
LOANS ORIGINATED
11
$75,121
39
$69,968
41
$90,922
10
$46,846
4
$32,930
12
$51,775
APPLICATIONS APPROVED, NOT ACCEPTED
0
$0
11
$61,339
4
$112,765
1
$22,370
0
$0
7
$62,130
APPLICATIONS DENIED
4
$98,788
32
$70,634
36
$71,208
15
$28,414
4
$30,442
22
$54,900
APPLICATIONS WITHDRAWN
4
$68,652
7
$70,119
24
$87,292
2
$133,580
0
$0
1
$29,820
FILES CLOSED FOR INCOMPLETENESS
1
$104,380
2
$116,185
9
$98,718
0
$0
0
$0
1
$104,380
Aggregated Statistics For Year 2004 (Based on 4 partial tracts)
A) FHA, FSA/RHS & VA Home Purchase Loans
B) Conventional Home Purchase Loans
C) Refinancings
D) Home Improvement Loans
F) Non-occupant Loans on < 5 Family Dwellings (A B C & D)
G) Loans On Manufactured Home Dwelling (A B C & D)
Number
Average Value
Number
Average Value
Number
Average Value
Number
Average Value
Number
Average Value
Number
Average Value
LOANS ORIGINATED
6
$79,527
41
$94,741
53
$92,773
14
$12,604
5
$41,752
10
$46,225
APPLICATIONS APPROVED, NOT ACCEPTED
1
$63,370
11
$79,075
10
$91,331
2
$15,535
1
$55,920
10
$41,379
APPLICATIONS DENIED
4
$76,420
29
$52,703
35
$70,012
20
$34,668
4
$38,830
29
$40,492
APPLICATIONS WITHDRAWN
2
$68,345
1
$63,370
26
$73,122
5
$46,224
1
$63,370
4
$38,520
FILES CLOSED FOR INCOMPLETENESS
1
$63,370
0
$0
11
$104,944
1
$74,560
0
$0
0
$0
Aggregated Statistics For Year 2003 (Based on 4 partial tracts)
A) FHA, FSA/RHS & VA Home Purchase Loans
B) Conventional Home Purchase Loans
C) Refinancings
D) Home Improvement Loans
F) Non-occupant Loans on < 5 Family Dwellings (A B C & D)
Number
Average Value
Number
Average Value
Number
Average Value
Number
Average Value
Number
Average Value
LOANS ORIGINATED
12
$85,843
26
$81,247
94
$92,904
9
$53,156
7
$41,361
APPLICATIONS APPROVED, NOT ACCEPTED
1
$82,010
6
$50,325
5
$67,100
1
$99,410
0
$0
APPLICATIONS DENIED
2
$75,175
14
$64,438
47
$69,691
10
$12,550
1
$69,590
APPLICATIONS WITHDRAWN
0
$0
5
$59,894
32
$73,469
0
$0
2
$95,060
FILES CLOSED FOR INCOMPLETENESS
0
$0
4
$79,528
1
$99,410
1
$29,820
0
$0
Aggregated Statistics For Year 2002 (Based on 4 partial tracts)
A) FHA, FSA/RHS & VA Home Purchase Loans
B) Conventional Home Purchase Loans
C) Refinancings
D) Home Improvement Loans
F) Non-occupant Loans on < 5 Family Dwellings (A B C & D)
Number
Average Value
Number
Average Value
Number
Average Value
Number
Average Value
Number
Average Value
LOANS ORIGINATED
10
$80,272
26
$76,993
51
$88,541
7
$15,089
4
$11,805
APPLICATIONS APPROVED, NOT ACCEPTED
0
$0
2
$104,380
6
$144,348
4
$28,270
0
$0
APPLICATIONS DENIED
4
$85,740
12
$46,908
27
$51,775
7
$11,361
0
$0
APPLICATIONS WITHDRAWN
2
$75,800
0
$0
9
$80,079
0
$0
0
$0
FILES CLOSED FOR INCOMPLETENESS
0
$0
0
$0
6
$147,455
1
$49,700
0
$0
Aggregated Statistics For Year 2001 (Based on 4 partial tracts)
A) FHA, FSA/RHS & VA Home Purchase Loans
B) Conventional Home Purchase Loans
C) Refinancings
D) Home Improvement Loans
F) Non-occupant Loans on < 5 Family Dwellings (A B C & D)
Number
Average Value
Number
Average Value
Number
Average Value
Number
Average Value
Number
Average Value
LOANS ORIGINATED
9
$80,493
48
$70,388
52
$80,649
17
$18,493
5
$59,894
APPLICATIONS APPROVED, NOT ACCEPTED
0
$0
14
$46,509
7
$69,940
4
$21,435
0
$0
APPLICATIONS DENIED
0
$0
48
$44,086
21
$49,586
5
$20,130
5
$25,350
APPLICATIONS WITHDRAWN
0
$0
6
$46,183
12
$47,426
1
$6,210
0
$0
FILES CLOSED FOR INCOMPLETENESS
0
$0
4
$86,982
5
$89,468
0
$0
0
$0
Aggregated Statistics For Year 2000 (Based on 4 partial tracts)
A) FHA, FSA/RHS & VA Home Purchase Loans
B) Conventional Home Purchase Loans
C) Refinancings
D) Home Improvement Loans
F) Non-occupant Loans on < 5 Family Dwellings (A B C & D)
Number
Average Value
Number
Average Value
Number
Average Value
Number
Average Value
Number
Average Value
LOANS ORIGINATED
10
$67,349
55
$50,111
25
$60,688
15
$25,349
5
$75,550
APPLICATIONS APPROVED, NOT ACCEPTED
0
$0
15
$53,763
4
$102,515
5
$13,918
4
$22,055
APPLICATIONS DENIED
0
$0
75
$45,943
20
$44,174
7
$9,763
1
$85,740
APPLICATIONS WITHDRAWN
0
$0
6
$49,912
20
$41,565
1
$29,820
0
$0
FILES CLOSED FOR INCOMPLETENESS
0
$0
6
$64,615
4
$30,442
0
$0
0
$0
Aggregated Statistics For Year 1999 (Based on 2 partial tracts)
A) FHA, FSA/RHS & VA Home Purchase Loans
B) Conventional Home Purchase Loans
C) Refinancings
D) Home Improvement Loans
F) Non-occupant Loans on < 5 Family Dwellings (A B C & D)
Detailed PMIC statistics for the following Tracts:0035.00
2002 - 2018 National Fire Incident Reporting System (NFIRS) incidents
Based on the data from the years 2002 - 2018 the average number of fire incidents per year is 7. The highest number of reported fire incidents - 27 took place in 2006, and the least - 0 in 2004. The data has a dropping trend.
When looking into fire subcategories, the most incidents belonged to: Outside Fires (68.8%), and Structure Fires (13.4%).
Fire incident types reported to NFIRS in Zip Code 76624


 Nearest zip codes: 76654, 76673, 76640, 76705, 76691, 76664.


 Based on the data from the years 2002 - 2018 the average number of fire incidents per year is 7. The highest number of reported fire incidents - 27 took place in 2006, and the least - 0 in 2004. The data has a dropping trend.
 When looking into fire subcategories, the most incidents belonged to: Outside Fires (68.8%), and Structure Fires (13.4%).