Estimated zip code population in 2022: 1,967 Zip code population in 2010: 1,989 Zip code population in 2000: 1,926
Houses and condos: 1,167 Renter-occupied apartments: 205
% of renters here:
23%
State:
38%
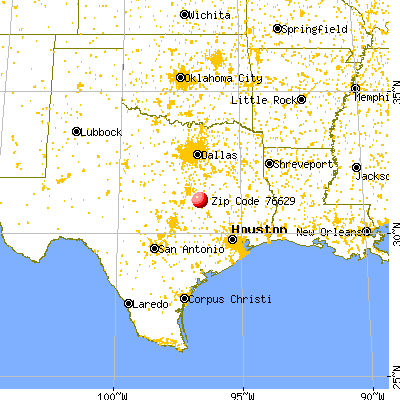
March 2022 cost of living index in zip code 76629: 79.1 (low, U.S. average is 100)
Land area: 141.5 sq. mi. Water area: 1.9 sq. mi.
Population density: 14 people per square mile
(very low).
OSM Map
General Map
Google Map
MSN Map
OSM Map
General Map
Google Map
MSN Map
OSM Map
General Map
Google Map
MSN Map
OSM Map
General Map
Google Map
MSN Map
Please wait while loading the map...
Real estate property taxes paid for housing units in 2022:
This zip code:
0.9% ($1,549)
Texas:
1.5% ($4,050)
Median real estate property taxes paid for housing units with mortgages in 2022: $2,048 (1.3%) Median real estate property taxes paid for housing units with no mortgage in 2022: $1,282 (0.7%)
Averages for the 2020 tax year for zip code 76629, filed in 2021:
Average Adjusted Gross Income (AGI) in 2020: $58,529 (Individual Income Tax Returns)
Here:
$58,529
State:
$77,054
Salary/wage: $56,836 (reported on 77.5% of returns)
Here:
$56,836
State:
$62,766
(% of AGI for various income ranges: 1266.5% for AGIs below $25k, 3820.0% for AGIs $25k-50k, 7080.0% for AGIs $50k-75k, 11156.7% for AGIs $75k-100k, 15008.9% for AGIs $100k-200k)
Taxable interest for individuals: $992 (reported on 28.1% of returns)
This zip code:
$992
Texas:
$2,665
(% of AGI for various income ranges: 10.5% for AGIs below $25k, 64.4% for AGIs $25k-50k, 23.8% for AGIs $50k-75k, 30.0% for AGIs $75k-100k, 82.2% for AGIs $100k-200k)
Ordinary dividends: $1,867 (reported on 10.1% of returns)
Here:
$1,867
State:
$10,044
(% of AGI for various income ranges: 29.5% for AGIs below $25k, 96.2% for AGIs $50k-75k, 35.6% for AGIs $100k-200k)
Net capital gain/loss in AGI: +$27,227 (reported on 12.4% of returns)
Here:
+$27,227
State:
+$39,590
(% of AGI for various income ranges: 132.8% for AGIs $25k-50k, 90.0% for AGIs $50k-75k, 2982.2% for AGIs $100k-200k)
Profit/loss from business: +$7,255 (reported on 22.5% of returns)
Here:
+$7,255
State:
+$10,888
(% of AGI for various income ranges: 265.0% for AGIs below $25k, 117.8% for AGIs $25k-50k, 365.0% for AGIs $50k-75k, 463.3% for AGIs $100k-200k)
Taxable individual retirement arrangement distribution: $17,971 (reported on 7.9% of returns)
76629:
$17,971
Texas:
$24,740
(% of AGI for various income ranges: 125.5% for AGIs below $25k, 1258.8% for AGIs $50k-75k)
Total itemized deductions: $30,900 (reported on 3.4% of returns)
Here:
$30,900
State:
$40,428
(% of AGI for various income ranges: 1030.0% for AGIs $100k-200k)
Charity contributions: $10,450 (reported on 2.2% of returns)
Here:
$10,450
State:
$18,201
(% of AGI for various income ranges: 261.2% for AGIs $50k-75k)
Taxes paid: $5,000 (reported on 3.4% of returns)
76629:
$5,000
State:
$7,821
(% of AGI for various income ranges: 166.7% for AGIs $100k-200k)
Earned income credit: $2,459 (reported on 19.1% of returns)
Here:
$2,459
State:
$2,584
(% of AGI for various income ranges: 145.0% for AGIs below $25k, 71.1% for AGIs $25k-50k)
Percentage of individuals using paid preparers for their 2020 taxes: 93.3%
Here:
93%
State:
92%
(% for various income ranges: 93.1% for AGIs below $25k, 91.7% for AGIs $25k-50k, 91.7% for AGIs $50k-75k, 100.0% for AGIs $75k-100k, 92.3% for AGIs $100k-200k, 100.0% for AGIs over 200k)
Averages for the 2012 tax year for zip code 76629, filed in 2013:
Average Adjusted Gross Income (AGI) in 2012: $46,228 (Individual Income Tax Returns)
Here:
$46,228
State:
$65,384
Salary/wage: $46,201 (reported on 78.8% of returns)
Here:
$46,201
State:
$52,524
(% of AGI for various income ranges: 76.7% for AGIs below $25k, 78.9% for AGIs $25k-50k, 86.3% for AGIs $50k-75k, 82.0% for AGIs $75k-100k, 72.7% for AGIs $100k-200k)
Taxable interest for individuals: $892 (reported on 30.6% of returns)
This zip code:
$892
Texas:
$2,372
(% of AGI for various income ranges: 2.0% for AGIs below $25k, 1.3% for AGIs $25k-50k, 0.3% for AGIs $50k-75k, 0.2% for AGIs $75k-100k, 0.2% for AGIs $100k-200k)
Ordinary dividends: $1,111 (reported on 10.6% of returns)
Here:
$1,111
State:
$9,721
(% of AGI for various income ranges: 1.1% for AGIs below $25k, 0.4% for AGIs $50k-75k, 0.2% for AGIs $100k-200k)
Net capital gain/loss in AGI: +$1,840 (reported on 11.8% of returns)
Here:
+$1,840
State:
+$35,319
(% of AGI for various income ranges: 0.4% for AGIs below $25k, 0.8% for AGIs $50k-75k, 0.9% for AGIs $100k-200k)
Profit/loss from business: +$4,223 (reported on 15.3% of returns)
Here:
+$4,223
State:
+$13,732
(% of AGI for various income ranges: 9.7% for AGIs below $25k, 1.1% for AGIs $25k-50k, 0.5% for AGIs $50k-75k, 0.3% for AGIs $75k-100k)
Taxable individual retirement arrangement distribution: $15,443 (reported on 8.2% of returns)
76629:
$15,443
Texas:
$19,511
Total itemized deductions: $18,300 (26% of AGI, reported on 17.6% of returns)
Here:
$18,300
State:
$24,724
Here:
26.1% of AGI
State:
15.9% of AGI
(% of AGI for various income ranges: 11.4% for AGIs $25k-50k, 8.7% for AGIs $50k-75k, 6.9% for AGIs $75k-100k, 6.0% for AGIs $100k-200k)
Charity contributions: $4,245 (reported on 12.9% of returns)
Here:
$4,245
State:
$6,808
(% of AGI for various income ranges: 1.5% for AGIs $25k-50k, 2.6% for AGIs $50k-75k, 1.4% for AGIs $100k-200k)
Taxes paid: $3,958 (reported on 14.1% of returns)
76629:
$3,958
State:
$6,921
(% of AGI for various income ranges: 1.5% for AGIs $25k-50k, 1.5% for AGIs $50k-75k, 1.2% for AGIs $75k-100k, 1.3% for AGIs $100k-200k)
Earned income credit: $2,200 (reported on 22.4% of returns)
Here:
$2,200
State:
$2,570
(% of AGI for various income ranges: 7.8% for AGIs below $25k, 1.3% for AGIs $25k-50k)
Percentage of individuals using paid preparers for their 2012 taxes: 65.9%
Here:
66%
State:
51%
(% for various income ranges: 61.1% for AGIs below $25k, 61.1% for AGIs $25k-50k, 66.7% for AGIs $50k-75k, 70.0% for AGIs $75k-100k, 88.9% for AGIs $100k-200k)
Averages for the 2004 tax year for zip code 76629, filed in 2005:
Average Adjusted Gross Income (AGI) in 2004: $39,927 (Individual Income Tax Returns)
Here:
$39,927
State:
$47,881
Salary/wage: $41,420 (reported on 83.8% of returns)
Here:
$41,420
State:
$41,947
(% of AGI for various income ranges: 115.0% for AGIs below $10k, 80.9% for AGIs $10k-25k, 83.4% for AGIs $25k-50k, 87.2% for AGIs $50k-75k, 92.1% for AGIs $75k-100k, 93.1% for AGIs over 100k)
Taxable interest for individuals: $1,494 (reported on 43.9% of returns)
This zip code:
$1,494
Texas:
$2,255
(% of AGI for various income ranges: 75.0% for AGIs below $10k, 2.7% for AGIs $10k-25k, 1.5% for AGIs $25k-50k, 0.9% for AGIs $50k-75k, 1.0% for AGIs $75k-100k, 2.4% for AGIs over 100k)
Taxable dividends: $747 (reported on 13.5% of returns)
Here:
$747
State:
$4,261
(% of AGI for various income ranges: 0.5% for AGIs $10k-25k, 0.2% for AGIs $25k-50k, 0.2% for AGIs $50k-75k, 0.5% for AGIs $75k-100k)
Net capital gain/loss: +$4,745 (reported on 17.4% of returns)
Here:
+$4,745
State:
+$16,110
(% of AGI for various income ranges: 2.9% for AGIs $10k-25k, 0.1% for AGIs $25k-50k, 4.1% for AGIs $50k-75k, 0.5% for AGIs $75k-100k, 2.6% for AGIs over 100k)
Profit/loss from business: +$2,971 (reported on 17.4% of returns)
Here:
+$2,971
State:
+$11,013
(% of AGI for various income ranges: 4.1% for AGIs $10k-25k, 2.5% for AGIs $25k-50k, -0.1% for AGIs $50k-75k, 0.4% for AGIs $75k-100k)
Total itemized deductions: $15,396 (25% of AGI, reported on 15.5% of returns)
Here:
$15,396
State:
$19,631
Here:
25.5% of AGI
State:
18.9% of AGI
(% of AGI for various income ranges: 7.6% for AGIs $10k-25k, 5.1% for AGIs $25k-50k, 6.0% for AGIs $50k-75k, 5.4% for AGIs $75k-100k, 6.6% for AGIs over 100k)
Charity contributions deductions: $3,792 (6% of AGI, reported on 13.1% of returns)
Here:
$3,792
State:
$4,753
Here:
6.1% of AGI
State:
4.2% of AGI
(% of AGI for various income ranges: 1.6% for AGIs $10k-25k, 0.6% for AGIs $25k-50k, 1.6% for AGIs $50k-75k, 1.2% for AGIs $75k-100k, 1.5% for AGIs over 100k)
Total tax: $4,442 (reported on 73.7% of returns)
76629:
$4,442
State:
$9,058
(% of AGI for various income ranges: 3.0% for AGIs $10k-25k, 6.3% for AGIs $25k-50k, 7.9% for AGIs $50k-75k, 10.1% for AGIs $75k-100k, 15.0% for AGIs over 100k)
Earned income credit: $2,116 (reported on 20.6% of returns)
Here:
$2,116
State:
$2,024
Percentage of individuals using paid preparers for their 2004 taxes: 75.4%
Here:
75%
State:
57%
(% for various income ranges: 57.5% for AGIs below $10k, 78.4% for AGIs $10k-25k, 71.6% for AGIs $25k-50k, 80.8% for AGIs $50k-75k, 76.9% for AGIs $75k-100k, 82.1% for AGIs over 100k)
Household received Food Stamps/SNAP in the past 12 months: 73 Household did not receive Food Stamps/SNAP in the past 12 months: 803
Women who did not have a birth in the past 12 months: 391 (176 now married, 214 unmarried)
Housing units in zip code 76629 with a mortgage: 218 (14 second mortgage, 5 both second mortgage and home equity loan) Median monthly owner costs for units with a mortgage: $1,234 Median monthly owner costs for units without a mortgage: $512
Residents with income below the poverty level in 2022:
This zip code:
14.0%
Whole state:
14.0%
Residents with income below 50% of the poverty level in 2022:
This zip code:
6.9%
Whole state:
7.4%
Median number of rooms in houses and condos:
Here:
5.4
State:
6.3
Median number of rooms in apartments:
Here:
4.7
State:
4.0
Notable locations in this zip code not listed on our city pages
Churches in zip code 76629 include: Petteway Church (A), True-Vine Church (B), Pleasant Grove Church (C), Macedonia Church (D), Walnut Church (E). Display/hide their locations on the map
Cemeteries: Macedonia Cemetery (1), Beck Prairie Cemetery (2), Harper Cemetery (3), Saint Mary Cemetery (4), Cloverleaf Rest Cemetery (5), Bremond Cemetery (6), Anderson Cemetery (7). Display/hide their locations on the map
Streams, rivers, and creeks: Big Sandy Creek (A), Beck Creek (B), Alligator Creek (C), Willow Creek (D), Willson Creek (E), Claybank Creek (F), Chair Branch (G), Rocky Creek (H), Red Bank Creek (I). Display/hide their locations on the map
In group quarters: 45 (-1 institutionalized population)
Size of family households: 343 2-persons, 93 3-persons, 95 4-persons, 32 5-persons
Size of nonfamily households: 271 1-person, 20 2-persons, 25 3-persons
226 married couples with children.
99 single-parent households (99 women).
95.0% of residents of 76629 zip code speak English at home.
4.7% of residents speak Spanish at home (90% very well, 10% well).
0.3% of residents speak other Indo-European language at home (100% very well).
0.1% of residents speak other language at home (100% not at all).
Foreign born population: 29 (1.5%) (0.0% of them are naturalized citizens)
:
1.5%
Whole state:
17.2%
94%Honduras
19%Polish
11%German
9%American
6%Irish
5%English
3%French
3%African
Year of entry for the foreign-born population
92010 or later
212000 to 2009
71990 to 1999
0Before 1990
Facilities with environmental interests located in this zip code:
AMERICAN TELEPHONE AND TELEGRAPH COMPANY (HIGHWAY 6 5.7 MI OF in BREMOND, TX)
(Resource Conservation and Recovery Act (tracking hazardous waste)) Alternative names: AMERICAN TEL & TEL CO LONG LINES
Housing units lacking complete plumbing facilities: 12.8% Housing units lacking complete kitchen facilities: 11.5%
59.5%Electricity
25.3%Utility gas
12.3%Bottled, tank, or LP gas
3.1%Wood
Population in 1990: 1,883. Population change in the 1990s: +43 (+2.3%).
Place of birth for U.S.-born residents:
This state: 1,713
Northeast: 9
Midwest: 22
South: 123
West: 38
63% of the 76629 zip code residents lived in the same house 5 years ago. Out of people who lived in different houses, 36% lived in this county. Out of people who lived in different counties, 50% lived in Texas.
96% of the 76629 zip code residents lived in the same house 1 year ago. Out of people who lived in different houses, 109% moved from different county within same state.
Private vs. public school enrollment:
Students in private schools in grades 1 to 8 (elementary and middle school):
Here:
0.0%
Texas:
8.8%
Students in private schools in grades 9 to 12 (high school):
Here:
0.0%
Texas:
8.0%
Students in private undergraduate colleges: 12
Here:
14.8%
Texas:
16.2%
Occupation by median earnings in the past 12 months ($)
75,894Installation, maintenance, and repair occupations
54,586Material moving occupations
51,857Management occupations
47,876Sales and related occupations
35,811Healthcare support occupations
35,234Construction and extraction occupations
Companies with federal contracts located in this zip code:
ROY CONNER (100 SAND MOUNTAIN RD in BREMOND, TX; small business) : $22,370 in 3 contractsfrom 2004 to 2005
$7,735 with Army for Other Housekeeping Services. Signed on 2005-03-21. Completion date: 2005-03-08.
$7,735 with U.S. Army Corps of Engineers - civil program financing only for Other Housekeeping Services. Signed on 2005-03-21. Completion date: 2005-03-08.
$6,900 with Army for Guard Services. Signed on 2004-03-08. Completion date: 2004-08-16.
Top industries in this zip code by the number of employees in 2005:
Health Care and Social Assistance: Nursing Care Facilities (50-99 employees: 1 establishment)
Mining: Bituminous Coal and Lignite Surface Mining (50-99: 1)
Utilities: Fossil Fuel Electric Power Generation (50-99: 1)
Finance and Insurance: Commercial Banking (10-19: 1)
Other Services (except Public Administration): Religious Organizations (5-9: 1, 1-4: 1)
Health Care and Social Assistance: Offices of Physical, Occupational and Speech Therapists, and Audiologists (5-9: 1)
Health Care and Social Assistance: Offices of Dentists (5-9: 1)
Construction: New Single-Family Housing Construction (except Operative Builders) (5-9: 1)
Accommodation and Food Services: Full-Service Restaurants (1-4: 2)
Other Services (except Public Administration): Civic and Social Organizations (1-4: 2)
People in group quarters in 2010:
52 people in nursing facilities/skilled-nursing facilities
People in group quarters in 2000:
54 people in nursing homes
2 people in religious group quarters
Fatal accident statistics in 2014:
Fatal accident count: 1
Vehicles involved in fatal accidents: 1
Fatal accidents caused by drunken drivers: 0
Fatalities: 1
Persons involved in fatal accidents: 1
Pedestrians involved in fatal accidents: 0
Fatal accident statistics in 2013:
Fatal accident count: 3
Vehicles involved in fatal accidents: 6
Fatal accidents caused by drunken drivers: 1
Fatalities: 3
Persons involved in fatal accidents: 6
Pedestrians involved in fatal accidents: 1
2002 - 2018 National Fire Incident Reporting System (NFIRS) incidents
According to the data from the years 2002 - 2018 the average number of fires per year is 38. The highest number of reported fire incidents - 68 took place in 2018, and the least - 6 in 2010. The data has an increasing trend.
When looking into fire subcategories, the most incidents belonged to: Outside Fires (72.1%), and Structure Fires (16.3%).
Fire incident types reported to NFIRS in Zip Code 76629


 Nearest zip codes: 77837, 76653, 76680, 77856, 76661, 76687.


 According to the data from the years 2002 - 2018 the average number of fires per year is 38. The highest number of reported fire incidents - 68 took place in 2018, and the least - 6 in 2010. The data has an increasing trend.
 When looking into fire subcategories, the most incidents belonged to: Outside Fires (72.1%), and Structure Fires (16.3%).