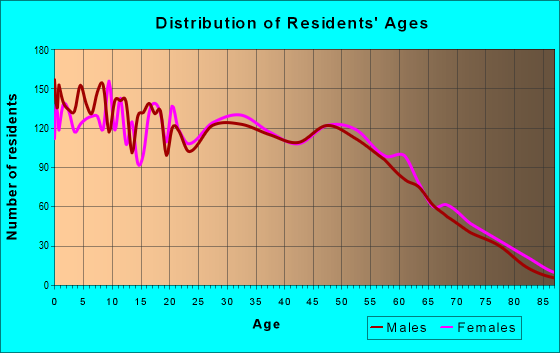
Estimated zip code population in 2022: 24,754 Zip code population in 2010: 16,710 Zip code population in 2000: 11,354
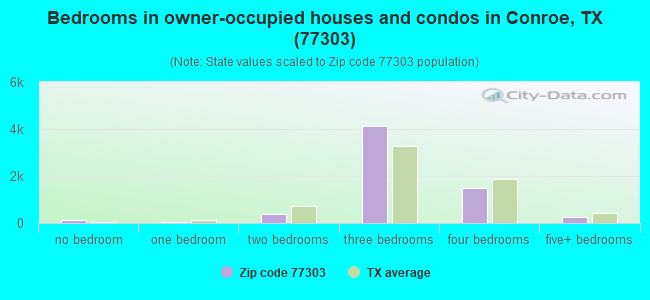
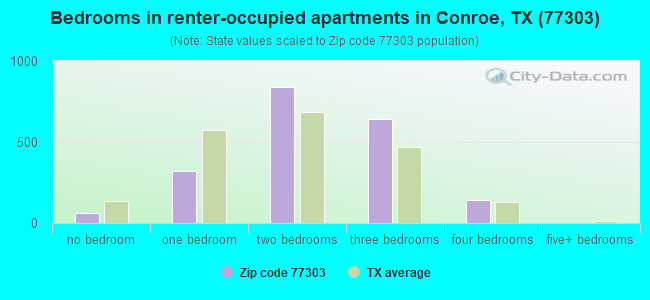
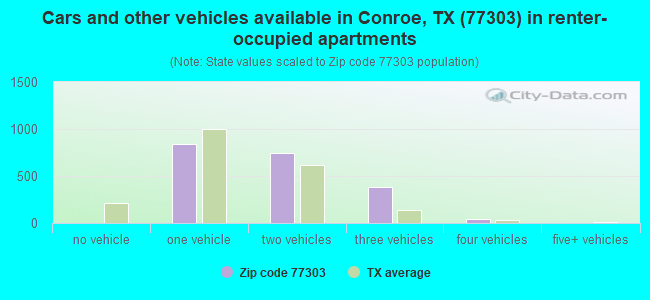
Houses and condos: 8,989 Renter-occupied apartments: 2,030
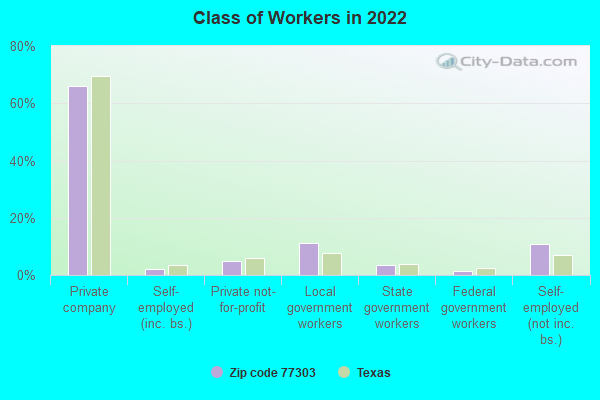
% of renters here:
24%
State:
38%
March 2022 cost of living index in zip code 77303: 87.3 (less than average, U.S. average is 100)
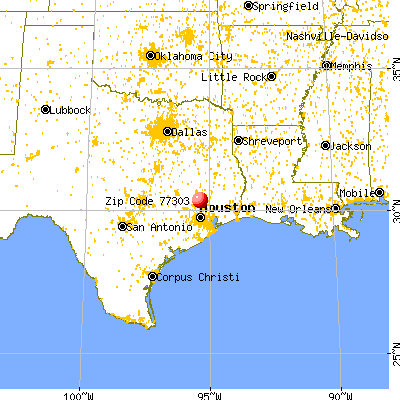
Land area: 61.8 sq. mi. Water area: 0.2 sq. mi.
Population density: 400 people per square mile
(low).
OSM Map
General Map
Google Map
MSN Map
OSM Map
General Map
Google Map
MSN Map
OSM Map
General Map
Google Map
MSN Map
OSM Map
General Map
Google Map
MSN Map
Please wait while loading the map...
Real estate property taxes paid for housing units in 2022:
This zip code:
1.1% ($2,441)
Texas:
1.5% ($4,050)
Median real estate property taxes paid for housing units with mortgages in 2022: $3,638 (1.3%) Median real estate property taxes paid for housing units with no mortgage in 2022: $1,356 (0.9%)
Averages for the 2020 tax year for zip code 77303, filed in 2021:
Average Adjusted Gross Income (AGI) in 2020: $55,773 (Individual Income Tax Returns)
Here:
$55,773
State:
$77,054
Salary/wage: $50,783 (reported on 82.3% of returns)
Here:
$50,783
State:
$62,766
(% of AGI for various income ranges: 1155.2% for AGIs below $25k, 3497.5% for AGIs $25k-50k, 6417.3% for AGIs $50k-75k, 9212.4% for AGIs $75k-100k, 16781.6% for AGIs $100k-200k, 47212.5% for AGIs over 200k)
Taxable interest for individuals: $1,150 (reported on 14.7% of returns)
This zip code:
$1,150
Texas:
$2,665
(% of AGI for various income ranges: 5.3% for AGIs below $25k, 11.0% for AGIs $25k-50k, 14.3% for AGIs $50k-75k, 25.4% for AGIs $75k-100k, 45.5% for AGIs $100k-200k, 702.5% for AGIs over 200k)
Ordinary dividends: $3,370 (reported on 7.6% of returns)
Here:
$3,370
State:
$10,044
(% of AGI for various income ranges: 8.2% for AGIs below $25k, 19.1% for AGIs $25k-50k, 31.7% for AGIs $50k-75k, 39.8% for AGIs $75k-100k, 92.5% for AGIs $100k-200k, 648.8% for AGIs over 200k)
Net capital gain/loss in AGI: +$8,314 (reported on 7.8% of returns)
Here:
+$8,314
State:
+$39,590
(% of AGI for various income ranges: 3.0% for AGIs below $25k, 16.7% for AGIs $25k-50k, 33.6% for AGIs $50k-75k, 76.0% for AGIs $75k-100k, 195.3% for AGIs $100k-200k, 4200.0% for AGIs over 200k)
Profit/loss from business: +$8,504 (reported on 23.2% of returns)
Here:
+$8,504
State:
+$10,888
(% of AGI for various income ranges: 255.6% for AGIs below $25k, 216.1% for AGIs $25k-50k, 195.5% for AGIs $50k-75k, 241.0% for AGIs $75k-100k, 258.9% for AGIs $100k-200k, 2273.8% for AGIs over 200k)
Taxable individual retirement arrangement distribution: $18,106 (reported on 5.0% of returns)
77303:
$18,106
Texas:
$24,740
(% of AGI for various income ranges: 31.7% for AGIs below $25k, 41.0% for AGIs $25k-50k, 115.7% for AGIs $50k-75k, 193.5% for AGIs $75k-100k, 367.2% for AGIs $100k-200k, 2100.0% for AGIs over 200k)
Total itemized deductions: $35,547 (reported on 5.0% of returns)
Here:
$35,547
State:
$40,428
(% of AGI for various income ranges: 26.8% for AGIs below $25k, 98.8% for AGIs $25k-50k, 206.2% for AGIs $50k-75k, 354.4% for AGIs $75k-100k, 653.9% for AGIs $100k-200k, 5902.5% for AGIs over 200k)
Charity contributions: $14,116 (reported on 4.0% of returns)
Here:
$14,116
State:
$18,201
(% of AGI for various income ranges: 25.6% for AGIs $25k-50k, 41.2% for AGIs $50k-75k, 88.1% for AGIs $75k-100k, 202.9% for AGIs $100k-200k, 2747.5% for AGIs over 200k)
Taxes paid: $7,023 (reported on 4.7% of returns)
77303:
$7,023
State:
$7,821
(% of AGI for various income ranges: 4.3% for AGIs below $25k, 22.0% for AGIs $25k-50k, 41.5% for AGIs $50k-75k, 82.7% for AGIs $75k-100k, 138.0% for AGIs $100k-200k, 680.0% for AGIs over 200k)
Earned income credit: $2,689 (reported on 21.4% of returns)
Here:
$2,689
State:
$2,584
(% of AGI for various income ranges: 132.2% for AGIs below $25k, 92.4% for AGIs $25k-50k, 1.8% for AGIs $50k-75k)
Percentage of individuals using paid preparers for their 2020 taxes: 91.0%
Here:
91%
State:
92%
(% for various income ranges: 88.5% for AGIs below $25k, 92.7% for AGIs $25k-50k, 93.0% for AGIs $50k-75k, 91.4% for AGIs $75k-100k, 92.1% for AGIs $100k-200k, 90.0% for AGIs over 200k)
Averages for the 2012 tax year for zip code 77303, filed in 2013:
Average Adjusted Gross Income (AGI) in 2012: $45,842 (Individual Income Tax Returns)
Here:
$45,842
State:
$65,384
Salary/wage: $42,257 (reported on 85.9% of returns)
Here:
$42,257
State:
$52,524
(% of AGI for various income ranges: 79.1% for AGIs below $25k, 86.2% for AGIs $25k-50k, 85.0% for AGIs $50k-75k, 84.8% for AGIs $75k-100k, 82.3% for AGIs $100k-200k, 40.9% for AGIs over 200k)
Taxable interest for individuals: $846 (reported on 16.8% of returns)
This zip code:
$846
Texas:
$2,372
(% of AGI for various income ranges: 0.5% for AGIs below $25k, 0.4% for AGIs $25k-50k, 0.2% for AGIs $50k-75k, 0.3% for AGIs $75k-100k, 0.2% for AGIs $100k-200k, 0.2% for AGIs over 200k)
Ordinary dividends: $2,942 (reported on 7.5% of returns)
Here:
$2,942
State:
$9,721
(% of AGI for various income ranges: 0.7% for AGIs below $25k, 0.4% for AGIs $25k-50k, 0.5% for AGIs $50k-75k, 0.2% for AGIs $75k-100k, 0.3% for AGIs $100k-200k, 1.2% for AGIs over 200k)
Net capital gain/loss in AGI: +$4,451 (reported on 6.1% of returns)
Here:
+$4,451
State:
+$35,319
(% of AGI for various income ranges: 0.1% for AGIs $25k-50k, 0.1% for AGIs $50k-75k, 0.4% for AGIs $75k-100k, 0.9% for AGIs $100k-200k, 3.0% for AGIs over 200k)
Profit/loss from business: +$11,773 (reported on 19.5% of returns)
Here:
+$11,773
State:
+$13,732
(% of AGI for various income ranges: 11.8% for AGIs below $25k, 4.3% for AGIs $25k-50k, 2.2% for AGIs $50k-75k, 2.2% for AGIs $75k-100k, 4.6% for AGIs $100k-200k, 9.0% for AGIs over 200k)
Taxable individual retirement arrangement distribution: $14,705 (reported on 6.0% of returns)
77303:
$14,705
Texas:
$19,511
(% of AGI for various income ranges: 1.7% for AGIs below $25k, 1.6% for AGIs $25k-50k, 1.6% for AGIs $50k-75k, 2.0% for AGIs $75k-100k, 3.6% for AGIs $100k-200k)
Total itemized deductions: $19,692 (23% of AGI, reported on 18.7% of returns)
Here:
$19,692
State:
$24,724
Here:
22.5% of AGI
State:
15.9% of AGI
(% of AGI for various income ranges: 4.9% for AGIs below $25k, 7.4% for AGIs $25k-50k, 8.4% for AGIs $50k-75k, 9.2% for AGIs $75k-100k, 9.2% for AGIs $100k-200k, 7.7% for AGIs over 200k)
Charity contributions: $4,418 (reported on 13.1% of returns)
Here:
$4,418
State:
$6,808
(% of AGI for various income ranges: 0.5% for AGIs below $25k, 0.9% for AGIs $25k-50k, 1.3% for AGIs $50k-75k, 1.4% for AGIs $75k-100k, 1.8% for AGIs $100k-200k, 1.5% for AGIs over 200k)
Taxes paid: $3,943 (reported on 18.2% of returns)
77303:
$3,943
State:
$6,921
(% of AGI for various income ranges: 0.8% for AGIs below $25k, 1.3% for AGIs $25k-50k, 1.5% for AGIs $50k-75k, 2.1% for AGIs $75k-100k, 2.2% for AGIs $100k-200k, 1.3% for AGIs over 200k)
Earned income credit: $2,534 (reported on 24.5% of returns)
Here:
$2,534
State:
$2,570
(% of AGI for various income ranges: 8.6% for AGIs below $25k, 1.6% for AGIs $25k-50k)
Percentage of individuals using paid preparers for their 2012 taxes: 46.3%
Here:
46%
State:
51%
(% for various income ranges: 45.7% for AGIs below $25k, 45.5% for AGIs $25k-50k, 46.0% for AGIs $50k-75k, 43.3% for AGIs $75k-100k, 51.9% for AGIs $100k-200k, 75.0% for AGIs over 200k)
Averages for the 2004 tax year for zip code 77303, filed in 2005:
Average Adjusted Gross Income (AGI) in 2004: $34,996 (Individual Income Tax Returns)
Here:
$34,996
State:
$47,881
Salary/wage: $34,372 (reported on 86.8% of returns)
Here:
$34,372
State:
$41,947
(% of AGI for various income ranges: 127.9% for AGIs below $10k, 82.7% for AGIs $10k-25k, 87.7% for AGIs $25k-50k, 89.3% for AGIs $50k-75k, 86.8% for AGIs $75k-100k, 69.0% for AGIs over 100k)
Taxable interest for individuals: $1,043 (reported on 25.3% of returns)
This zip code:
$1,043
Texas:
$2,255
(% of AGI for various income ranges: 2.8% for AGIs below $10k, 1.0% for AGIs $10k-25k, 0.8% for AGIs $25k-50k, 0.4% for AGIs $50k-75k, 0.7% for AGIs $75k-100k, 0.8% for AGIs over 100k)
Taxable dividends: $2,536 (reported on 10.6% of returns)
Here:
$2,536
State:
$4,261
(% of AGI for various income ranges: 1.6% for AGIs below $10k, 0.7% for AGIs $10k-25k, 0.2% for AGIs $25k-50k, 0.5% for AGIs $50k-75k, 0.3% for AGIs $75k-100k, 2.7% for AGIs over 100k)
Net capital gain/loss: +$3,406 (reported on 8.5% of returns)
Here:
+$3,406
State:
+$16,110
(% of AGI for various income ranges: 1.5% for AGIs below $10k, 0.2% for AGIs $10k-25k, -0.0% for AGIs $25k-50k, 0.5% for AGIs $50k-75k, 0.1% for AGIs $75k-100k, 4.1% for AGIs over 100k)
Profit/loss from business: +$7,216 (reported on 18.7% of returns)
Here:
+$7,216
State:
+$11,013
(% of AGI for various income ranges: 20.3% for AGIs below $10k, 8.3% for AGIs $10k-25k, 2.8% for AGIs $25k-50k, 2.1% for AGIs $50k-75k, 3.4% for AGIs $75k-100k, 3.3% for AGIs over 100k)
IRA payment deduction: $2,701 (reported on 1.3% of returns)
77303:
$2,701
Texas:
$3,120
(% of AGI for various income ranges: 0.1% for AGIs $10k-25k, 0.1% for AGIs $25k-50k, 0.2% for AGIs $50k-75k, 0.1% for AGIs over 100k)
Total itemized deductions: $15,705 (26% of AGI, reported on 18.5% of returns)
Here:
$15,705
State:
$19,631
Here:
25.7% of AGI
State:
18.9% of AGI
(% of AGI for various income ranges: 11.3% for AGIs below $10k, 5.9% for AGIs $10k-25k, 7.8% for AGIs $25k-50k, 7.8% for AGIs $50k-75k, 8.8% for AGIs $75k-100k, 11.5% for AGIs over 100k)
Charity contributions deductions: $3,280 (5% of AGI, reported on 13.9% of returns)
Here:
$3,280
State:
$4,753
Here:
5.0% of AGI
State:
4.2% of AGI
(% of AGI for various income ranges: 0.4% for AGIs below $10k, 0.7% for AGIs $10k-25k, 1.1% for AGIs $25k-50k, 1.4% for AGIs $50k-75k, 1.4% for AGIs $75k-100k, 2.2% for AGIs over 100k)
Total tax: $4,216 (reported on 71.6% of returns)
77303:
$4,216
State:
$9,058
(% of AGI for various income ranges: 4.5% for AGIs below $10k, 3.9% for AGIs $10k-25k, 6.2% for AGIs $25k-50k, 8.5% for AGIs $50k-75k, 10.9% for AGIs $75k-100k, 16.1% for AGIs over 100k)
Earned income credit: $1,993 (reported on 22.8% of returns)
Here:
$1,993
State:
$2,024
Percentage of individuals using paid preparers for their 2004 taxes: 51.2%
Here:
51%
State:
57%
(% for various income ranges: 44.4% for AGIs below $10k, 56.7% for AGIs $10k-25k, 52.9% for AGIs $25k-50k, 47.3% for AGIs $50k-75k, 48.9% for AGIs $75k-100k, 55.2% for AGIs over 100k)
Household received Food Stamps/SNAP in the past 12 months: 1,290 Household did not receive Food Stamps/SNAP in the past 12 months: 7,181
Women who had a birth in the past 12 months: 779 (383 now married, 386 unmarried) Women who did not have a birth in the past 12 months: 4,752 (2,938 now married, 1,787 unmarried)
Housing units in zip code 77303 with a mortgage: 3,743 (70 second mortgage, 49 both second mortgage and home equity loan) Median monthly owner costs for units with a mortgage: $1,595 Median monthly owner costs for units without a mortgage: $474
Residents with income below the poverty level in 2022:
This zip code:
14.1%
Whole state:
14.0%
Residents with income below 50% of the poverty level in 2022:
This zip code:
9.4%
Whole state:
7.4%
Median number of rooms in houses and condos:
Here:
6.0
State:
6.3
Median number of rooms in apartments:
Here:
4.0
State:
4.0
Notable locations in this zip code not listed on our city pages
Notable locations in zip code 77303: Prime Outlets at Conroe (A), 7 Mile Caney (B), Camp Anges Arnold (C), Camp Agnes Arnold (D), Conroe Fire Department Station 5 (E), North Montgomery County Fire Department Station 93 (F). Display/hide their locations on the map
Reservoirs and swamps: Bart Lake (A), Farrells Lake (B), Royal Forest Lake (C), Spring Lake (D), McRae Lake (E), Shadow Lake (F), Hazel Pond (G). Display/hide their locations on the map
In group quarters: 40 (-1 institutionalized population)
Size of family households: 2,665 2-persons, 1,345 3-persons, 1,329 4-persons, 657 5-persons, 393 6-persons, 163 7-or-more-persons
Size of nonfamily households: 1,291 1-person, 510 2-persons, 66 3-persons
4,232 married couples with children.
1,518 single-parent households (270 men, 1,248 women).
68.6% of residents of 77303 zip code speak English at home.
30.1% of residents speak Spanish at home (66% very well, 19% well, 12% not well, 3% not at all).
0.1% of residents speak other Indo-European language at home (100% very well).
0.6% of residents speak Asian or Pacific Island language at home (62% very well, 26% well, 12% not well).
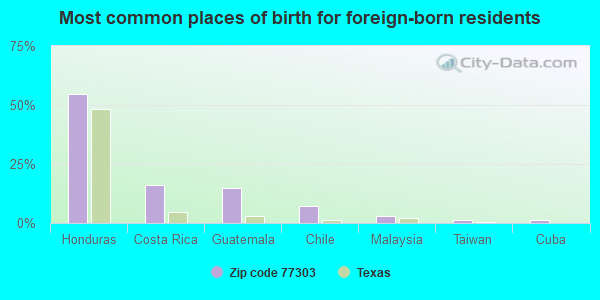
Foreign born population: 3,139 (12.7%) (29.1% of them are naturalized citizens)
This zip code:
12.7%
Whole state:
17.2%
55%Honduras
16%Costa Rica
15%Guatemala
7%Chile
3%Malaysia
1%Taiwan
1%Cuba
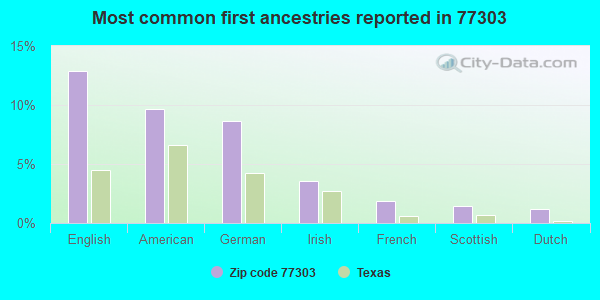
13%English
10%American
9%German
4%Irish
2%French
1%Scottish
1%Dutch
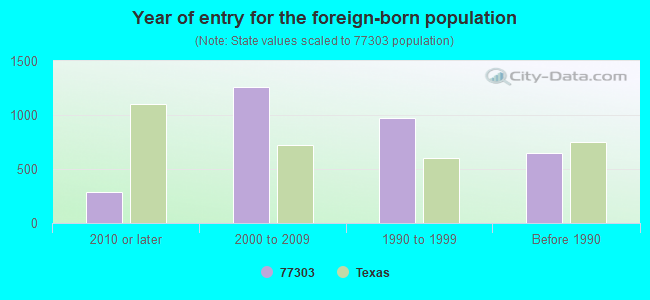
Year of entry for the foreign-born population
2912010 or later
1,2612000 to 2009
9741990 to 1999
647Before 1990
Facilities with environmental interests located in this zip code:
AIRBRUSH IMAGES INC (850 N FM 3083 in CONROE, TX)
Conditionally Exempt Small Quantity Generators, less than 100 kg/month of hazardous waste (Resource Conservation and Recovery Act (tracking hazardous waste)) - notification
ASF HOUSTON (4724 SOUTH PARKWAY in CONROE, TX) . Federal Facility. U.S. ARMY
Conditionally Exempt Small Quantity Generators, less than 100 kg/month of hazardous waste (Resource Conservation and Recovery Act (tracking hazardous waste)) - notification Organizations: 90TH ARCOM USAR AVIATION SUPPORT FACILIT (CONTACT/OPERATOR)
Alternative names: US AR 90TH ARCOM ASF HOUSTON
ARROWHEAD INDUSTRIAL WATER GULF (999 N FM 3083 in CONROE, TX)
Small Quantity Generators, between 100 kg and 1000 kg of hazardous waste/month (Resource Conservation and Recovery Act (tracking hazardous waste)) - notification Organizations: BF GOODRICH CO (CONTACT/OWNER)
ARROWHEAD INDUSTRIAL WATER (9200 FM 3983 in CONROE, TX)
TRI REPORTER (Tracking of toxic chemicals releasing facilities) Business SIC classification: SERVICE INDUSTRY MACHINERY; INDUSTRIAL INSTRUMENTS FOR MEASUREMENT, DISPLAY, AND CONTROL OF PROCESS VARIABLES; AND RELATED PRODUCTS
Housing units lacking complete plumbing facilities: 1.0% Housing units lacking complete kitchen facilities: 0.5%
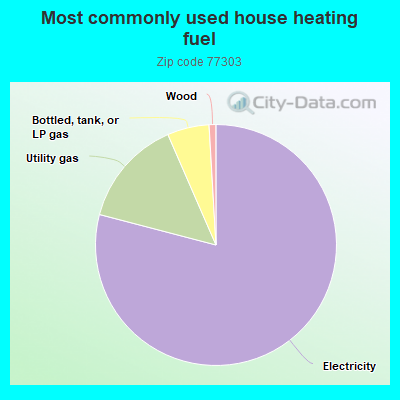
78.6%Electricity
14.3%Utility gas
5.6%Bottled, tank, or LP gas
0.9%Wood
Population in 1990: 14,683.
Place of birth for U.S.-born residents:
This state: 15,354
Northeast: 527
Midwest: 1,745
South: 1,878
West: 1,884
50% of the 77303 zip code residents lived in the same house 5 years ago. Out of people who lived in different houses, 56% lived in this county. Out of people who lived in different counties, 50% lived in Texas.
88% of the 77303 zip code residents lived in the same house 1 year ago. Out of people who lived in different houses, 71% moved from this county. Out of people who lived in different houses, 17% moved from different county within same state. Out of people who lived in different houses, 6% moved from different state. Out of people who lived in different houses, 2% moved from abroad.
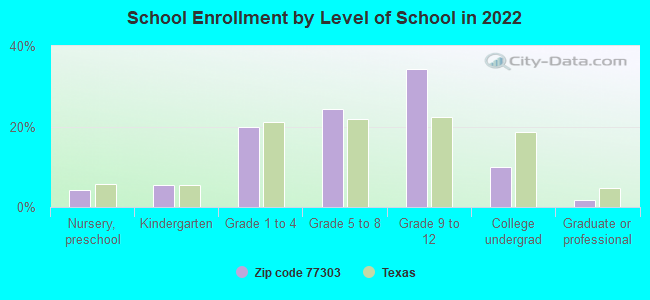
Private vs. public school enrollment:
Students in private schools in grades 1 to 8 (elementary and middle school): 296
Here:
11.5%
Texas:
8.8%
Students in private schools in grades 9 to 12 (high school): 124
Here:
6.2%
Texas:
8.0%
Students in private undergraduate colleges: 107
Here:
18.4%
Texas:
16.2%
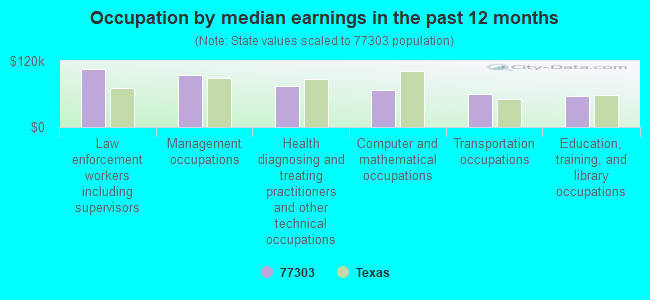
Occupation by median earnings in the past 12 months ($)
104,565Law enforcement workers including supervisors
94,705Management occupations
74,408Health diagnosing and treating practitioners and other technical occupations
67,924Computer and mathematical occupations
59,675Transportation occupations
56,711Education, training, and library occupations
Companies with federal contracts located in this zip code (CONROE, TX):
W J HOLLEY ENTERPRISES INC (MONTGOMERY COUNTY AIRPORT; small business)
$929,315 with Defense Logistics Agency for Liquid Propellants and Fuels, Petroleum Base. Signed on 2001-06-01. Completion date: 2004-03-31.
TISDALE AIR CONDITIONING & HEA (5111 N FRAZIER ST; small business) : $389,120 in 3 contractsin 2006
$354,435 with Army for Air Conditioning Equipment. Signed on 2006-03-06. Completion date: 2006-06-13.
$32,385, same as above.Signed on 2006-03-22. Completion date: 2006-06-13.
$2,300, same as above.Signed on 2006-04-19. Completion date: 2006-06-13.
HOFFLAND ENVIRONMENTAL INC (10391 SILVER SPRINGS RD; small business) : $141,706 in 4 contractsfrom 2000 to 2005
$68,480 with Army for Water Purification Equipment. Signed on 2000-02-16. Completion date: 2001-05-31.
$60,640, same as above.Signed on 2005-06-16. Completion date: 2005-09-23.
$12,540 with Army for Centrifugals, Separators, and Pressure and Vacuum Filters. Signed on 2003-08-07. Completion date: 2003-09-17.
$46 with Army for Laboratory Equipment and Supplies. Signed on 2002-06-13. Completion date: 2002-07-08.
S E P S (9760 WHISPERING PINES CMTR; small business) : $42,036 in 6 contractsfrom 2003 to 2005
Contracts for Photographic Supplies, Floor Polishers and Vacuum Cleaning Equipment, Clean Work Stations, Controlled Environment and Related Equipment, Non-nuclear Ship Repair (West) Ship repair (including overhauls and conversions) performed on. non-nuclear propelled and nonpropelled ships west of the 108th meridian by Air Force, Army, U.S. Army Corps of Engineers - civil program financing only, Navy, and others Signed by year:2000: $0; 2001: $0; 2002: $0; 2003: $7,145; 2004: $15,962; 2005: $18,929; 2006: $0.
Biggest contracts:
$15,962 with Air Force for Photographic Supplies. Taking place in GA. Signed on 2004-10-26. Completion date: 2004-11-30.
$7,145 with Army for Floor Polishers and Vacuum Cleaning Equipment. Signed on 2003-12-08. Completion date: 2004-01-09.
$5,163 with U.S. Army Corps of Engineers - civil program financing only for Floor Polishers and Vacuum Cleaning Equipment. Signed on 2005-02-09. Completion date: 2005-03-03.
$5,163 with Army for Floor Polishers and Vacuum Cleaning Equipment. Signed on 2005-02-09. Completion date: 2005-03-03.
Top industries in this zip code by the number of employees in 2005:
Construction: Highway, Street, and Bridge Construction (100-249 employees: 1 establishment, 1-4 employees: 1 establishment)
Construction: Water and Sewer Line and Related Structures Construction (100-249: 1)
Accommodation and Food Services: Limited-Service Restaurants (20-49: 4, 10-19: 1)
Accommodation and Food Services: Full-Service Restaurants (50-99: 1, 20-49: 1)
People in group quarters in 2010:
15 people in emergency and transitional shelters (with sleeping facilities) for people experiencing homelessness
6 people in group homes intended for adults
3 people in residential treatment centers for juveniles (non-correctional)
People in group quarters in 2000:
22 people in other noninstitutional group quarters
8 people in nursing homes
6 people in homes for the mentally retarded
Fatal accident statistics in 2014:
Fatal accident count: 3
Vehicles involved in fatal accidents: 5
Fatal accidents caused by drunken drivers: 2
Fatalities: 3
Persons involved in fatal accidents: 5
Pedestrians involved in fatal accidents: 0
Fatal accident statistics in 2013:
Fatal accident count: 4
Vehicles involved in fatal accidents: 7
Fatal accidents caused by drunken drivers: 1
Fatalities: 4
Persons involved in fatal accidents: 10
Pedestrians involved in fatal accidents: 0
Home Mortgage Disclosure Act Aggregated Statistics For Year 2009 (Based on 2 full and 6 partial tracts)
A) FHA, FSA/RHS & VA Home Purchase Loans
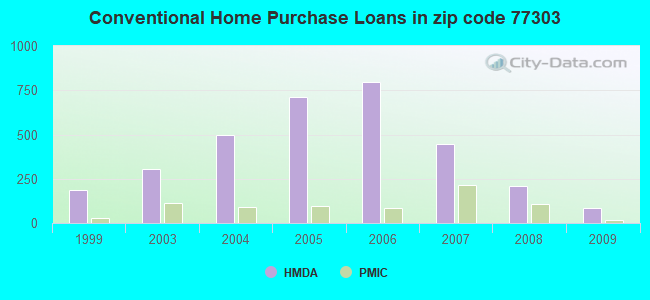
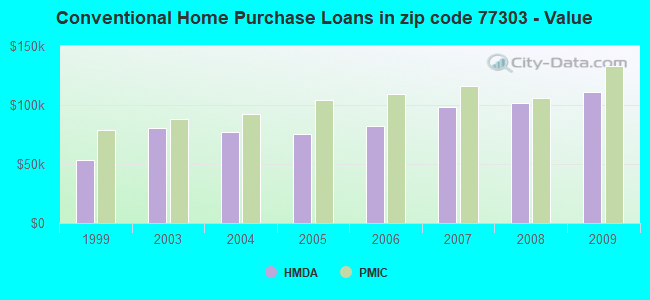
B) Conventional Home Purchase Loans
C) Refinancings
D) Home Improvement Loans
F) Non-occupant Loans on < 5 Family Dwellings (A B C & D)
G) Loans On Manufactured Home Dwelling (A B C & D)
Number
Average Value
Number
Average Value
Number
Average Value
Number
Average Value
Number
Average Value
Number
Average Value
LOANS ORIGINATED
146
$120,349
84
$110,692
177
$129,114
15
$36,251
46
$115,552
16
$60,531
APPLICATIONS APPROVED, NOT ACCEPTED
10
$125,452
4
$98,250
25
$119,949
7
$29,090
2
$260,435
6
$40,798
APPLICATIONS DENIED
24
$122,764
28
$92,495
159
$109,060
66
$19,572
10
$41,044
30
$48,007
APPLICATIONS WITHDRAWN
8
$106,229
15
$167,244
58
$132,427
5
$98,236
5
$168,174
6
$91,260
FILES CLOSED FOR INCOMPLETENESS
1
$131,870
4
$62,125
20
$125,768
2
$71,145
3
$65,060
6
$57,340
Aggregated Statistics For Year 2008 (Based on 2 full and 6 partial tracts)
A) FHA, FSA/RHS & VA Home Purchase Loans
B) Conventional Home Purchase Loans
C) Refinancings
D) Home Improvement Loans
F) Non-occupant Loans on < 5 Family Dwellings (A B C & D)
G) Loans On Manufactured Home Dwelling (A B C & D)
Number
Average Value
Number
Average Value
Number
Average Value
Number
Average Value
Number
Average Value
Number
Average Value
LOANS ORIGINATED
175
$117,312
208
$101,995
148
$113,542
43
$43,231
66
$78,156
40
$66,202
APPLICATIONS APPROVED, NOT ACCEPTED
8
$118,295
29
$91,846
33
$88,955
7
$44,749
3
$68,540
11
$62,170
APPLICATIONS DENIED
42
$112,114
82
$98,159
209
$106,347
123
$30,074
24
$79,112
38
$49,735
APPLICATIONS WITHDRAWN
32
$112,793
32
$111,996
77
$112,921
6
$46,948
8
$86,926
5
$41,198
FILES CLOSED FOR INCOMPLETENESS
4
$98,958
19
$92,502
19
$126,911
6
$48,923
4
$119,192
3
$53,187
Aggregated Statistics For Year 2007 (Based on 2 full and 6 partial tracts)
A) FHA, FSA/RHS & VA Home Purchase Loans
B) Conventional Home Purchase Loans
C) Refinancings
D) Home Improvement Loans
F) Non-occupant Loans on < 5 Family Dwellings (A B C & D)
G) Loans On Manufactured Home Dwelling (A B C & D)
Number
Average Value
Number
Average Value
Number
Average Value
Number
Average Value
Number
Average Value
Number
Average Value
LOANS ORIGINATED
64
$107,395
449
$98,116
163
$106,899
71
$48,585
65
$79,609
56
$63,115
APPLICATIONS APPROVED, NOT ACCEPTED
2
$151,965
94
$79,457
40
$95,221
12
$26,308
14
$75,812
25
$52,546
APPLICATIONS DENIED
16
$114,788
177
$80,803
354
$97,737
161
$29,881
55
$70,278
78
$57,616
APPLICATIONS WITHDRAWN
11
$106,056
74
$103,102
166
$102,954
19
$51,907
13
$82,007
5
$55,900
FILES CLOSED FOR INCOMPLETENESS
3
$113,517
26
$96,503
45
$116,493
4
$52,765
2
$84,185
3
$89,323
Aggregated Statistics For Year 2006 (Based on 2 full and 6 partial tracts)
A) FHA, FSA/RHS & VA Home Purchase Loans
B) Conventional Home Purchase Loans
C) Refinancings
D) Home Improvement Loans
F) Non-occupant Loans on < 5 Family Dwellings (A B C & D)
G) Loans On Manufactured Home Dwelling (A B C & D)
Number
Average Value
Number
Average Value
Number
Average Value
Number
Average Value
Number
Average Value
Number
Average Value
LOANS ORIGINATED
76
$114,693
799
$82,503
188
$92,726
41
$25,814
156
$77,723
70
$63,362
APPLICATIONS APPROVED, NOT ACCEPTED
20
$98,285
194
$90,679
52
$96,265
11
$58,402
37
$84,886
69
$56,846
APPLICATIONS DENIED
19
$83,491
356
$79,500
275
$88,131
132
$29,591
45
$65,950
141
$48,685
APPLICATIONS WITHDRAWN
14
$99,305
122
$78,023
144
$97,238
14
$46,488
33
$74,598
12
$43,073
FILES CLOSED FOR INCOMPLETENESS
4
$86,582
47
$90,873
57
$97,600
4
$30,102
8
$56,944
3
$66,153
Aggregated Statistics For Year 2005 (Based on 2 full and 6 partial tracts)
A) FHA, FSA/RHS & VA Home Purchase Loans
B) Conventional Home Purchase Loans
C) Refinancings
D) Home Improvement Loans
F) Non-occupant Loans on < 5 Family Dwellings (A B C & D)
G) Loans On Manufactured Home Dwelling (A B C & D)
Number
Average Value
Number
Average Value
Number
Average Value
Number
Average Value
Number
Average Value
Number
Average Value
LOANS ORIGINATED
88
$97,775
711
$75,602
263
$91,947
64
$42,405
90
$56,931
82
$59,153
APPLICATIONS APPROVED, NOT ACCEPTED
13
$76,695
154
$66,658
50
$76,381
7
$46,377
13
$64,916
56
$45,758
APPLICATIONS DENIED
25
$94,148
328
$68,978
379
$78,337
160
$36,195
52
$59,328
153
$48,401
APPLICATIONS WITHDRAWN
6
$87,988
176
$80,869
177
$109,985
58
$141,895
68
$82,378
11
$40,246
FILES CLOSED FOR INCOMPLETENESS
1
$111,180
27
$84,899
128
$87,725
0
$0
7
$79,731
2
$25,040
Aggregated Statistics For Year 2004 (Based on 2 full and 6 partial tracts)
A) FHA, FSA/RHS & VA Home Purchase Loans
B) Conventional Home Purchase Loans
C) Refinancings
D) Home Improvement Loans
E) Loans on Dwellings For 5+ Families
F) Non-occupant Loans on < 5 Family Dwellings (A B C & D)
G) Loans On Manufactured Home Dwelling (A B C & D)
Number
Average Value
Number
Average Value
Number
Average Value
Number
Average Value
Number
Average Value
Number
Average Value
Number
Average Value
LOANS ORIGINATED
52
$90,228
500
$77,333
348
$86,012
60
$29,270
2
$1,833,600
77
$60,489
84
$59,855
APPLICATIONS APPROVED, NOT ACCEPTED
7
$70,674
106
$73,098
75
$77,205
15
$46,460
0
$0
9
$54,097
50
$41,575
APPLICATIONS DENIED
16
$94,395
250
$63,778
421
$78,777
124
$29,594
0
$0
41
$74,996
116
$46,462
APPLICATIONS WITHDRAWN
12
$87,951
75
$75,301
164
$84,076
9
$45,076
0
$0
12
$58,222
15
$74,071
FILES CLOSED FOR INCOMPLETENESS
1
$133,680
33
$84,009
107
$89,409
1
$132,360
0
$0
2
$80,280
2
$62,075
Aggregated Statistics For Year 2003 (Based on 2 full and 6 partial tracts)
A) FHA, FSA/RHS & VA Home Purchase Loans
B) Conventional Home Purchase Loans
C) Refinancings
D) Home Improvement Loans
F) Non-occupant Loans on < 5 Family Dwellings (A B C & D)
Number
Average Value
Number
Average Value
Number
Average Value
Number
Average Value
Number
Average Value
LOANS ORIGINATED
96
$93,144
303
$80,569
493
$82,174
66
$22,173
44
$58,152
APPLICATIONS APPROVED, NOT ACCEPTED
4
$101,342
73
$59,658
76
$83,256
20
$26,817
8
$50,318
APPLICATIONS DENIED
26
$79,021
157
$76,783
435
$75,450
89
$17,098
42
$103,670
APPLICATIONS WITHDRAWN
8
$98,294
47
$90,380
204
$80,496
8
$30,074
14
$97,265
FILES CLOSED FOR INCOMPLETENESS
3
$103,003
12
$81,660
35
$104,703
2
$47,750
4
$46,162
Aggregated Statistics For Year 1999 (Based on 1 full and 3 partial tracts)
A) FHA, FSA/RHS & VA Home Purchase Loans
B) Conventional Home Purchase Loans
C) Refinancings
D) Home Improvement Loans
F) Non-occupant Loans on < 5 Family Dwellings (A B C & D)
2002 - 2018 National Fire Incident Reporting System (NFIRS) incidents
Based on the data from the years 2002 - 2018 the average number of fires per year is 44. The highest number of reported fires - 83 took place in 2005, and the least - 0 in 2009. The data has an increasing trend.
When looking into fire subcategories, the most incidents belonged to: Outside Fires (52.9%), and Structure Fires (33.9%).
Fire incident types reported to NFIRS in Zip Code 77303


 Nearest zip codes: 77301, 77378, 77306, 77304, 77302, 77318.


 Based on the data from the years 2002 - 2018 the average number of fires per year is 44. The highest number of reported fires - 83 took place in 2005, and the least - 0 in 2009. The data has an increasing trend.
 When looking into fire subcategories, the most incidents belonged to: Outside Fires (52.9%), and Structure Fires (33.9%).