Estimated zip code population in 2022: 6,804 Zip code population in 2010: 4,600 Zip code population in 2000: 3,144
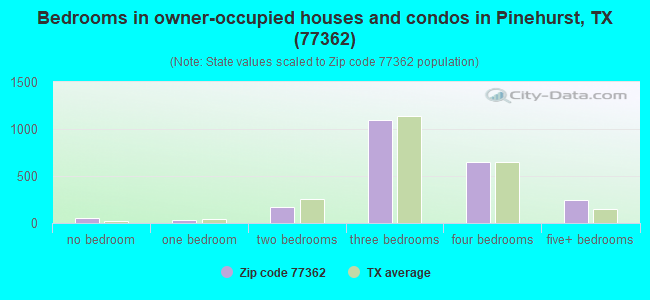
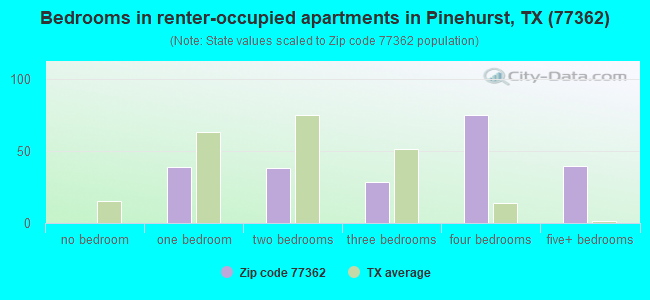
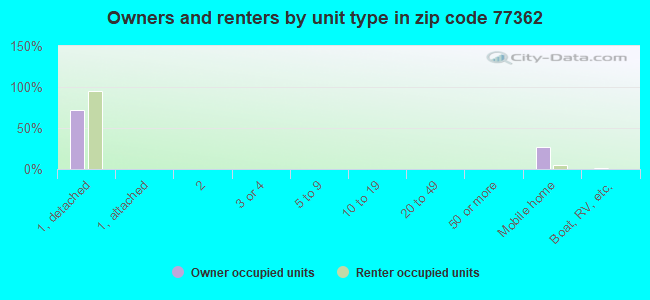
Houses and condos: 2,561 Renter-occupied apartments: 220
% of renters here:
9%
State:
38%
March 2022 cost of living index in zip code 77362: 96.3 (near average, U.S. average is 100)
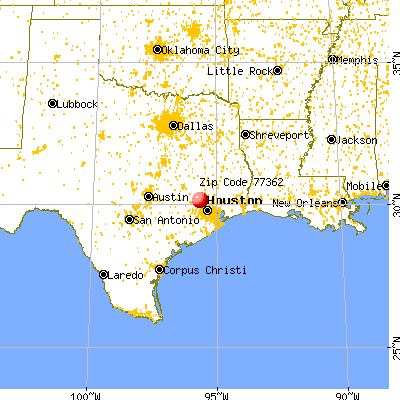
Land area: 8.1 sq. mi. Water area: 0.0 sq. mi.
Population density: 835 people per square mile
(low).
OSM Map
General Map
Google Map
MSN Map
OSM Map
General Map
Google Map
MSN Map
OSM Map
General Map
Google Map
MSN Map
OSM Map
General Map
Google Map
MSN Map
Please wait while loading the map...
Real estate property taxes paid for housing units in 2022:
This zip code:
1.3% ($3,561)
Texas:
1.5% ($4,050)
Median real estate property taxes paid for housing units with mortgages in 2022: $7,634 (1.9%) Median real estate property taxes paid for housing units with no mortgage in 2022: $1,347 (1.2%)
Business Search- 14 Million verified businesses
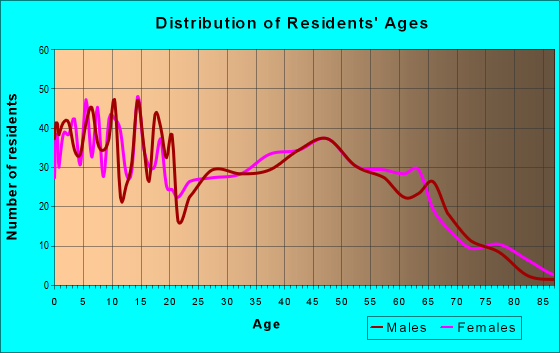
Males: 3,564
(52.4%)
Females: 3,240
(47.6%)
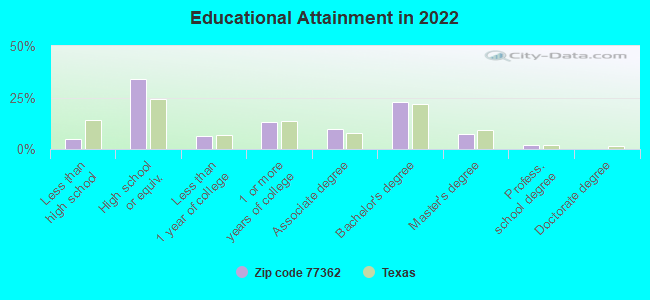
For population 25 years and over in 77362:
High school or higher: 95.5%
Bachelor's degree or higher: 31.9%
Graduate or professional degree: 9.0%
Unemployed: 4.4%
Mean travel time to work (commute): 36.0 minutes
For population 15 years and over in 77362:
Never married: 28.8%
Now married: 52.1%
Separated: 3.6%
Widowed: 7.8%
Divorced: 7.6%
Zip code 77362 compared to state average:
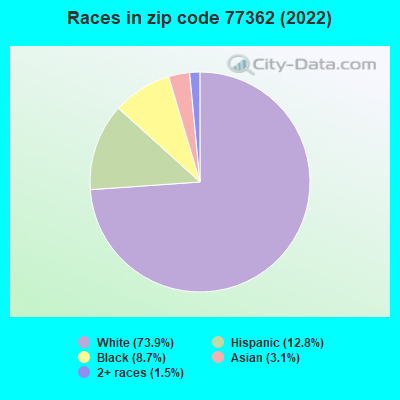
Hispanic race population percentage significantly below state average.
Median age above state average.
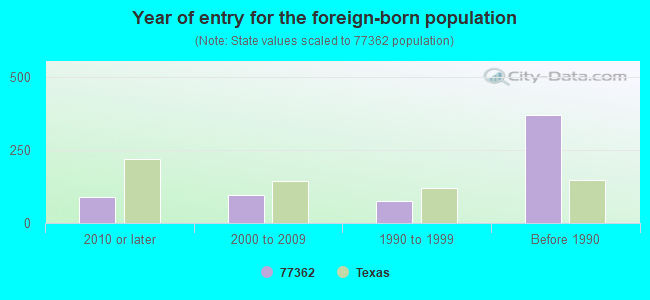
Foreign-born population percentage below state average.
Renting percentage significantly below state average.
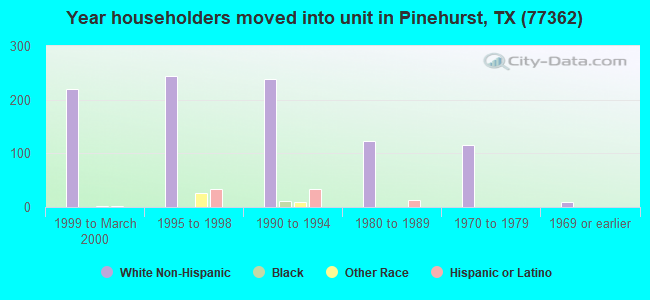
Length of stay since moving in significantly below state average.
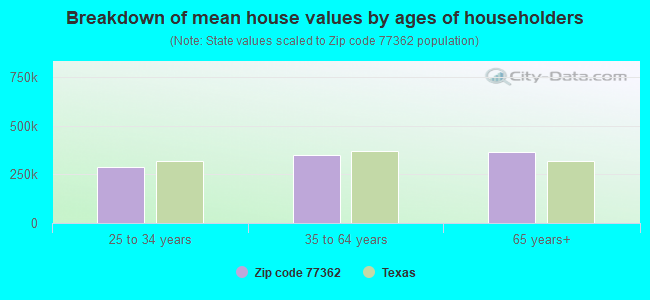
Estimated median house/condo value in 2022: $284,773
77362:
$284,773
Texas:
$275,400
According to our research of Texas and other state lists, there were 10 registered sex offenders living in 77362 zip code as of June 16, 2024. The ratio of all residents to sex offenders in zip code 77362 is 478 to 1. The ratio of registered sex offenders to all residents in this zip code is near the state average.
Median resident age:
This zip code:
39.9 years
Texas median age:
35.6 years
Average household size:
This zip code:
2.8 people
Texas:
2.6 people
Averages for the 2020 tax year for zip code 77362, filed in 2021:
Average Adjusted Gross Income (AGI) in 2020: $89,547 (Individual Income Tax Returns)
Here:
$89,547
State:
$77,054
Salary/wage: $79,405 (reported on 82.2% of returns)
Here:
$79,405
State:
$62,766
(% of AGI for various income ranges: 1198.7% for AGIs below $25k, 3626.9% for AGIs $25k-50k, 6424.7% for AGIs $50k-75k, 9466.7% for AGIs $75k-100k, 16374.6% for AGIs $100k-200k, 68375.0% for AGIs over 200k)
Taxable interest for individuals: $1,534 (reported on 24.7% of returns)
This zip code:
$1,534
Texas:
$2,665
(% of AGI for various income ranges: 10.0% for AGIs below $25k, 7.0% for AGIs $25k-50k, 17.2% for AGIs $50k-75k, 38.6% for AGIs $75k-100k, 93.1% for AGIs $100k-200k, 537.5% for AGIs over 200k)
Ordinary dividends: $5,546 (reported on 18.4% of returns)
Here:
$5,546
State:
$10,044
(% of AGI for various income ranges: 15.1% for AGIs below $25k, 28.9% for AGIs $25k-50k, 60.0% for AGIs $50k-75k, 133.8% for AGIs $75k-100k, 174.4% for AGIs $100k-200k, 1621.7% for AGIs over 200k)
Net capital gain/loss in AGI: +$23,624 (reported on 16.3% of returns)
Here:
+$23,624
State:
+$39,590
(% of AGI for various income ranges: 5.8% for AGIs below $25k, 10.9% for AGIs $25k-50k, 49.2% for AGIs $50k-75k, 158.6% for AGIs $75k-100k, 443.6% for AGIs $100k-200k, 8681.7% for AGIs over 200k)
Profit/loss from business: +$11,449 (reported on 23.8% of returns)
Here:
+$11,449
State:
+$10,888
(% of AGI for various income ranges: 258.4% for AGIs below $25k, 258.7% for AGIs $25k-50k, 269.2% for AGIs $50k-75k, 255.2% for AGIs $75k-100k, 657.4% for AGIs $100k-200k, 1496.7% for AGIs over 200k)
Taxable individual retirement arrangement distribution: $33,686 (reported on 8.4% of returns)
77362:
$33,686
Texas:
$24,740
(% of AGI for various income ranges: 56.4% for AGIs below $25k, 92.6% for AGIs $25k-50k, 166.9% for AGIs $50k-75k, 290.0% for AGIs $75k-100k, 1036.7% for AGIs $100k-200k, 2741.7% for AGIs over 200k)
Total itemized deductions: $37,026 (reported on 11.4% of returns)
Here:
$37,026
State:
$40,428
(% of AGI for various income ranges: 174.8% for AGIs $25k-50k, 279.2% for AGIs $50k-75k, 420.0% for AGIs $75k-100k, 1182.8% for AGIs $100k-200k, 5521.7% for AGIs over 200k)
Charity contributions: $15,157 (reported on 9.0% of returns)
Here:
$15,157
State:
$18,201
(% of AGI for various income ranges: 17.0% for AGIs below $25k, 56.7% for AGIs $50k-75k, 82.9% for AGIs $75k-100k, 356.9% for AGIs $100k-200k, 2216.7% for AGIs over 200k)
Taxes paid: $8,178 (reported on 11.1% of returns)
77362:
$8,178
State:
$7,821
(% of AGI for various income ranges: 35.6% for AGIs $25k-50k, 61.9% for AGIs $50k-75k, 115.2% for AGIs $75k-100k, 248.7% for AGIs $100k-200k, 1165.8% for AGIs over 200k)
Earned income credit: $2,508 (reported on 14.8% of returns)
Here:
$2,508
State:
$2,584
(% of AGI for various income ranges: 108.8% for AGIs below $25k, 88.5% for AGIs $25k-50k)
Percentage of individuals using paid preparers for their 2020 taxes: 91.0%
Here:
91%
State:
92%
(% for various income ranges: 87.6% for AGIs below $25k, 92.6% for AGIs $25k-50k, 93.6% for AGIs $50k-75k, 92.9% for AGIs $75k-100k, 91.5% for AGIs $100k-200k, 90.9% for AGIs over 200k)
Averages for the 2012 tax year for zip code 77362, filed in 2013:
Average Adjusted Gross Income (AGI) in 2012: $64,868 (Individual Income Tax Returns)
Here:
$64,868
State:
$65,384
Salary/wage: $58,279 (reported on 85.0% of returns)
Here:
$58,279
State:
$52,524
(% of AGI for various income ranges: 75.4% for AGIs below $25k, 80.6% for AGIs $25k-50k, 84.8% for AGIs $50k-75k, 84.2% for AGIs $75k-100k, 78.5% for AGIs $100k-200k, 65.1% for AGIs over 200k)
Taxable interest for individuals: $791 (reported on 25.5% of returns)
This zip code:
$791
Texas:
$2,372
(% of AGI for various income ranges: 0.7% for AGIs below $25k, 0.6% for AGIs $25k-50k, 0.2% for AGIs $50k-75k, 0.2% for AGIs $75k-100k, 0.2% for AGIs $100k-200k, 0.3% for AGIs over 200k)
Ordinary dividends: $4,432 (reported on 14.1% of returns)
Here:
$4,432
State:
$9,721
(% of AGI for various income ranges: 1.2% for AGIs below $25k, 0.1% for AGIs $25k-50k, 0.4% for AGIs $50k-75k, 0.2% for AGIs $75k-100k, 0.8% for AGIs $100k-200k, 2.1% for AGIs over 200k)
Net capital gain/loss in AGI: +$8,085 (reported on 11.8% of returns)
Here:
+$8,085
State:
+$35,319
(% of AGI for various income ranges: 0.3% for AGIs $50k-75k, 1.7% for AGIs $100k-200k, 3.5% for AGIs over 200k)
Profit/loss from business: +$12,430 (reported on 22.7% of returns)
Here:
+$12,430
State:
+$13,732
(% of AGI for various income ranges: 16.1% for AGIs below $25k, 4.4% for AGIs $25k-50k, 3.6% for AGIs $50k-75k, 2.4% for AGIs $75k-100k, 3.2% for AGIs $100k-200k, 3.8% for AGIs over 200k)
Taxable individual retirement arrangement distribution: $20,106 (reported on 8.2% of returns)
77362:
$20,106
Texas:
$19,511
(% of AGI for various income ranges: 2.2% for AGIs below $25k, 1.9% for AGIs $25k-50k, 1.6% for AGIs $50k-75k, 3.1% for AGIs $75k-100k, 5.8% for AGIs $100k-200k)
Total itemized deductions: $22,605 (17% of AGI, reported on 26.8% of returns)
Here:
$22,605
State:
$24,724
Here:
17.1% of AGI
State:
15.9% of AGI
(% of AGI for various income ranges: 8.2% for AGIs below $25k, 8.1% for AGIs $25k-50k, 10.7% for AGIs $50k-75k, 9.7% for AGIs $75k-100k, 10.0% for AGIs $100k-200k, 8.8% for AGIs over 200k)
Charity contributions: $6,151 (reported on 20.5% of returns)
Here:
$6,151
State:
$6,808
(% of AGI for various income ranges: 0.7% for AGIs below $25k, 0.6% for AGIs $25k-50k, 1.6% for AGIs $50k-75k, 1.8% for AGIs $75k-100k, 2.1% for AGIs $100k-200k, 2.9% for AGIs over 200k)
Taxes paid: $5,923 (reported on 25.9% of returns)
77362:
$5,923
State:
$6,921
(% of AGI for various income ranges: 1.6% for AGIs below $25k, 1.4% for AGIs $25k-50k, 2.2% for AGIs $50k-75k, 2.3% for AGIs $75k-100k, 2.8% for AGIs $100k-200k, 2.6% for AGIs over 200k)
Earned income credit: $2,324 (reported on 17.3% of returns)
Here:
$2,324
State:
$2,570
(% of AGI for various income ranges: 6.6% for AGIs below $25k, 1.3% for AGIs $25k-50k)
Percentage of individuals using paid preparers for their 2012 taxes: 47.7%
Here:
48%
State:
51%
(% for various income ranges: 44.3% for AGIs below $25k, 47.2% for AGIs $25k-50k, 48.3% for AGIs $50k-75k, 45.5% for AGIs $75k-100k, 57.1% for AGIs $100k-200k, 55.6% for AGIs over 200k)
Averages for the 2004 tax year for zip code 77362, filed in 2005:
Average Adjusted Gross Income (AGI) in 2004: $50,161 (Individual Income Tax Returns)
Here:
$50,161
State:
$47,881
Salary/wage: $50,262 (reported on 86.4% of returns)
Here:
$50,262
State:
$41,947
(% of AGI for various income ranges: 130.0% for AGIs below $10k, 79.7% for AGIs $10k-25k, 86.7% for AGIs $25k-50k, 89.0% for AGIs $50k-75k, 88.1% for AGIs $75k-100k, 84.9% for AGIs over 100k)
Taxable interest for individuals: $918 (reported on 33.3% of returns)
This zip code:
$918
Texas:
$2,255
(% of AGI for various income ranges: 5.3% for AGIs below $10k, 1.4% for AGIs $10k-25k, 0.8% for AGIs $25k-50k, 0.6% for AGIs $50k-75k, 0.3% for AGIs $75k-100k, 0.3% for AGIs over 100k)
Taxable dividends: $2,056 (reported on 16.9% of returns)
Here:
$2,056
State:
$4,261
(% of AGI for various income ranges: 3.1% for AGIs below $10k, 0.8% for AGIs $10k-25k, 0.4% for AGIs $25k-50k, 0.4% for AGIs $50k-75k, 0.2% for AGIs $75k-100k, 1.0% for AGIs over 100k)
Net capital gain/loss: +$2,734 (reported on 14.1% of returns)
Here:
+$2,734
State:
+$16,110
(% of AGI for various income ranges: -2.6% for AGIs below $10k, 0.6% for AGIs $10k-25k, 0.2% for AGIs $25k-50k, 0.3% for AGIs $50k-75k, 0.1% for AGIs $75k-100k, 1.6% for AGIs over 100k)
Profit/loss from business: +$7,165 (reported on 19.2% of returns)
Here:
+$7,165
State:
+$11,013
(% of AGI for various income ranges: 14.2% for AGIs below $10k, 6.9% for AGIs $10k-25k, 2.5% for AGIs $25k-50k, 0.6% for AGIs $50k-75k, 2.7% for AGIs $75k-100k, 2.6% for AGIs over 100k)
IRA payment deduction: $3,185 (reported on 1.4% of returns)
77362:
$3,185
Texas:
$3,120
Total itemized deductions: $18,562 (21% of AGI, reported on 31.1% of returns)
Here:
$18,562
State:
$19,631
Here:
21.1% of AGI
State:
18.9% of AGI
(% of AGI for various income ranges: 27.4% for AGIs below $10k, 9.0% for AGIs $10k-25k, 10.6% for AGIs $25k-50k, 13.9% for AGIs $50k-75k, 12.6% for AGIs $75k-100k, 10.6% for AGIs over 100k)
Charity contributions deductions: $3,794 (4% of AGI, reported on 25.0% of returns)
Here:
$3,794
State:
$4,753
Here:
4.0% of AGI
State:
4.2% of AGI
(% of AGI for various income ranges: 1.4% for AGIs below $10k, 1.4% for AGIs $10k-25k, 1.1% for AGIs $25k-50k, 1.7% for AGIs $50k-75k, 2.4% for AGIs $75k-100k, 2.2% for AGIs over 100k)
Total tax: $9,038 (reported on 72.1% of returns)
77362:
$9,038
State:
$9,058
(% of AGI for various income ranges: 5.3% for AGIs below $10k, 4.2% for AGIs $10k-25k, 6.1% for AGIs $25k-50k, 8.7% for AGIs $50k-75k, 10.7% for AGIs $75k-100k, 20.3% for AGIs over 100k)
Earned income credit: $1,838 (reported on 17.5% of returns)
Here:
$1,838
State:
$2,024
Percentage of individuals using paid preparers for their 2004 taxes: 50.2%
Here:
50%
State:
57%
(% for various income ranges: 42.0% for AGIs below $10k, 54.5% for AGIs $10k-25k, 48.9% for AGIs $25k-50k, 54.7% for AGIs $50k-75k, 50.0% for AGIs $75k-100k, 54.0% for AGIs over 100k)
Likely homosexual households (counted as self-reported same-sex unmarried-partner households)
Lesbian couples: 0.5% of all households
Gay men: 0.0% of all households
Household received Food Stamps/SNAP in the past 12 months: 311 Household did not receive Food Stamps/SNAP in the past 12 months: 2,138
Women who had a birth in the past 12 months: 73 (27 now married, 44 unmarried) Women who did not have a birth in the past 12 months: 1,727 (876 now married, 847 unmarried)
Housing units in zip code 77362 with a mortgage: 1,274 (77 second mortgage, 27 both second mortgage and home equity loan) Houses without a mortgage: 46
Median monthly owner costs for units with a mortgage: $2,488 Median monthly owner costs for units without a mortgage: $543
Residents with income below the poverty level in 2022:
This zip code:
12.5%
Whole state:
14.0%
Residents with income below 50% of the poverty level in 2022:
This zip code:
10.0%
Whole state:
7.4%
Median number of rooms in houses and condos:
Here:
6.1
State:
6.3
Median number of rooms in apartments:
Here:
5.5
State:
4.0
Notable locations in this zip code not listed on our city pages
In group quarters: 26 (-1 institutionalized population)
Size of family households: 713 2-persons, 692 3-persons, 329 4-persons, 164 5-persons, 47 6-persons, 14 7-or-more-persons
Size of nonfamily households: 271 1-person, 198 2-persons, 12 4-persons
1,084 married couples with children.
639 single-parent households (49 men, 590 women).
83.9% of residents of 77362 zip code speak English at home.
10.8% of residents speak Spanish at home (85% very well, 8% well, 5% not well, 2% not at all).
4.8% of residents speak other Indo-European language at home (100% very well).
0.6% of residents speak Asian or Pacific Island language at home (100% very well).
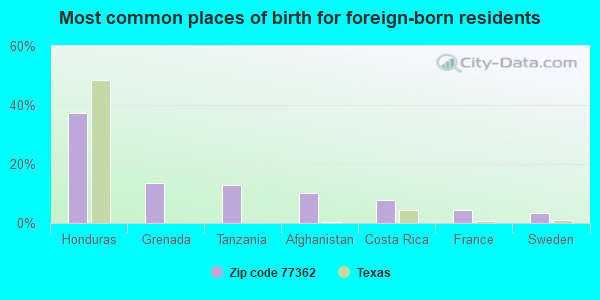
Foreign born population: 606 (8.9%) (62.9% of them are naturalized citizens)
This zip code:
8.9%
Whole state:
17.2%
37%Honduras
13%Grenada
13%Tanzania
10%Afghanistan
8%Costa Rica
5%France
4%Sweden
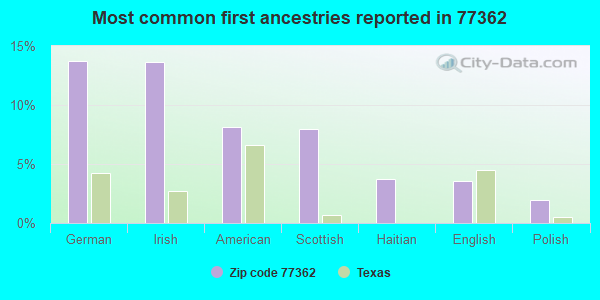
14%German
14%Irish
8%American
8%Scottish
4%Haitian
4%English
2%Polish
Year of entry for the foreign-born population
902010 or later
952000 to 2009
741990 to 1999
369Before 1990
Housing units lacking complete plumbing facilities: 2.6% Housing units lacking complete kitchen facilities: 2.7%
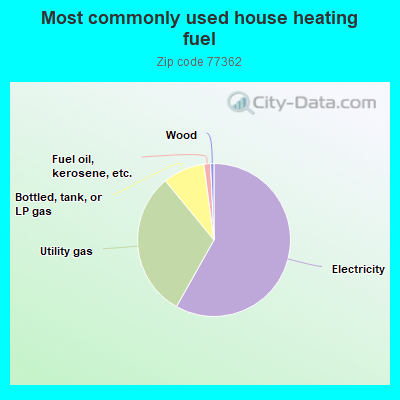
58.0%Electricity
30.8%Utility gas
8.8%Bottled, tank, or LP gas
1.4%Fuel oil, kerosene, etc.
0.7%Wood
Population in 1990: 2,498. Population change in the 1990s: +646 (+25.9%).
Place of birth for U.S.-born residents:
This state: 3,936
Northeast: 99
Midwest: 616
South: 1,008
West: 478
53% of the 77362 zip code residents lived in the same house 5 years ago. Out of people who lived in different houses, 22% lived in this county. Out of people who lived in different counties, 50% lived in Texas.
90% of the 77362 zip code residents lived in the same house 1 year ago. Out of people who lived in different houses, 29% moved from this county. Out of people who lived in different houses, 61% moved from different county within same state. Out of people who lived in different houses, 12% moved from different state.
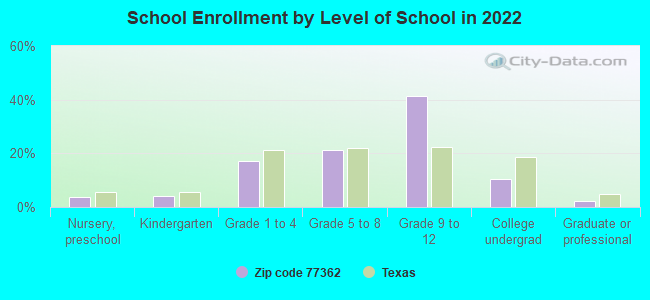
Private vs. public school enrollment:
Students in private schools in grades 1 to 8 (elementary and middle school): 107
Here:
15.4%
Texas:
8.8%
Students in private schools in grades 9 to 12 (high school): 9
Here:
1.3%
Texas:
8.0%
Students in private undergraduate colleges: 38
Here:
20.4%
Texas:
16.2%
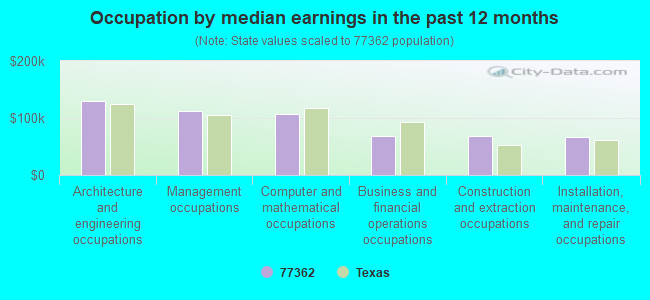
Occupation by median earnings in the past 12 months ($)
130,289Architecture and engineering occupations
111,649Management occupations
107,800Computer and mathematical occupations
68,737Business and financial operations occupations
68,018Construction and extraction occupations
66,561Installation, maintenance, and repair occupations
Companies with federal contracts located in this zip code:
AG-NAV DEVELOPMENT INC (33122 SH 249, SUITE A in PINEHURST, TX; small business)
$64,902 with Animal and Plant Health Inspection Service for Miscellaneous Aircraft Accessories and Components. Signed on 2003-09-15. Completion date: 2003-09-15.
Top industries in this zip code by the number of employees in 2005:
Other Services (except Public Administration): Religious Organizations (10-19 employees: 2 establishments, 5-9 employees: 1 establishment)
Administrative and Support and Waste Management and Remediation Services: Temporary Help Services (20-49: 1, 1-4: 1)
Administrative and Support and Waste Management and Remediation Services: Facilities Support Services (20-49: 1)
Construction: Other Building Finishing Contractors (20-49: 1)
Finance and Insurance: Third Party Administration of Insurance and Pension Funds (20-49: 1)
Construction: Plumbing, Heating, and Air-Conditioning Contractors (10-19: 2, 1-4: 1)
People in group quarters in 2010:
9 people in nursing facilities/skilled-nursing facilities
Fatal accident statistics in 2014:
Fatal accident count: 1
Vehicles involved in fatal accidents: 1
Fatal accidents caused by drunken drivers: 0
Fatalities: 1
Persons involved in fatal accidents: 2
Pedestrians involved in fatal accidents: 1
Fatal accident statistics in 2013:
Fatal accident count: 1
Vehicles involved in fatal accidents: 1
Fatal accidents caused by drunken drivers: 0
Fatalities: 1
Persons involved in fatal accidents: 1
Pedestrians involved in fatal accidents: 0
Home Mortgage Disclosure Act Aggregated Statistics For Year 2009 (Based on 4 partial tracts)
A) FHA, FSA/RHS & VA Home Purchase Loans
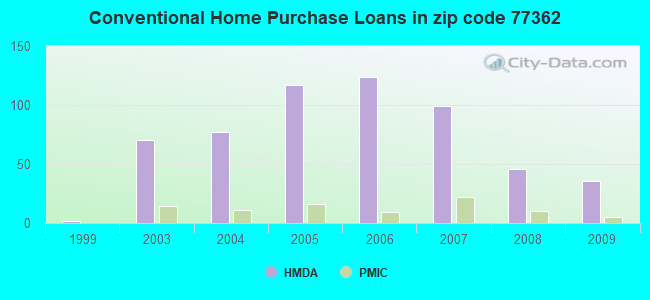
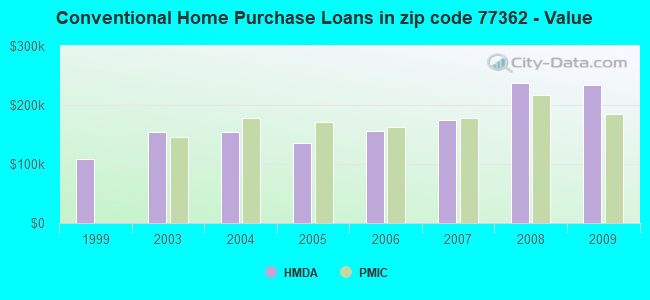
B) Conventional Home Purchase Loans
C) Refinancings
D) Home Improvement Loans
F) Non-occupant Loans on < 5 Family Dwellings (A B C & D)
G) Loans On Manufactured Home Dwelling (A B C & D)
Number
Average Value
Number
Average Value
Number
Average Value
Number
Average Value
Number
Average Value
Number
Average Value
LOANS ORIGINATED
12
$150,240
36
$234,513
87
$237,236
7
$65,240
4
$138,852
2
$63,435
APPLICATIONS APPROVED, NOT ACCEPTED
1
$134,160
3
$135,817
8
$202,514
1
$22,170
0
$0
0
$0
APPLICATIONS DENIED
5
$151,728
7
$181,004
34
$220,436
8
$47,974
1
$98,170
4
$44,200
APPLICATIONS WITHDRAWN
1
$137,300
4
$207,342
21
$232,878
2
$59,430
1
$104,040
1
$44,720
FILES CLOSED FOR INCOMPLETENESS
1
$149,490
0
$0
7
$354,670
1
$32,860
0
$0
0
$0
Aggregated Statistics For Year 2008 (Based on 4 partial tracts)
A) FHA, FSA/RHS & VA Home Purchase Loans
B) Conventional Home Purchase Loans
C) Refinancings
D) Home Improvement Loans
F) Non-occupant Loans on < 5 Family Dwellings (A B C & D)
G) Loans On Manufactured Home Dwelling (A B C & D)
Number
Average Value
Number
Average Value
Number
Average Value
Number
Average Value
Number
Average Value
Number
Average Value
LOANS ORIGINATED
15
$143,006
46
$237,662
45
$220,232
11
$79,115
5
$107,432
3
$55,160
APPLICATIONS APPROVED, NOT ACCEPTED
1
$126,220
8
$210,129
9
$170,951
1
$79,800
1
$154,460
2
$82,010
APPLICATIONS DENIED
2
$118,885
12
$192,160
36
$171,682
16
$38,361
3
$113,460
5
$70,898
APPLICATIONS WITHDRAWN
3
$142,190
7
$213,189
16
$202,551
4
$73,422
1
$46,070
1
$19,240
FILES CLOSED FOR INCOMPLETENESS
0
$0
2
$137,840
3
$195,183
0
$0
0
$0
0
$0
Aggregated Statistics For Year 2007 (Based on 4 partial tracts)
A) FHA, FSA/RHS & VA Home Purchase Loans
B) Conventional Home Purchase Loans
C) Refinancings
D) Home Improvement Loans
F) Non-occupant Loans on < 5 Family Dwellings (A B C & D)
G) Loans On Manufactured Home Dwelling (A B C & D)
Number
Average Value
Number
Average Value
Number
Average Value
Number
Average Value
Number
Average Value
Number
Average Value
LOANS ORIGINATED
11
$136,190
99
$173,759
47
$207,093
18
$52,221
10
$150,432
8
$67,171
APPLICATIONS APPROVED, NOT ACCEPTED
0
$0
21
$160,404
7
$161,116
7
$80,146
3
$178,673
4
$70,880
APPLICATIONS DENIED
4
$112,432
24
$153,940
41
$174,947
15
$57,379
5
$116,122
7
$56,359
APPLICATIONS WITHDRAWN
3
$123,263
14
$183,771
20
$156,910
3
$85,700
2
$71,935
2
$55,490
FILES CLOSED FOR INCOMPLETENESS
0
$0
4
$244,155
11
$222,655
0
$0
1
$50,170
0
$0
Aggregated Statistics For Year 2006 (Based on 4 partial tracts)
A) FHA, FSA/RHS & VA Home Purchase Loans
B) Conventional Home Purchase Loans
C) Refinancings
D) Home Improvement Loans
F) Non-occupant Loans on < 5 Family Dwellings (A B C & D)
G) Loans On Manufactured Home Dwelling (A B C & D)
Number
Average Value
Number
Average Value
Number
Average Value
Number
Average Value
Number
Average Value
Number
Average Value
LOANS ORIGINATED
12
$129,080
124
$155,302
48
$191,289
16
$62,894
9
$213,953
11
$120,777
APPLICATIONS APPROVED, NOT ACCEPTED
1
$144,130
27
$149,128
8
$165,900
4
$47,360
4
$237,175
4
$57,562
APPLICATIONS DENIED
3
$77,890
50
$136,954
39
$164,105
16
$36,712
7
$151,101
15
$53,889
APPLICATIONS WITHDRAWN
1
$71,690
20
$157,018
28
$172,368
2
$81,280
3
$191,090
1
$37,470
FILES CLOSED FOR INCOMPLETENESS
1
$44,360
6
$130,447
10
$179,298
0
$0
0
$0
0
$0
Aggregated Statistics For Year 2005 (Based on 4 partial tracts)
A) FHA, FSA/RHS & VA Home Purchase Loans
B) Conventional Home Purchase Loans
C) Refinancings
D) Home Improvement Loans
F) Non-occupant Loans on < 5 Family Dwellings (A B C & D)
G) Loans On Manufactured Home Dwelling (A B C & D)
Number
Average Value
Number
Average Value
Number
Average Value
Number
Average Value
Number
Average Value
Number
Average Value
LOANS ORIGINATED
14
$118,939
117
$134,882
64
$184,855
17
$69,997
10
$89,644
12
$71,799
APPLICATIONS APPROVED, NOT ACCEPTED
2
$136,765
23
$105,594
13
$180,269
3
$53,313
2
$118,690
6
$56,133
APPLICATIONS DENIED
6
$82,122
39
$122,920
52
$165,732
14
$39,533
6
$98,717
13
$50,342
APPLICATIONS WITHDRAWN
2
$102,255
21
$118,450
34
$169,630
6
$240,490
4
$70,845
1
$52,540
FILES CLOSED FOR INCOMPLETENESS
0
$0
4
$148,160
18
$173,313
2
$25,680
0
$0
0
$0
Aggregated Statistics For Year 2004 (Based on 4 partial tracts)
A) FHA, FSA/RHS & VA Home Purchase Loans
B) Conventional Home Purchase Loans
C) Refinancings
D) Home Improvement Loans
F) Non-occupant Loans on < 5 Family Dwellings (A B C & D)
G) Loans On Manufactured Home Dwelling (A B C & D)
Number
Average Value
Number
Average Value
Number
Average Value
Number
Average Value
Number
Average Value
Number
Average Value
LOANS ORIGINATED
15
$111,971
77
$154,072
93
$162,655
16
$50,746
6
$139,365
12
$71,144
APPLICATIONS APPROVED, NOT ACCEPTED
1
$146,480
15
$105,655
16
$129,846
3
$56,227
2
$41,395
6
$52,377
APPLICATIONS DENIED
4
$95,762
23
$101,524
63
$137,483
16
$48,282
5
$119,164
8
$59,366
APPLICATIONS WITHDRAWN
3
$103,133
11
$107,575
35
$150,397
1
$38,950
1
$108,590
1
$119,380
FILES CLOSED FOR INCOMPLETENESS
1
$60,780
4
$179,272
26
$154,418
1
$42,930
1
$56,950
0
$0
Aggregated Statistics For Year 2003 (Based on 4 partial tracts)
A) FHA, FSA/RHS & VA Home Purchase Loans
B) Conventional Home Purchase Loans
C) Refinancings
D) Home Improvement Loans
F) Non-occupant Loans on < 5 Family Dwellings (A B C & D)
Number
Average Value
Number
Average Value
Number
Average Value
Number
Average Value
Number
Average Value
LOANS ORIGINATED
14
$121,296
70
$154,444
171
$161,746
11
$34,503
7
$93,826
APPLICATIONS APPROVED, NOT ACCEPTED
1
$55,310
10
$116,659
25
$144,343
3
$39,290
1
$97,070
APPLICATIONS DENIED
7
$104,866
28
$127,315
74
$126,796
10
$23,794
3
$73,710
APPLICATIONS WITHDRAWN
4
$124,032
8
$102,961
45
$138,632
1
$52,570
2
$46,165
FILES CLOSED FOR INCOMPLETENESS
0
$0
3
$106,690
9
$172,154
0
$0
0
$0
Aggregated Statistics For Year 1999 (Based on 1 partial tract)
Detailed PMIC statistics for the following Tracts:6902.00
, 6903.00
2005 - 2018 National Fire Incident Reporting System (NFIRS) incidents
Based on the data from the years 2005 - 2018 the average number of fires per year is 24. The highest number of reported fires - 51 took place in 2008, and the least - 1 in 2013. The data has a decreasing trend.
When looking into fire subcategories, the most incidents belonged to: Outside Fires (70.7%), and Structure Fires (19.2%).
Fire incident types reported to NFIRS in Zip Code 77362


 Nearest zip codes: 77354, 77355, 77377, 77375, 77382, 77316.


 Based on the data from the years 2005 - 2018 the average number of fires per year is 24. The highest number of reported fires - 51 took place in 2008, and the least - 1 in 2013. The data has a decreasing trend.
 When looking into fire subcategories, the most incidents belonged to: Outside Fires (70.7%), and Structure Fires (19.2%).