Estimated zip code population in 2022: 17,546 Zip code population in 2010: 17,412 Zip code population in 2000: 18,466
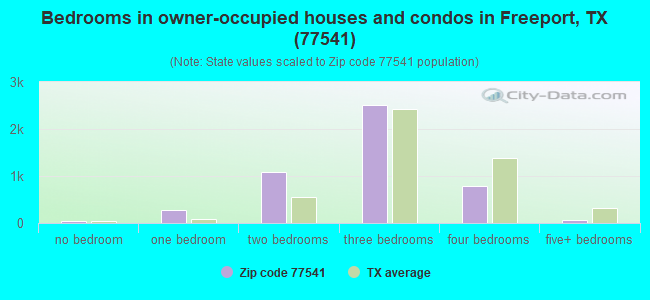
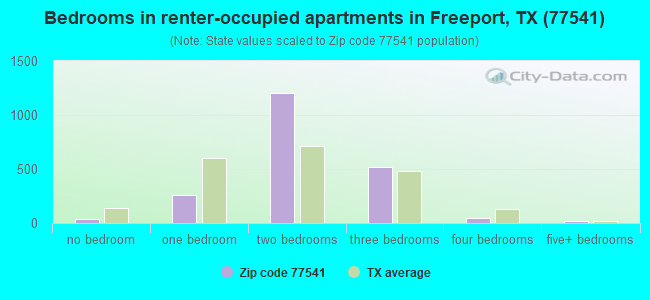
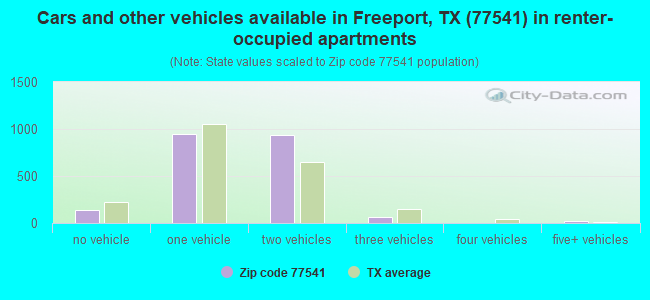
Houses and condos: 9,749 Renter-occupied apartments: 2,124
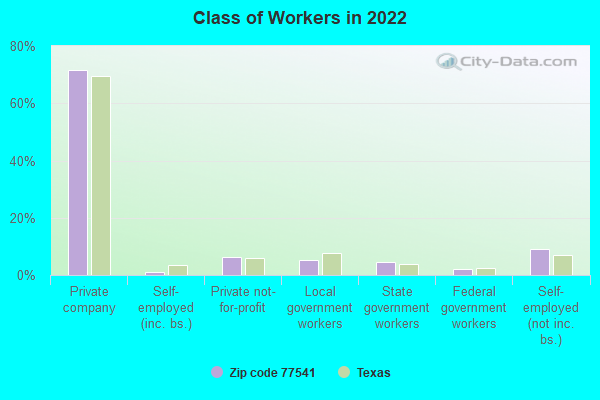
% of renters here:
31%
State:
38%
March 2022 cost of living index in zip code 77541: 91.1 (less than average, U.S. average is 100)
Land area: 118.0 sq. mi. Water area: 29.5 sq. mi.
Population density: 149 people per square mile
(very low).
OSM Map
General Map
Google Map
MSN Map
OSM Map
General Map
Google Map
MSN Map
OSM Map
General Map
Google Map
MSN Map
OSM Map
General Map
Google Map
MSN Map
Please wait while loading the map...
Real estate property taxes paid for housing units in 2022:
This zip code:
1.2% ($1,937)
Texas:
1.5% ($4,050)
Median real estate property taxes paid for housing units with mortgages in 2022: $3,285 (1.5%) Median real estate property taxes paid for housing units with no mortgage in 2022: $1,211 (0.9%)
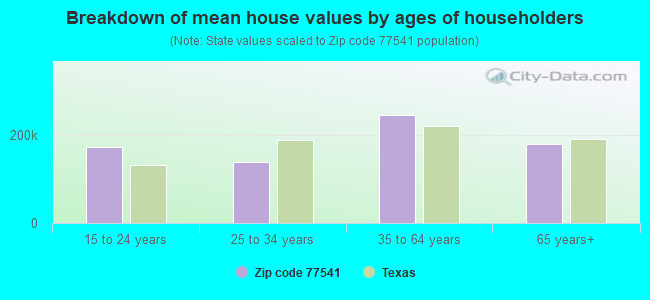
Estimated median house/condo value in 2022: $158,066
77541:
$158,066
Texas:
$275,400
According to our research of Texas and other state lists, there were 48 registered sex offenders living in 77541 zip code as of June 16, 2024. The ratio of all residents to sex offenders in zip code 77541 is 386 to 1. The ratio of registered sex offenders to all residents in this zip code is near the state average.
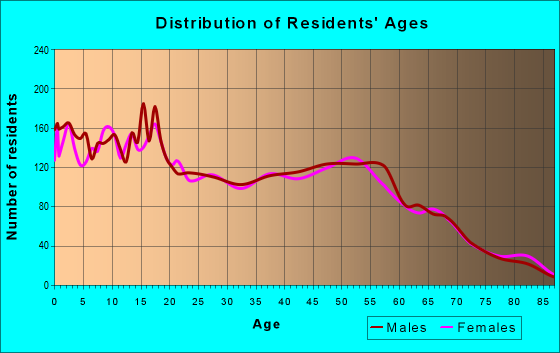
Median resident age:
This zip code:
37.4 years
Texas median age:
35.6 years
Average household size:
This zip code:
2.5 people
Texas:
2.6 people
Averages for the 2020 tax year for zip code 77541, filed in 2021:
Average Adjusted Gross Income (AGI) in 2020: $50,980 (Individual Income Tax Returns)
Here:
$50,980
State:
$77,054
Salary/wage: $45,467 (reported on 85.0% of returns)
Here:
$45,467
State:
$62,766
(% of AGI for various income ranges: 1178.5% for AGIs below $25k, 3526.1% for AGIs $25k-50k, 6344.2% for AGIs $50k-75k, 9069.8% for AGIs $75k-100k, 15132.7% for AGIs $100k-200k, 51044.0% for AGIs over 200k)
Taxable interest for individuals: $1,059 (reported on 16.3% of returns)
This zip code:
$1,059
Texas:
$2,665
(% of AGI for various income ranges: 4.9% for AGIs below $25k, 13.1% for AGIs $25k-50k, 20.5% for AGIs $50k-75k, 45.0% for AGIs $75k-100k, 33.2% for AGIs $100k-200k, 714.0% for AGIs over 200k)
Ordinary dividends: $5,708 (reported on 7.7% of returns)
Here:
$5,708
State:
$10,044
(% of AGI for various income ranges: 4.7% for AGIs below $25k, 20.4% for AGIs $25k-50k, 23.7% for AGIs $50k-75k, 76.6% for AGIs $75k-100k, 178.4% for AGIs $100k-200k, 2558.0% for AGIs over 200k)
Net capital gain/loss in AGI: +$12,634 (reported on 6.8% of returns)
Here:
+$12,634
State:
+$39,590
(% of AGI for various income ranges: 0.3% for AGIs below $25k, 15.8% for AGIs $25k-50k, 37.8% for AGIs $50k-75k, 80.7% for AGIs $75k-100k, 373.4% for AGIs $100k-200k, 6752.0% for AGIs over 200k)
Profit/loss from business: +$1,567 (reported on 19.6% of returns)
Here:
+$1,567
State:
+$10,888
(% of AGI for various income ranges: 75.1% for AGIs below $25k, 6372.0% for AGIs over 200k)
Taxable individual retirement arrangement distribution: $20,483 (reported on 5.1% of returns)
77541:
$20,483
Texas:
$24,740
(% of AGI for various income ranges: 23.2% for AGIs below $25k, 53.6% for AGIs $25k-50k, 107.2% for AGIs $50k-75k, 213.2% for AGIs $75k-100k, 906.8% for AGIs $100k-200k)
Total itemized deductions: $38,123 (reported on 5.7% of returns)
Here:
$38,123
State:
$40,428
(% of AGI for various income ranges: 146.4% for AGIs $25k-50k, 381.9% for AGIs $50k-75k, 659.3% for AGIs $75k-100k, 729.1% for AGIs $100k-200k, 6646.0% for AGIs over 200k)
Charity contributions: $19,712 (reported on 3.6% of returns)
Here:
$19,712
State:
$18,201
(% of AGI for various income ranges: 34.9% for AGIs $25k-50k, 98.0% for AGIs $50k-75k, 161.8% for AGIs $75k-100k, 196.1% for AGIs $100k-200k, 4000.0% for AGIs over 200k)
Taxes paid: $6,334 (reported on 4.7% of returns)
77541:
$6,334
State:
$7,821
(% of AGI for various income ranges: 17.2% for AGIs $25k-50k, 38.6% for AGIs $50k-75k, 100.2% for AGIs $75k-100k, 153.6% for AGIs $100k-200k, 642.0% for AGIs over 200k)
Earned income credit: $2,682 (reported on 26.5% of returns)
Here:
$2,682
State:
$2,584
(% of AGI for various income ranges: 149.5% for AGIs below $25k, 97.0% for AGIs $25k-50k, 1.4% for AGIs $50k-75k)
Percentage of individuals using paid preparers for their 2020 taxes: 93.2%
Here:
93%
State:
92%
(% for various income ranges: 92.2% for AGIs below $25k, 94.7% for AGIs $25k-50k, 93.9% for AGIs $50k-75k, 92.9% for AGIs $75k-100k, 92.1% for AGIs $100k-200k, 92.3% for AGIs over 200k)
Averages for the 2012 tax year for zip code 77541, filed in 2013:
Average Adjusted Gross Income (AGI) in 2012: $41,010 (Individual Income Tax Returns)
Here:
$41,010
State:
$65,384
Salary/wage: $38,550 (reported on 83.6% of returns)
Here:
$38,550
State:
$52,524
(% of AGI for various income ranges: 69.9% for AGIs below $25k, 81.2% for AGIs $25k-50k, 86.8% for AGIs $50k-75k, 83.3% for AGIs $75k-100k, 79.2% for AGIs $100k-200k, 53.9% for AGIs over 200k)
Taxable interest for individuals: $909 (reported on 18.9% of returns)
This zip code:
$909
Texas:
$2,372
(% of AGI for various income ranges: 0.7% for AGIs below $25k, 0.3% for AGIs $25k-50k, 0.3% for AGIs $50k-75k, 0.4% for AGIs $75k-100k, 0.4% for AGIs $100k-200k, 0.6% for AGIs over 200k)
Ordinary dividends: $10,650 (reported on 13.4% of returns)
Here:
$10,650
State:
$9,721
(% of AGI for various income ranges: 10.2% for AGIs below $25k, 6.2% for AGIs $25k-50k, 1.0% for AGIs $50k-75k, 0.7% for AGIs $75k-100k, 0.9% for AGIs $100k-200k, 0.8% for AGIs over 200k)
Net capital gain/loss in AGI: +$5,253 (reported on 6.4% of returns)
Here:
+$5,253
State:
+$35,319
(% of AGI for various income ranges: 0.5% for AGIs $25k-50k, 0.4% for AGIs $50k-75k, 0.2% for AGIs $75k-100k, 1.0% for AGIs $100k-200k, 5.6% for AGIs over 200k)
Profit/loss from business: +$6,419 (reported on 14.8% of returns)
Here:
+$6,419
State:
+$13,732
(% of AGI for various income ranges: 9.3% for AGIs below $25k, 0.6% for AGIs $25k-50k, 1.3% for AGIs $75k-100k, 2.9% for AGIs $100k-200k)
Taxable individual retirement arrangement distribution: $18,329 (reported on 5.6% of returns)
77541:
$18,329
Texas:
$19,511
(% of AGI for various income ranges: 1.1% for AGIs below $25k, 1.5% for AGIs $25k-50k, 1.7% for AGIs $50k-75k, 3.2% for AGIs $75k-100k, 6.0% for AGIs $100k-200k)
Total itemized deductions: $20,483 (25% of AGI, reported on 14.5% of returns)
Here:
$20,483
State:
$24,724
Here:
25.1% of AGI
State:
15.9% of AGI
(% of AGI for various income ranges: 3.1% for AGIs below $25k, 6.6% for AGIs $25k-50k, 9.7% for AGIs $50k-75k, 9.2% for AGIs $75k-100k, 8.1% for AGIs $100k-200k, 4.8% for AGIs over 200k)
Charity contributions: $3,711 (reported on 10.3% of returns)
Here:
$3,711
State:
$6,808
(% of AGI for various income ranges: 0.2% for AGIs below $25k, 0.7% for AGIs $25k-50k, 1.1% for AGIs $50k-75k, 1.0% for AGIs $75k-100k, 1.3% for AGIs $100k-200k, 1.5% for AGIs over 200k)
Taxes paid: $4,189 (reported on 14.0% of returns)
77541:
$4,189
State:
$6,921
(% of AGI for various income ranges: 0.4% for AGIs below $25k, 1.1% for AGIs $25k-50k, 1.9% for AGIs $50k-75k, 1.8% for AGIs $75k-100k, 2.0% for AGIs $100k-200k, 1.2% for AGIs over 200k)
Earned income credit: $2,705 (reported on 28.4% of returns)
Here:
$2,705
State:
$2,570
(% of AGI for various income ranges: 10.3% for AGIs below $25k, 1.4% for AGIs $25k-50k)
Percentage of individuals using paid preparers for their 2012 taxes: 54.9%
Here:
55%
State:
51%
(% for various income ranges: 52.7% for AGIs below $25k, 51.8% for AGIs $25k-50k, 59.6% for AGIs $50k-75k, 61.5% for AGIs $75k-100k, 63.0% for AGIs $100k-200k, 83.3% for AGIs over 200k)
Averages for the 2004 tax year for zip code 77541, filed in 2005:
Average Adjusted Gross Income (AGI) in 2004: $31,742 (Individual Income Tax Returns)
Here:
$31,742
State:
$47,881
Salary/wage: $29,922 (reported on 87.3% of returns)
Here:
$29,922
State:
$41,947
(% of AGI for various income ranges: 105.6% for AGIs below $10k, 83.3% for AGIs $10k-25k, 88.9% for AGIs $25k-50k, 85.9% for AGIs $50k-75k, 82.2% for AGIs $75k-100k, 58.9% for AGIs over 100k)
Taxable interest for individuals: $961 (reported on 35.0% of returns)
This zip code:
$961
Texas:
$2,255
(% of AGI for various income ranges: 1.9% for AGIs below $10k, 1.1% for AGIs $10k-25k, 0.6% for AGIs $25k-50k, 0.8% for AGIs $50k-75k, 1.0% for AGIs $75k-100k, 2.1% for AGIs over 100k)
Taxable dividends: $2,621 (reported on 11.2% of returns)
Here:
$2,621
State:
$4,261
(% of AGI for various income ranges: 1.2% for AGIs below $10k, 0.8% for AGIs $10k-25k, 0.5% for AGIs $25k-50k, 1.1% for AGIs $50k-75k, 1.3% for AGIs $75k-100k, 1.2% for AGIs over 100k)
Net capital gain/loss: +$7,066 (reported on 8.6% of returns)
Here:
+$7,066
State:
+$16,110
(% of AGI for various income ranges: -1.0% for AGIs below $10k, -0.0% for AGIs $10k-25k, 0.2% for AGIs $25k-50k, 0.8% for AGIs $50k-75k, 1.2% for AGIs $75k-100k, 9.9% for AGIs over 100k)
Profit/loss from business: +$5,269 (reported on 14.5% of returns)
Here:
+$5,269
State:
+$11,013
(% of AGI for various income ranges: 1.1% for AGIs below $10k, 5.0% for AGIs $10k-25k, 1.0% for AGIs $25k-50k, 1.0% for AGIs $50k-75k, 1.0% for AGIs $75k-100k, 5.9% for AGIs over 100k)
IRA payment deduction: $2,973 (reported on 1.2% of returns)
77541:
$2,973
Texas:
$3,120
(% of AGI for various income ranges: 0.1% for AGIs $10k-25k, 0.1% for AGIs $25k-50k, 0.1% for AGIs $50k-75k, 0.2% for AGIs $75k-100k)
Self-employed pension: $20,300 (reported on 0.2% of returns)
Here:
$20,300
Texas:
$16,401
Total itemized deductions: $17,436 (26% of AGI, reported on 9.5% of returns)
Here:
$17,436
State:
$19,631
Here:
25.6% of AGI
State:
18.9% of AGI
(% of AGI for various income ranges: 3.3% for AGIs below $10k, 2.9% for AGIs $10k-25k, 4.3% for AGIs $25k-50k, 6.0% for AGIs $50k-75k, 6.8% for AGIs $75k-100k, 7.7% for AGIs over 100k)
Charity contributions deductions: $4,050 (6% of AGI, reported on 7.0% of returns)
Here:
$4,050
State:
$4,753
Here:
5.6% of AGI
State:
4.2% of AGI
(% of AGI for various income ranges: 0.4% for AGIs $10k-25k, 0.5% for AGIs $25k-50k, 0.9% for AGIs $50k-75k, 1.8% for AGIs $75k-100k, 1.6% for AGIs over 100k)
Total tax: $4,268 (reported on 60.7% of returns)
77541:
$4,268
State:
$9,058
(% of AGI for various income ranges: 2.5% for AGIs below $10k, 3.0% for AGIs $10k-25k, 5.2% for AGIs $25k-50k, 8.6% for AGIs $50k-75k, 11.5% for AGIs $75k-100k, 17.0% for AGIs over 100k)
Earned income credit: $2,102 (reported on 31.3% of returns)
Here:
$2,102
State:
$2,024
Percentage of individuals using paid preparers for their 2004 taxes: 63.8%
Here:
64%
State:
57%
(% for various income ranges: 56.8% for AGIs below $10k, 68.5% for AGIs $10k-25k, 65.5% for AGIs $25k-50k, 62.0% for AGIs $50k-75k, 59.7% for AGIs $75k-100k, 67.8% for AGIs over 100k)
Likely homosexual households (counted as self-reported same-sex unmarried-partner households)
Lesbian couples: 0.0% of all households
Gay men: 0.0% of all households
Household received Food Stamps/SNAP in the past 12 months: 988 Household did not receive Food Stamps/SNAP in the past 12 months: 5,952
Women who had a birth in the past 12 months: 417 (227 now married, 186 unmarried) Women who did not have a birth in the past 12 months: 3,516 (1,362 now married, 2,159 unmarried)
Housing units in zip code 77541 with a mortgage: 1,704 (70 second mortgage, 65 both second mortgage and home equity loan) Houses without a mortgage: 206
Median monthly owner costs for units with a mortgage: $1,458 Median monthly owner costs for units without a mortgage: $470
Residents with income below the poverty level in 2022:
This zip code:
15.9%
Whole state:
14.0%
Residents with income below 50% of the poverty level in 2022:
This zip code:
7.3%
Whole state:
7.4%
Median number of rooms in houses and condos:
Here:
5.3
State:
6.3
Median number of rooms in apartments:
Here:
4.1
State:
4.0
Notable locations in this zip code not listed on our city pages
Notable locations in zip code 77541: Stratton Ridge (A), Bridge Harbor Yacht Club Marina (B), Surfside Beach Fire Department (C), Demi - John Volunteer Fire Department (D), Oyster Creek Volunteer Fire Department (E), Oyster Creek City Marshal's Office (F), Surfside Village Police Department (G), Alvin Branch Library (H), Brazos Heritage Museum (I). Display/hide their locations on the map
Lakes and swamps: Wolf Lake (A), Horseshoe Lake (B), Salt Lake (C), Nicks Lake (D), Swan Lake (E), Fresh Water Lake (F), Stubblefield Lake (G), Chubb Lake (H). Display/hide their locations on the map
Streams, rivers, and creeks: Big Slough (A), Austin Bayou (B), Middle Bayou (C), Oyster Creek (D), Salt Bayou (E), Ridge Slough (F), Little Slough (G). Display/hide their locations on the map
1,893 married couples with children.
1,844 single-parent households (386 men, 1,458 women).
72.4% of residents of 77541 zip code speak English at home.
27.2% of residents speak Spanish at home (72% very well, 12% well, 9% not well, 7% not at all).
0.2% of residents speak other Indo-European language at home (100% very well).
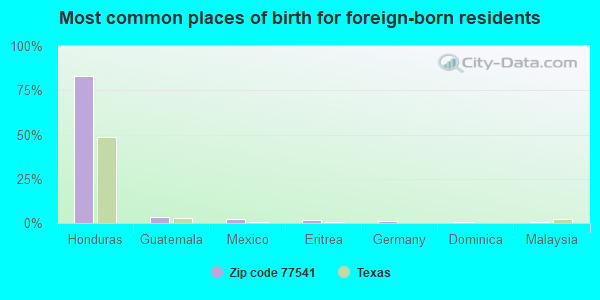
Foreign born population: 1,506 (8.6%) (59.9% of them are naturalized citizens)
This zip code:
8.6%
Whole state:
17.2%
83%Honduras
3%Guatemala
2%Mexico
2%Eritrea
1%Germany
1%Dominica
1%Malaysia
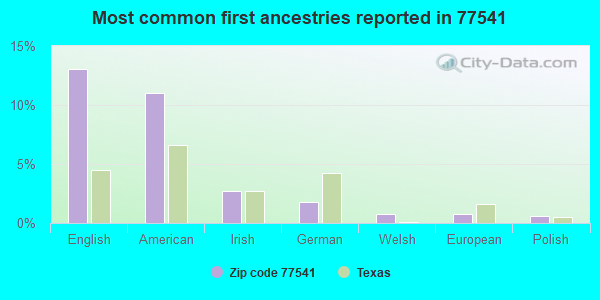
13%English
11%American
3%Irish
2%German
1%Welsh
1%European
1%Polish
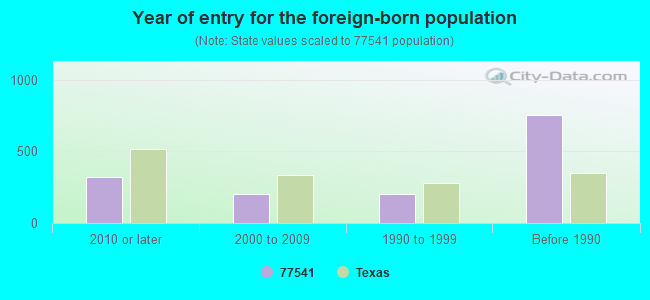
Year of entry for the foreign-born population
3242010 or later
2012000 to 2009
2051990 to 1999
754Before 1990
Facilities with environmental interests located in this zip code:
AIR LIQUIDE FREEPORT HYCO (2398 VICTORIA ROAD in FREEPORT, TX)
AIR MINOR (AIRS/AFS) AIR MAJOR (AIRS/AFS) ENFORCEMENT/COMPLIANCE ACTIVITY (Integrated Compliance Information System) - ICIS-06-2004-0601, FORMAL ENFORCEMENT ACTION (Integrated Compliance Information System) - ICIS-06-2004-0601, FORMAL ENFORCEMENT ACTION CRITERIA AND HAZARDOUS AIR POLLUTANT INVENTORY (Inventory of air pollution sources) AIR MAJOR ("Best Available" air pollution technologies tracking) Conditionally Exempt Small Quantity Generators, less than 100 kg/month of hazardous waste (Resource Conservation and Recovery Act (tracking hazardous waste)) - notification TRI REPORTER (Tracking of toxic chemicals releasing facilities) Business SIC classification: INDUSTRIAL GASES Organizations: AIR LIQUIDE LARGE INDUSTRIES US LP (CONTACT/OPERATOR)
Alternative names: AIR LIQUIDE- FREEPORT HYCO, FREEPORT HYCO PLANT
ALAC FREEPORT ASU (1711 FM 523 in FREEPORT, TX)
(Integrated Compliance Information System) - ICIS-06-2001-3315, FORMAL ENFORCEMENT ACTION, CRITERIA AND HAZARDOUS AIR POLLUTANT INVENTORY (Inventory of air pollution sources) National Pollutant Discharge Elimination System NON-MAJOR (Tracking pollutant discharge elimination systems) - permit Conditionally Exempt Small Quantity Generators, less than 100 kg/month of hazardous waste (Resource Conservation and Recovery Act (tracking hazardous waste)) - notification TRI REPORTER (Tracking of toxic chemicals releasing facilities) Business SIC classification: INDUSTRIAL GASES Business NAICS classification: INDUSTRIAL GAS MANUFACTURING. Organizations: AIR LIQUIDE LARGE INDUSTRIES US LP (CONTACT/OPERATOR)
, AIR LIQUIDE LARGE INDUSTRIES (CONTACT/OWNER)
Alternative names: AIR LIQUID AMERICA CORP, AIR LIQUIDE AMERICA CORP.
AMERICAN RICE INC (505 PORT ROAD in FREEPORT, TX)
AIR MINOR (AIRS/AFS) Business SIC classification: RICE MILLING; NATURAL GAS TRANSMISSION AND DISTRIBUTION
AIR LOGISTICS (8814 FM 523 N in FREEPORT, TX)
(Resource Conservation and Recovery Act (tracking hazardous waste)) Business NAICS classification: NONSCHEDULED CHARTERED PASSENGER AIR TRANSPORTATION.
AIR LIQUIDE FREEPORT HPU PLANT (STATE HWY'S 332 & 288 in FREEPORT, TX)
ENFORCEMENT/COMPLIANCE ACTIVITY (Integrated Compliance Information System) FORMAL ENFORCEMENT ACTION (Integrated Compliance Information System)
AIR LIQUIDE FREEPORT TX HPU (FM 523 OYSTER CREEK DIVISION OC-409 (GATE 9) in FREEPORT, TX)
CRITERIA AND HAZARDOUS AIR POLLUTANT INVENTORY (Inventory of air pollution sources) TRI REPORTER (Tracking of toxic chemicals releasing facilities) Business SIC classification: INDUSTRIAL GASES Alternative names: AIR LIQUIDE FREEPORT HPU PLANT, RC - ATTENTION HPU PLANT
Housing units lacking complete plumbing facilities: 5.0% Housing units lacking complete kitchen facilities: 4.9%
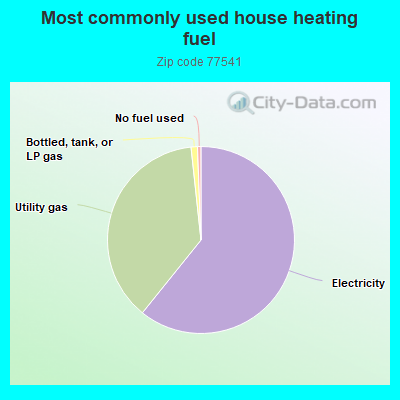
60.8%Electricity
37.5%Utility gas
1.1%Bottled, tank, or LP gas
0.6%No fuel used
Population in 1990: 17,049. Population change in the 1990s: +1,417 (+8.3%).
Place of birth for U.S.-born residents:
This state: 12,372
Northeast: 249
Midwest: 1,048
South: 1,410
West: 846
54% of the 77541 zip code residents lived in the same house 5 years ago. Out of people who lived in different houses, 70% lived in this county. Out of people who lived in different counties, 50% lived in Texas.
89% of the 77541 zip code residents lived in the same house 1 year ago. Out of people who lived in different houses, 54% moved from this county. Out of people who lived in different houses, 32% moved from different county within same state. Out of people who lived in different houses, 13% moved from different state.
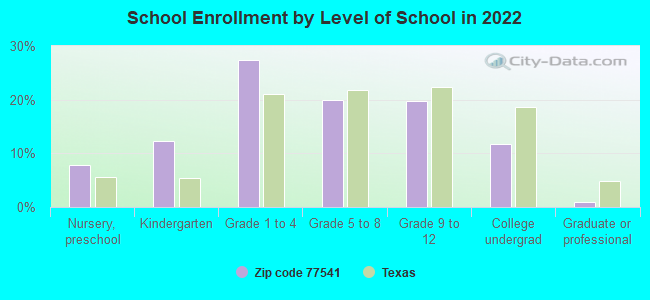
Private vs. public school enrollment:
Students in private schools in grades 1 to 8 (elementary and middle school): 37
Here:
1.9%
Texas:
8.8%
Students in private schools in grades 9 to 12 (high school): 17
Here:
2.1%
Texas:
8.0%
Students in private undergraduate colleges: 90
Here:
18.3%
Texas:
16.2%
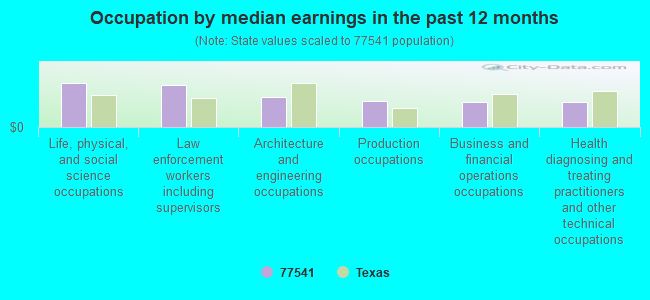
Occupation by median earnings in the past 12 months ($)
114,339Life, physical, and social science occupations
110,288Law enforcement workers including supervisors
78,571Architecture and engineering occupations
68,256Production occupations
65,450Business and financial operations occupations
64,317Health diagnosing and treating practitioners and other technical occupations
Companies with federal contracts located in this zip code:
AMERICAN RICE INCORPORATED (0000) (505 PORT RD in FREEPORT, TX; small business) : $3,024,091 in 21 contractsfrom 1999 to 2004
Contracts for Bakery and Cereal Products by Agricultural Stabilization and Conservation Service (disused code), Farm Service Agency Signed by year:2000: $99,000; 2001: $636,000; 2002: $510,974; 2003: $893,598; 2004: $266,519; 2005: $0; 2006: $0.
Biggest contracts:
$437,000 with Agricultural Stabilization and Conservation Service (disused code) for Bakery and Cereal Products. Signed on 1999-10-15. Completion date: 1999-11-15.
$340,268 with Farm Service Agency for Bakery and Cereal Products. Signed on 2003-11-18. Completion date: 2004-02-29.
$336,000 with Agricultural Stabilization and Conservation Service (disused code) for Bakery and Cereal Products. Signed on 2001-11-15. Completion date: 2002-02-15.
$317,974 with Farm Service Agency for Bakery and Cereal Products. Signed on 2002-11-15. Completion date: 2003-02-15.
ALJE CONTRACT SERVICES LLC (1821 N AVE J in FREEPORT, TX; small business) : $458,557 in 6 contractsfrom 2005 to 2006
Contracts for Maintenance, Repair or Alteration of Real Property -- Other Conservation and Development Facilities, Construction of Structures and Facilities -- Recreational Buildings, Maintenance, Repair and Rebuilding of Equipment -- Ship and Marine Equipment by Army, U.S. Army Corps of Engineers - civil program financing only Signed by year:2000: $0; 2001: $0; 2002: $0; 2003: $0; 2004: $0; 2005: $79,673; 2006: $378,884.
Biggest contracts:
$172,073 with Army for Maintenance, Repair or Alteration of Real Property -- Other Conservation and Development Facilities. Signed on 2006-06-29. Completion date: 2006-03-08.
$109,711, same as above.Signed on 2006-06-29. Completion date: 2006-11-30.
$97,100 with Army for Construction of Structures and Facilities -- Recreational Buildings. Signed on 2006-06-29. Completion date: 2006-09-30.
$43,325 with Army for Maintenance, Repair or Alteration of Real Property -- Other Conservation and Development Facilities. Signed on 2005-12-27. Completion date: 2006-01-22.
GALAXY ROOFING (327 W 8TH ST in FREEPORT, TX; small business) : $8,200 in 2 contractsin 2004
$4,100 with U.S. Army Corps of Engineers - civil program financing only for Maintenance, Repair or Alteration of Real Property -- Office Buildings. Signed on 2004-04-05. Completion date: 2004-04-09.
$4,100 with Army for Maintenance, Repair or Alteration of Real Property -- Office Buildings. Signed on 2004-04-05. Completion date: 2004-04-09.
Top industries in this zip code by the number of employees in 2005:
Other Services (except Public Administration): Commercial and Industrial Machinery and Equipment (except Automotive and Electronic) Repair and Maintenance (100-249: 1, 5-9: 1, 1-4: 1)
Administrative and Support and Waste Management and Remediation Services: Janitorial Services (100-249: 1)
People in group quarters in 2010:
41 people in emergency and transitional shelters (with sleeping facilities) for people experiencing homelessness
29 people in residential treatment centers for adults
21 people in group homes for juveniles (non-correctional)
3 people in local jails and other municipal confinement facilities
People in group quarters in 2000:
43 people in other noninstitutional group quarters
12 people in local jails and other confinement facilities (including police lockups)
7 people in crews of maritime vessels
3 people in military barracks, etc.
3 people in military ships
Fatal accident statistics in 2014:
Fatal accident count: 1
Vehicles involved in fatal accidents: 1
Fatal accidents caused by drunken drivers: 1
Fatalities: 1
Persons involved in fatal accidents: 1
Pedestrians involved in fatal accidents: 0
Fatal accident statistics in 2013:
Fatal accident count: 2
Vehicles involved in fatal accidents: 4
Fatal accidents caused by drunken drivers: 0
Fatalities: 2
Persons involved in fatal accidents: 4
Pedestrians involved in fatal accidents: 0
Home Mortgage Disclosure Act Aggregated Statistics For Year 2009 (Based on 46 partial tracts)
A) FHA, FSA/RHS & VA Home Purchase Loans
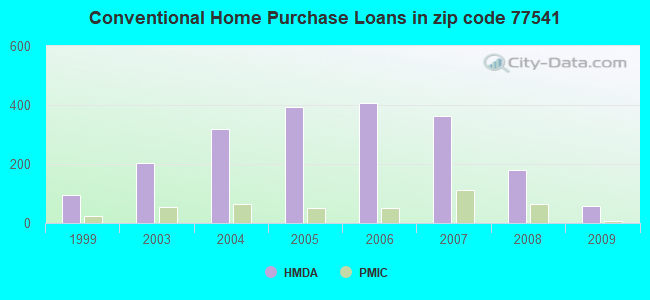
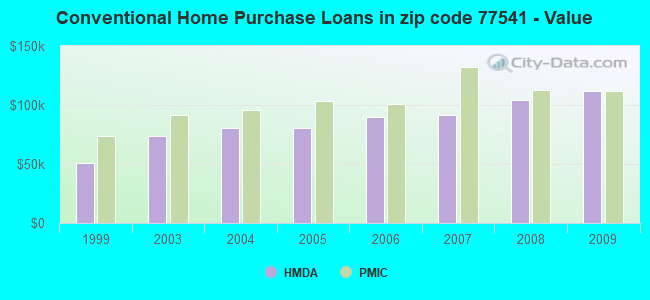
B) Conventional Home Purchase Loans
C) Refinancings
D) Home Improvement Loans
E) Loans on Dwellings For 5+ Families
F) Non-occupant Loans on < 5 Family Dwellings (A B C & D)
G) Loans On Manufactured Home Dwelling (A B C & D)
Number
Average Value
Number
Average Value
Number
Average Value
Number
Average Value
Number
Average Value
Number
Average Value
Number
Average Value
LOANS ORIGINATED
65
$92,285
58
$111,649
96
$126,966
14
$55,541
1
$205,920
60
$129,328
5
$47,138
APPLICATIONS APPROVED, NOT ACCEPTED
8
$78,345
17
$121,814
19
$112,721
4
$49,368
0
$0
11
$112,520
3
$42,690
APPLICATIONS DENIED
20
$104,748
31
$83,299
70
$114,011
45
$28,800
0
$0
20
$156,338
9
$67,178
APPLICATIONS WITHDRAWN
6
$129,900
105
$100,696
90
$109,168
8
$40,332
0
$0
17
$149,905
2
$72,580
FILES CLOSED FOR INCOMPLETENESS
1
$145,700
5
$112,254
17
$133,966
5
$38,314
0
$0
4
$95,665
3
$50,483
Aggregated Statistics For Year 2008 (Based on 46 partial tracts)
A) FHA, FSA/RHS & VA Home Purchase Loans
B) Conventional Home Purchase Loans
C) Refinancings
D) Home Improvement Loans
F) Non-occupant Loans on < 5 Family Dwellings (A B C & D)
G) Loans On Manufactured Home Dwelling (A B C & D)
Number
Average Value
Number
Average Value
Number
Average Value
Number
Average Value
Number
Average Value
Number
Average Value
LOANS ORIGINATED
77
$93,093
178
$104,554
141
$95,108
36
$43,496
118
$111,484
13
$42,552
APPLICATIONS APPROVED, NOT ACCEPTED
4
$96,745
32
$108,846
17
$88,655
8
$35,950
13
$141,816
8
$74,099
APPLICATIONS DENIED
24
$82,286
144
$87,905
135
$85,891
66
$26,801
55
$80,415
16
$51,734
APPLICATIONS WITHDRAWN
10
$94,347
120
$118,521
60
$89,100
8
$50,451
25
$101,169
0
$0
FILES CLOSED FOR INCOMPLETENESS
3
$80,840
13
$56,326
13
$108,124
3
$52,407
8
$68,015
3
$20,940
Aggregated Statistics For Year 2007 (Based on 46 partial tracts)
A) FHA, FSA/RHS & VA Home Purchase Loans
B) Conventional Home Purchase Loans
C) Refinancings
D) Home Improvement Loans
E) Loans on Dwellings For 5+ Families
F) Non-occupant Loans on < 5 Family Dwellings (A B C & D)
G) Loans On Manufactured Home Dwelling (A B C & D)
Number
Average Value
Number
Average Value
Number
Average Value
Number
Average Value
Number
Average Value
Number
Average Value
Number
Average Value
LOANS ORIGINATED
80
$81,857
364
$91,813
211
$81,368
66
$37,624
2
$1,745,280
207
$95,010
23
$55,145
APPLICATIONS APPROVED, NOT ACCEPTED
5
$78,342
65
$137,658
25
$87,691
7
$53,533
0
$0
35
$132,730
4
$77,232
APPLICATIONS DENIED
16
$65,130
246
$128,214
197
$82,346
93
$34,293
0
$0
88
$98,290
30
$51,539
APPLICATIONS WITHDRAWN
8
$97,532
121
$101,495
114
$93,656
14
$84,601
0
$0
26
$98,398
7
$78,153
FILES CLOSED FOR INCOMPLETENESS
0
$0
17
$141,825
21
$135,713
9
$81,513
0
$0
10
$101,483
0
$0
Aggregated Statistics For Year 2006 (Based on 46 partial tracts)
A) FHA, FSA/RHS & VA Home Purchase Loans
B) Conventional Home Purchase Loans
C) Refinancings
D) Home Improvement Loans
E) Loans on Dwellings For 5+ Families
F) Non-occupant Loans on < 5 Family Dwellings (A B C & D)
G) Loans On Manufactured Home Dwelling (A B C & D)
Number
Average Value
Number
Average Value
Number
Average Value
Number
Average Value
Number
Average Value
Number
Average Value
Number
Average Value
LOANS ORIGINATED
50
$82,705
406
$89,524
211
$91,399
53
$37,370
3
$1,382,513
174
$107,243
20
$49,266
APPLICATIONS APPROVED, NOT ACCEPTED
2
$94,455
70
$137,182
31
$117,849
11
$29,498
0
$0
26
$135,437
16
$43,101
APPLICATIONS DENIED
8
$70,611
217
$106,930
201
$72,133
94
$36,453
0
$0
61
$118,101
27
$35,481
APPLICATIONS WITHDRAWN
5
$52,364
154
$80,532
186
$87,782
13
$79,838
0
$0
68
$87,455
1
$108,230
FILES CLOSED FOR INCOMPLETENESS
0
$0
16
$101,335
34
$143,824
3
$82,277
0
$0
13
$140,624
0
$0
Aggregated Statistics For Year 2005 (Based on 46 partial tracts)
A) FHA, FSA/RHS & VA Home Purchase Loans
B) Conventional Home Purchase Loans
C) Refinancings
D) Home Improvement Loans
E) Loans on Dwellings For 5+ Families
F) Non-occupant Loans on < 5 Family Dwellings (A B C & D)
G) Loans On Manufactured Home Dwelling (A B C & D)
Number
Average Value
Number
Average Value
Number
Average Value
Number
Average Value
Number
Average Value
Number
Average Value
Number
Average Value
LOANS ORIGINATED
43
$70,790
393
$80,429
248
$83,328
44
$73,886
2
$1,636,200
213
$104,729
16
$57,249
APPLICATIONS APPROVED, NOT ACCEPTED
3
$73,587
98
$68,567
62
$87,267
10
$61,137
0
$0
24
$103,343
14
$50,426
APPLICATIONS DENIED
11
$70,255
247
$102,271
330
$76,346
85
$32,205
2
$57,420
88
$83,408
41
$55,429
APPLICATIONS WITHDRAWN
5
$87,596
82
$138,361
163
$103,335
52
$126,094
2
$39,085
22
$267,688
4
$79,958
FILES CLOSED FOR INCOMPLETENESS
4
$67,142
16
$93,448
48
$102,305
5
$45,080
0
$0
10
$143,806
2
$40,905
Aggregated Statistics For Year 2004 (Based on 46 partial tracts)
A) FHA, FSA/RHS & VA Home Purchase Loans
B) Conventional Home Purchase Loans
C) Refinancings
D) Home Improvement Loans
E) Loans on Dwellings For 5+ Families
F) Non-occupant Loans on < 5 Family Dwellings (A B C & D)
G) Loans On Manufactured Home Dwelling (A B C & D)
Number
Average Value
Number
Average Value
Number
Average Value
Number
Average Value
Number
Average Value
Number
Average Value
Number
Average Value
LOANS ORIGINATED
60
$77,930
320
$80,471
266
$78,477
82
$36,729
0
$0
172
$81,144
20
$56,067
APPLICATIONS APPROVED, NOT ACCEPTED
5
$95,244
73
$81,523
87
$65,894
12
$63,288
0
$0
17
$103,513
16
$33,659
APPLICATIONS DENIED
16
$67,806
164
$68,877
302
$66,126
111
$19,359
0
$0
60
$83,902
33
$38,484
APPLICATIONS WITHDRAWN
9
$68,561
60
$72,997
187
$73,199
24
$31,856
1
$230,780
21
$76,600
6
$49,203
FILES CLOSED FOR INCOMPLETENESS
3
$112,137
12
$87,182
75
$87,488
4
$26,442
0
$0
5
$182,640
1
$38,220
Aggregated Statistics For Year 2003 (Based on 46 partial tracts)
A) FHA, FSA/RHS & VA Home Purchase Loans
B) Conventional Home Purchase Loans
C) Refinancings
D) Home Improvement Loans
F) Non-occupant Loans on < 5 Family Dwellings (A B C & D)
Number
Average Value
Number
Average Value
Number
Average Value
Number
Average Value
Number
Average Value
LOANS ORIGINATED
67
$71,339
202
$73,791
390
$75,347
43
$21,192
134
$78,254
APPLICATIONS APPROVED, NOT ACCEPTED
5
$71,040
32
$88,040
102
$66,500
4
$7,535
29
$105,460
APPLICATIONS DENIED
11
$73,595
110
$60,884
352
$66,037
59
$13,185
49
$88,608
APPLICATIONS WITHDRAWN
7
$79,781
28
$82,271
232
$72,317
3
$85,327
19
$133,437
FILES CLOSED FOR INCOMPLETENESS
3
$49,900
24
$60,627
11
$92,324
6
$20,533
6
$68,205
Aggregated Statistics For Year 1999 (Based on 2 full and 22 partial tracts)
A) FHA, FSA/RHS & VA Home Purchase Loans
B) Conventional Home Purchase Loans
C) Refinancings
D) Home Improvement Loans
E) Loans on Dwellings For 5+ Families
F) Non-occupant Loans on < 5 Family Dwellings (A B C & D)
2002 - 2018 National Fire Incident Reporting System (NFIRS) incidents
According to the data from the years 2002 - 2018 the average number of fires per year is 71. The highest number of reported fire incidents - 124 took place in 2014, and the least - 21 in 2007. The data has a growing trend.
When looking into fire subcategories, the most incidents belonged to: Outside Fires (46.7%), and Structure Fires (31.7%).
Fire incident types reported to NFIRS in Zip Code 77541


 Nearest zip codes: 77531, 77566, 77534, 77515, 77577, 77422.


 According to the data from the years 2002 - 2018 the average number of fires per year is 71. The highest number of reported fire incidents - 124 took place in 2014, and the least - 21 in 2007. The data has a growing trend.
 When looking into fire subcategories, the most incidents belonged to: Outside Fires (46.7%), and Structure Fires (31.7%).