Estimated zip code population in 2022: 877 Zip code population in 2010: 1,218 Zip code population in 2000: 1,013
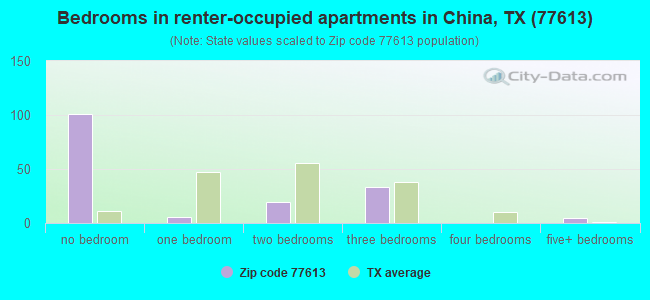
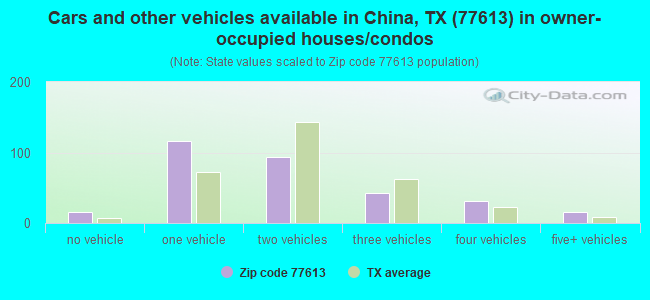
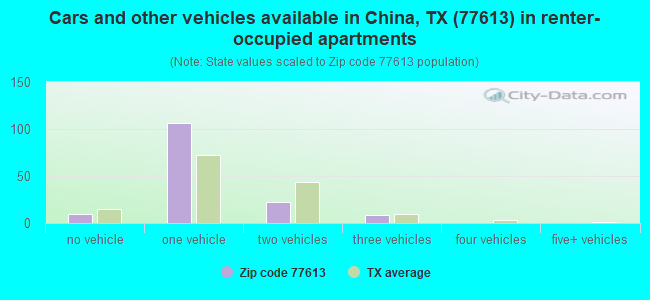
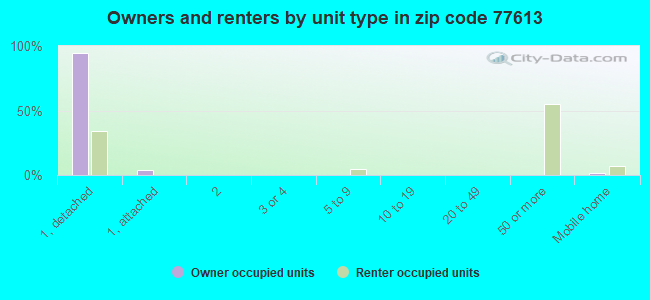
Houses and condos: 494 Renter-occupied apartments: 143
% of renters here:
31%
State:
38%
March 2022 cost of living index in zip code 77613: 80.3 (low, U.S. average is 100)
Land area: 38.0 sq. mi. Water area: 0.3 sq. mi.
Population density: 23 people per square mile
(very low).
OSM Map
General Map
Google Map
MSN Map
OSM Map
General Map
Google Map
MSN Map
OSM Map
General Map
Google Map
MSN Map
OSM Map
General Map
Google Map
MSN Map
Please wait while loading the map...
Real estate property taxes paid for housing units in 2022:
This zip code:
0.9% ($1,932)
Texas:
1.5% ($4,050)
Median real estate property taxes paid for housing units with mortgages in 2022: $1,594 (0.7%) Median real estate property taxes paid for housing units with no mortgage in 2022: $2,094 (1.1%)
Business Search- 14 Million verified businesses
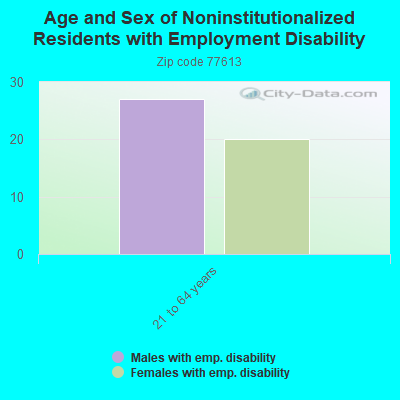
Males: 382
(43.5%)
Females: 495
(56.5%)
For population 25 years and over in 77613:
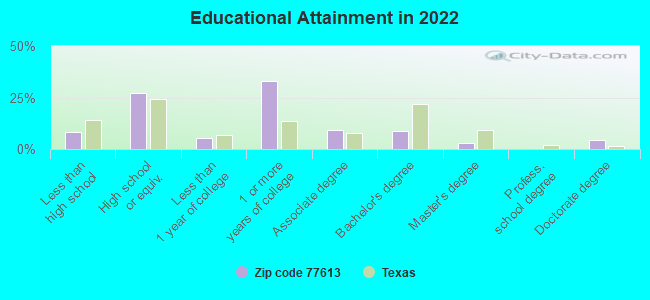
High school or higher: 89.0%
Bachelor's degree or higher: 16.1%
Graduate or professional degree: 7.6%
Unemployed: 7.6%
Mean travel time to work (commute): 30.5 minutes
For population 15 years and over in 77613:
Never married: 29.0%
Now married: 57.7%
Separated: 0.7%
Widowed: 9.3%
Divorced: 3.3%
Zip code 77613 compared to state average:
Unemployed percentage above state average.
Black race population percentage above state average.
Hispanic race population percentage significantly below state average.
Median age above state average.
Foreign-born population percentage significantly below state average.
Length of stay since moving in significantly above state average.
Number of college students significantly below state average.
Percentage of population with a bachelor's degree or higher below state average.
Averages for the 2004 tax year for zip code 77613, filed in 2005:
Average Adjusted Gross Income (AGI) in 2004: $39,703 (Individual Income Tax Returns)
Here:
$39,703
State:
$47,881
Salary/wage: $36,450 (reported on 88.7% of returns)
Here:
$36,450
State:
$41,947
(% of AGI for various income ranges: 109.3% for AGIs below $10k, 81.8% for AGIs $10k-25k, 84.9% for AGIs $25k-50k, 86.7% for AGIs $50k-75k, 90.1% for AGIs $75k-100k, 65.8% for AGIs over 100k)
Taxable interest for individuals: $747 (reported on 33.0% of returns)
This zip code:
$747
Texas:
$2,255
(% of AGI for various income ranges: 2.9% for AGIs below $10k, 0.7% for AGIs $10k-25k, 0.4% for AGIs $25k-50k, 0.3% for AGIs $50k-75k, 0.2% for AGIs $75k-100k, 1.1% for AGIs over 100k)
Taxable dividends: $1,232 (reported on 13.4% of returns)
Here:
$1,232
State:
$4,261
(% of AGI for various income ranges: 0.3% for AGIs $10k-25k, 0.3% for AGIs $25k-50k, 0.1% for AGIs $50k-75k, 0.2% for AGIs $75k-100k, 1.1% for AGIs over 100k)
Net capital gain/loss: +$7,647 (reported on 9.6% of returns)
Here:
+$7,647
State:
+$16,110
(% of AGI for various income ranges: 0.3% for AGIs below $10k, 0.2% for AGIs $25k-50k, -0.1% for AGIs $50k-75k, 0.2% for AGIs $75k-100k, 7.0% for AGIs over 100k)
Profit/loss from business: +$5,075 (reported on 13.2% of returns)
Here:
+$5,075
State:
+$11,013
(% of AGI for various income ranges: 1.4% for AGIs below $10k, 1.7% for AGIs $10k-25k, 3.1% for AGIs $25k-50k, 1.8% for AGIs $50k-75k, 2.1% for AGIs $75k-100k)
IRA payment deduction: $1,400 (reported on 1.4% of returns)
77613:
$1,400
Texas:
$3,120
Total itemized deductions: $15,660 (23% of AGI, reported on 15.0% of returns)
Here:
$15,660
State:
$19,631
Here:
23.0% of AGI
State:
18.9% of AGI
(% of AGI for various income ranges: 6.1% for AGIs $10k-25k, 8.5% for AGIs $25k-50k, 8.1% for AGIs $50k-75k, 5.4% for AGIs over 100k)
Charity contributions deductions: $3,481 (5% of AGI, reported on 11.5% of returns)
Here:
$3,481
State:
$4,753
Here:
4.5% of AGI
State:
4.2% of AGI
Total tax: $6,118 (reported on 70.9% of returns)
77613:
$6,118
State:
$9,058
(% of AGI for various income ranges: 1.4% for AGIs below $10k, 3.1% for AGIs $10k-25k, 6.1% for AGIs $25k-50k, 8.7% for AGIs $50k-75k, 11.4% for AGIs $75k-100k, 21.4% for AGIs over 100k)
Earned income credit: $1,730 (reported on 20.9% of returns)
Here:
$1,730
State:
$2,024
Percentage of individuals using paid preparers for their 2004 taxes: 58.3%
Here:
58%
State:
57%
(% for various income ranges: 58.3% for AGIs below $10k, 51.7% for AGIs $10k-25k, 55.3% for AGIs $25k-50k, 63.1% for AGIs $50k-75k, 67.3% for AGIs $75k-100k, 80.6% for AGIs over 100k)
Household received Food Stamps/SNAP in the past 12 months: 26 Household did not receive Food Stamps/SNAP in the past 12 months: 428
Women who had a birth in the past 12 months: 11 (11 now married, 0 unmarried) Women who did not have a birth in the past 12 months: 217 (88 now married, 129 unmarried)
Housing units in zip code 77613 with a mortgage: 106 Houses without a mortgage: 6
Median monthly owner costs for units with a mortgage: $1,346 Median monthly owner costs for units without a mortgage: $631
Residents with income below the poverty level in 2022:
This zip code:
10.3%
Whole state:
14.0%
Residents with income below 50% of the poverty level in 2022:
This zip code:
1.1%
Whole state:
7.4%
Median number of rooms in houses and condos:
Here:
5.2
State:
6.3
Median number of rooms in apartments:
Here:
1.5
State:
4.0
Notable locations in this zip code not listed on our city pages
In group quarters: 2 (-1 institutionalized population)
Size of family households: 143 2-persons, 76 3-persons, 35 4-persons, 5 5-persons
Size of nonfamily households: 192 1-person, 6 2-persons
115 married couples with children.
61 single-parent households (50 men, 11 women).
90.2% of residents of 77613 zip code speak English at home.
4.1% of residents speak Spanish at home (66% very well, 14% well, 20% not well).
3.5% of residents speak other Indo-European language at home (100% very well).
2.0% of residents speak Asian or Pacific Island language at home (35% well, 65% not well).
Foreign born population: 41 (4.8%) (31.5% of them are naturalized citizens)
This zip code:
4.8%
Whole state:
17.2%
43%Thailand
29%Honduras
10%Malaysia
10%Haiti
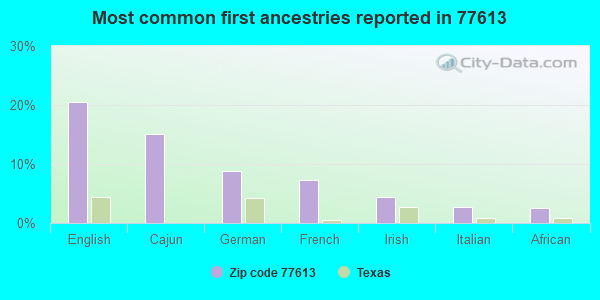
20%English
15%Cajun
9%German
7%French
4%Irish
3%Italian
2%African
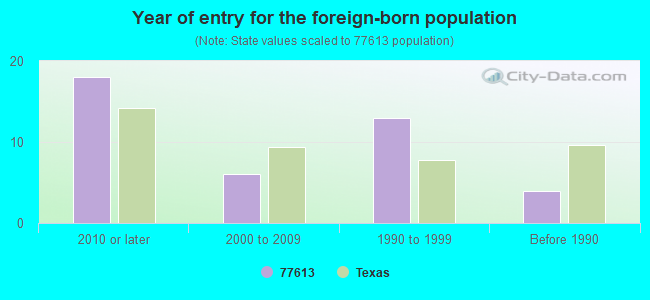
Year of entry for the foreign-born population
182010 or later
62000 to 2009
131990 to 1999
4Before 1990
Housing units lacking complete plumbing facilities: 3.0% Housing units lacking complete kitchen facilities: 3.3%
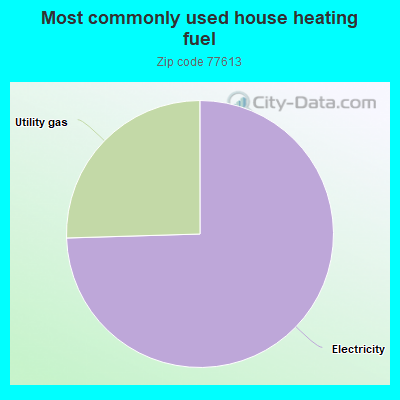
74.6%Electricity
25.5%Utility gas
Place of birth for U.S.-born residents:
This state: 686
Midwest: 9
South: 112
West: 20
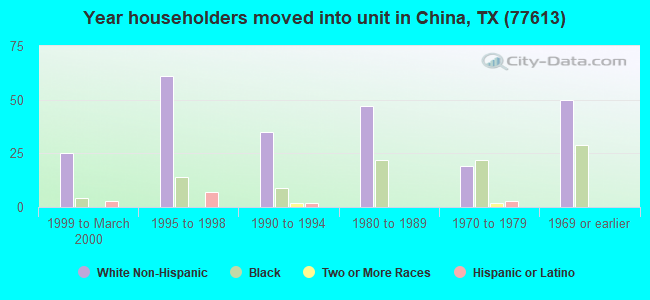
66% of the 77613 zip code residents lived in the same house 5 years ago. Out of people who lived in different houses, 65% lived in this county. Out of people who lived in different counties, 50% lived in Texas.
98% of the 77613 zip code residents lived in the same house 1 year ago. Out of people who lived in different houses, 108% moved from this county.
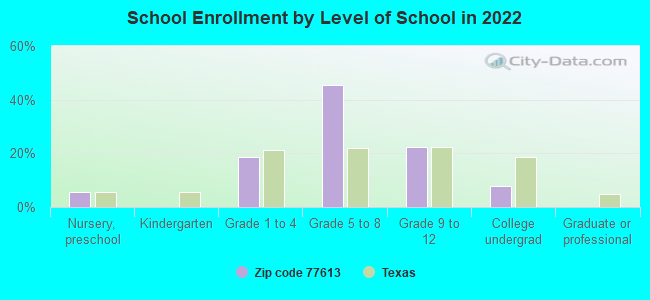
Private vs. public school enrollment:
Students in private schools in grades 1 to 8 (elementary and middle school): 21
Here:
21.7%
Texas:
8.8%
Students in private schools in grades 9 to 12 (high school): 6
Here:
18.1%
Texas:
8.0%
Students in private undergraduate colleges:
Here:
0.0%
Texas:
16.2%
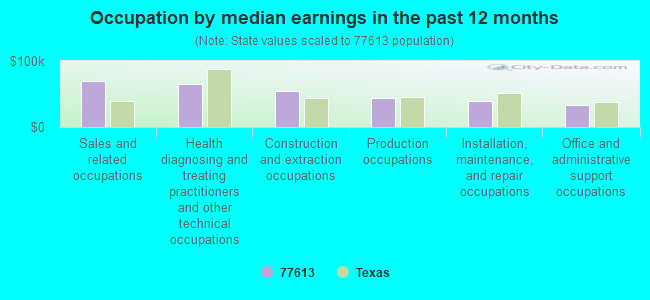
Occupation by median earnings in the past 12 months ($)
68,982Sales and related occupations
65,005Health diagnosing and treating practitioners and other technical occupations
54,715Construction and extraction occupations
44,126Production occupations
39,487Installation, maintenance, and repair occupations
33,328Office and administrative support occupations
Companies with federal contracts located in this zip code:
BENNETT'S FENCE COMPANY (UKNOWN in CHINA, TX; small business) 3 employees, $130000 revenue. : $16,738 in 2 contractsfrom 2001 to 2003
$18,000 with U.S. Fish and Wildlife Service for Maintenance, Repair or Alteration of Real Property -- Other Non-Building Facilities. Signed on 2001-08-15. Completion date: 2001-11-15.
-$1,262, same as above.Signed on 2003-01-15. Completion date: 2001-11-15.
Top industries in this zip code by the number of employees in 2005:
Health Care and Social Assistance: Child Day Care Services (5-9 employees: 1 establishment)
Health Care and Social Assistance: Home Health Care Services (5-9: 1)
Other Services (except Public Administration): Religious Organizations (1-4: 2)
Construction: Commercial and Institutional Building Construction (1-4: 1)
Construction: Electrical Contractors (1-4: 1)
People in group quarters in 2010:
2 people in workers' group living quarters and job corps centers
Fatal accident statistics in 2014:
Fatal accident count: 1
Vehicles involved in fatal accidents: 2
Fatal accidents caused by drunken drivers: 0
Fatalities: 1
Persons involved in fatal accidents: 3
Pedestrians involved in fatal accidents: 0
Fatal accident statistics in 2013:
Fatal accident count: 1
Vehicles involved in fatal accidents: 2
Fatal accidents caused by drunken drivers: 0
Fatalities: 2
Persons involved in fatal accidents: 3
Pedestrians involved in fatal accidents: 0
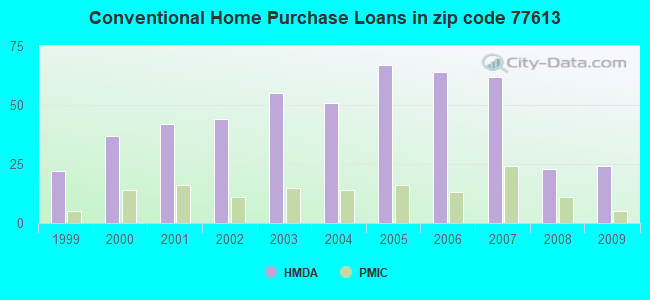
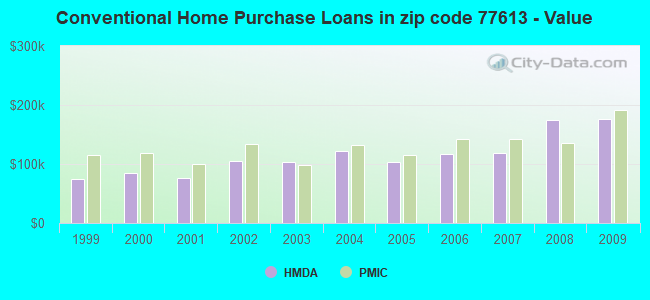
Home Mortgage Disclosure Act Aggregated Statistics For Year 2009 (Based on 8 partial tracts)
A) FHA, FSA/RHS & VA Home Purchase Loans
B) Conventional Home Purchase Loans
C) Refinancings
D) Home Improvement Loans
F) Non-occupant Loans on < 5 Family Dwellings (A B C & D)
G) Loans On Manufactured Home Dwelling (A B C & D)
Number
Average Value
Number
Average Value
Number
Average Value
Number
Average Value
Number
Average Value
Number
Average Value
LOANS ORIGINATED
18
$133,794
24
$175,772
37
$149,205
10
$88,091
1
$74,780
4
$38,085
APPLICATIONS APPROVED, NOT ACCEPTED
1
$155,070
3
$98,870
3
$78,127
1
$21,140
0
$0
1
$71,030
APPLICATIONS DENIED
5
$139,142
7
$160,216
24
$123,024
10
$23,727
1
$46,580
4
$68,148
APPLICATIONS WITHDRAWN
1
$88,280
1
$108,960
7
$132,953
0
$0
0
$0
1
$31,720
FILES CLOSED FOR INCOMPLETENESS
1
$256,310
1
$244,740
3
$158,050
1
$5,290
0
$0
1
$38,590
Aggregated Statistics For Year 2008 (Based on 8 partial tracts)
A) FHA, FSA/RHS & VA Home Purchase Loans
B) Conventional Home Purchase Loans
C) Refinancings
D) Home Improvement Loans
F) Non-occupant Loans on < 5 Family Dwellings (A B C & D)
G) Loans On Manufactured Home Dwelling (A B C & D)
Number
Average Value
Number
Average Value
Number
Average Value
Number
Average Value
Number
Average Value
Number
Average Value
LOANS ORIGINATED
9
$131,019
23
$175,180
26
$129,920
13
$51,678
2
$271,970
3
$49,583
APPLICATIONS APPROVED, NOT ACCEPTED
4
$109,900
10
$101,017
5
$97,116
6
$50,305
1
$74,610
6
$45,712
APPLICATIONS DENIED
5
$151,314
14
$143,398
33
$109,475
16
$43,458
3
$60,163
5
$65,546
APPLICATIONS WITHDRAWN
2
$186,910
3
$205,627
7
$131,169
2
$57,615
0
$0
0
$0
FILES CLOSED FOR INCOMPLETENESS
2
$131,265
1
$206,150
1
$53,860
1
$72,950
0
$0
0
$0
Aggregated Statistics For Year 2007 (Based on 8 partial tracts)
A) FHA, FSA/RHS & VA Home Purchase Loans
B) Conventional Home Purchase Loans
C) Refinancings
D) Home Improvement Loans
E) Loans on Dwellings For 5+ Families
F) Non-occupant Loans on < 5 Family Dwellings (A B C & D)
G) Loans On Manufactured Home Dwelling (A B C & D)
Number
Average Value
Number
Average Value
Number
Average Value
Number
Average Value
Number
Average Value
Number
Average Value
Number
Average Value
LOANS ORIGINATED
4
$123,600
62
$118,548
37
$121,944
19
$33,126
1
$695,840
4
$110,212
5
$42,454
APPLICATIONS APPROVED, NOT ACCEPTED
1
$125,810
10
$111,632
6
$197,570
3
$38,410
0
$0
0
$0
3
$53,817
APPLICATIONS DENIED
1
$127,390
24
$139,408
39
$113,443
23
$39,026
0
$0
5
$101,326
8
$47,099
APPLICATIONS WITHDRAWN
1
$109,680
3
$113,827
13
$113,148
1
$29,070
0
$0
0
$0
1
$40,960
FILES CLOSED FOR INCOMPLETENESS
1
$72,420
3
$146,997
4
$139,358
0
$0
0
$0
1
$72,420
0
$0
Aggregated Statistics For Year 2006 (Based on 8 partial tracts)
A) FHA, FSA/RHS & VA Home Purchase Loans
B) Conventional Home Purchase Loans
C) Refinancings
D) Home Improvement Loans
F) Non-occupant Loans on < 5 Family Dwellings (A B C & D)
G) Loans On Manufactured Home Dwelling (A B C & D)
Number
Average Value
Number
Average Value
Number
Average Value
Number
Average Value
Number
Average Value
Number
Average Value
LOANS ORIGINATED
8
$105,379
64
$117,362
30
$131,551
15
$40,622
4
$119,860
5
$44,506
APPLICATIONS APPROVED, NOT ACCEPTED
1
$44,400
11
$72,347
10
$82,086
4
$54,562
1
$25,370
8
$48,104
APPLICATIONS DENIED
1
$121,050
29
$83,919
36
$119,613
17
$41,282
3
$61,493
12
$36,009
APPLICATIONS WITHDRAWN
0
$0
7
$145,894
21
$108,906
1
$71,470
2
$41,495
1
$15,860
FILES CLOSED FOR INCOMPLETENESS
0
$0
2
$119,200
8
$129,266
0
$0
1
$44,400
0
$0
Aggregated Statistics For Year 2005 (Based on 8 partial tracts)
A) FHA, FSA/RHS & VA Home Purchase Loans
B) Conventional Home Purchase Loans
C) Refinancings
D) Home Improvement Loans
F) Non-occupant Loans on < 5 Family Dwellings (A B C & D)
G) Loans On Manufactured Home Dwelling (A B C & D)
Number
Average Value
Number
Average Value
Number
Average Value
Number
Average Value
Number
Average Value
Number
Average Value
LOANS ORIGINATED
8
$101,968
67
$102,667
42
$141,033
15
$83,121
5
$77,704
7
$39,840
APPLICATIONS APPROVED, NOT ACCEPTED
0
$0
14
$104,000
5
$53,886
4
$36,750
0
$0
6
$41,887
APPLICATIONS DENIED
1
$65,020
31
$67,278
47
$105,600
22
$30,988
5
$65,440
21
$33,141
APPLICATIONS WITHDRAWN
0
$0
3
$83,747
27
$119,808
7
$221,857
0
$0
0
$0
FILES CLOSED FOR INCOMPLETENESS
0
$0
2
$66,845
4
$130,827
2
$51,655
1
$28,400
0
$0
Aggregated Statistics For Year 2004 (Based on 8 partial tracts)
A) FHA, FSA/RHS & VA Home Purchase Loans
B) Conventional Home Purchase Loans
C) Refinancings
D) Home Improvement Loans
F) Non-occupant Loans on < 5 Family Dwellings (A B C & D)
G) Loans On Manufactured Home Dwelling (A B C & D)
Number
Average Value
Number
Average Value
Number
Average Value
Number
Average Value
Number
Average Value
Number
Average Value
LOANS ORIGINATED
9
$85,048
51
$121,861
63
$119,461
21
$35,057
6
$42,023
5
$50,006
APPLICATIONS APPROVED, NOT ACCEPTED
1
$45,990
8
$102,710
7
$93,633
6
$50,767
1
$23,790
2
$48,125
APPLICATIONS DENIED
3
$71,360
26
$70,683
51
$98,148
15
$34,567
1
$29,070
13
$46,534
APPLICATIONS WITHDRAWN
1
$77,180
4
$69,125
24
$93,195
2
$92,505
1
$17,440
2
$65,810
FILES CLOSED FOR INCOMPLETENESS
0
$0
2
$71,360
10
$104,750
1
$58,450
0
$0
0
$0
Aggregated Statistics For Year 2003 (Based on 8 partial tracts)
A) FHA, FSA/RHS & VA Home Purchase Loans
B) Conventional Home Purchase Loans
C) Refinancings
D) Home Improvement Loans
F) Non-occupant Loans on < 5 Family Dwellings (A B C & D)
Number
Average Value
Number
Average Value
Number
Average Value
Number
Average Value
Number
Average Value
LOANS ORIGINATED
6
$115,442
55
$103,042
112
$106,397
13
$22,478
3
$85,280
APPLICATIONS APPROVED, NOT ACCEPTED
0
$0
8
$87,285
20
$89,314
2
$27,355
1
$49,160
APPLICATIONS DENIED
1
$22,880
23
$59,657
84
$84,472
14
$20,238
4
$46,650
APPLICATIONS WITHDRAWN
1
$88,800
10
$97,906
32
$88,954
0
$0
1
$43,350
FILES CLOSED FOR INCOMPLETENESS
0
$0
1
$155,940
4
$113,080
0
$0
1
$50,220
Aggregated Statistics For Year 2002 (Based on 8 partial tracts)
A) FHA, FSA/RHS & VA Home Purchase Loans
B) Conventional Home Purchase Loans
C) Refinancings
D) Home Improvement Loans
F) Non-occupant Loans on < 5 Family Dwellings (A B C & D)
Number
Average Value
Number
Average Value
Number
Average Value
Number
Average Value
Number
Average Value
LOANS ORIGINATED
7
$94,407
44
$105,339
51
$110,070
11
$18,939
1
$125,230
APPLICATIONS APPROVED, NOT ACCEPTED
0
$0
9
$88,704
6
$149,788
1
$13,860
2
$33,565
APPLICATIONS DENIED
2
$121,155
21
$54,404
36
$64,535
11
$14,465
3
$36,297
APPLICATIONS WITHDRAWN
0
$0
6
$103,432
14
$93,505
0
$0
0
$0
FILES CLOSED FOR INCOMPLETENESS
0
$0
3
$100,787
9
$77,938
1
$23,790
1
$116,290
Aggregated Statistics For Year 2001 (Based on 8 partial tracts)
A) FHA, FSA/RHS & VA Home Purchase Loans
B) Conventional Home Purchase Loans
C) Refinancings
D) Home Improvement Loans
F) Non-occupant Loans on < 5 Family Dwellings (A B C & D)
Number
Average Value
Number
Average Value
Number
Average Value
Number
Average Value
Number
Average Value
LOANS ORIGINATED
16
$95,642
42
$76,826
43
$93,634
12
$22,299
4
$50,700
APPLICATIONS APPROVED, NOT ACCEPTED
1
$32,770
9
$131,292
12
$62,691
2
$43,485
2
$43,875
APPLICATIONS DENIED
3
$87,747
17
$52,184
19
$59,983
10
$17,123
2
$39,625
APPLICATIONS WITHDRAWN
1
$21,140
5
$85,110
17
$79,695
0
$0
0
$0
FILES CLOSED FOR INCOMPLETENESS
0
$0
2
$56,030
2
$70,455
0
$0
0
$0
Aggregated Statistics For Year 2000 (Based on 8 partial tracts)
A) FHA, FSA/RHS & VA Home Purchase Loans
B) Conventional Home Purchase Loans
C) Refinancings
D) Home Improvement Loans
F) Non-occupant Loans on < 5 Family Dwellings (A B C & D)
Number
Average Value
Number
Average Value
Number
Average Value
Number
Average Value
Number
Average Value
LOANS ORIGINATED
7
$79,547
37
$84,597
15
$102,418
16
$11,926
4
$44,402
APPLICATIONS APPROVED, NOT ACCEPTED
3
$61,743
8
$65,259
5
$70,304
1
$11,800
1
$20,090
APPLICATIONS DENIED
2
$57,880
39
$51,045
12
$80,202
12
$36,190
1
$101,600
APPLICATIONS WITHDRAWN
2
$54,020
5
$85,180
7
$68,849
0
$0
1
$59,050
FILES CLOSED FOR INCOMPLETENESS
0
$0
1
$58,150
3
$91,600
0
$0
0
$0
Aggregated Statistics For Year 1999 (Based on 4 partial tracts)
A) FHA, FSA/RHS & VA Home Purchase Loans
B) Conventional Home Purchase Loans
C) Refinancings
D) Home Improvement Loans
F) Non-occupant Loans on < 5 Family Dwellings (A B C & D)
Detailed PMIC statistics for the following Tracts:0114.00
, 0115.00
2003 - 2018 National Fire Incident Reporting System (NFIRS) incidents
Based on the data from the years 2003 - 2018 the average number of fires per year is 17. The highest number of fire incidents - 30 took place in 2017, and the least - 1 in 2003. The data has a growing trend.
When looking into fire subcategories, the most reports belonged to: Outside Fires (62.0%), and Structure Fires (22.8%).
Fire incident types reported to NFIRS in Zip Code 77613

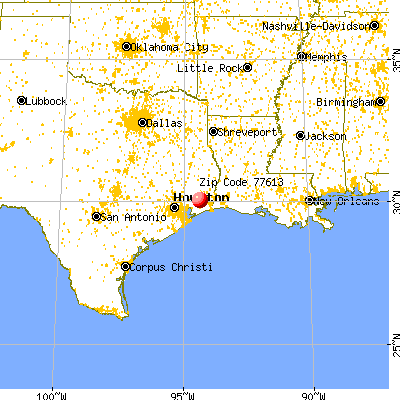


 Nearest zip codes: 77629, 77713, 77659, 77538, 77707, 77706.


 Based on the data from the years 2003 - 2018 the average number of fires per year is 17. The highest number of fire incidents - 30 took place in 2017, and the least - 1 in 2003. The data has a growing trend.
 When looking into fire subcategories, the most reports belonged to: Outside Fires (62.0%), and Structure Fires (22.8%).