Estimated zip code population in 2022: 2,095 Zip code population in 2010: 1,879 Zip code population in 2000: 1,413
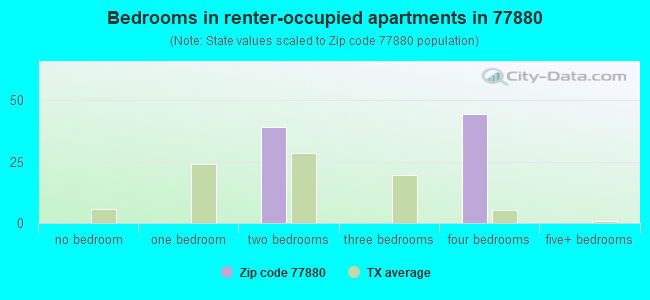
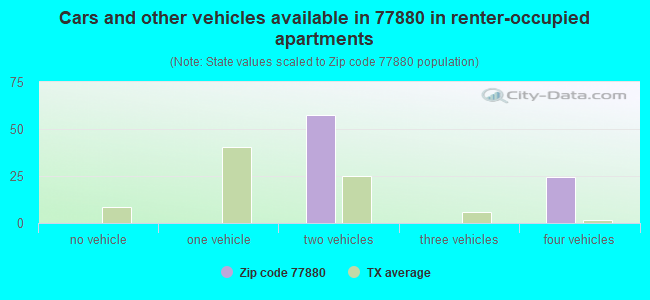
Houses and condos: 1,516 Renter-occupied apartments: 83
% of renters here:
7%
State:
38%
March 2022 cost of living index in zip code 77880: 81.9 (low, U.S. average is 100)
Land area: 95.3 sq. mi. Water area: 1.9 sq. mi.
Population density: 22 people per square mile
(very low).
OSM Map
General Map
Google Map
MSN Map
OSM Map
General Map
Google Map
MSN Map
OSM Map
General Map
Google Map
MSN Map
OSM Map
General Map
Google Map
MSN Map
Please wait while loading the map...
Real estate property taxes paid for housing units in 2022:
This zip code:
1.1% ($3,636)
Texas:
1.5% ($4,050)
Median real estate property taxes paid for housing units with mortgages in 2022: $10,505 (0.5%) Median real estate property taxes paid for housing units with no mortgage in 2022: $3,285 (1.0%)
Business Search- 14 Million verified businesses
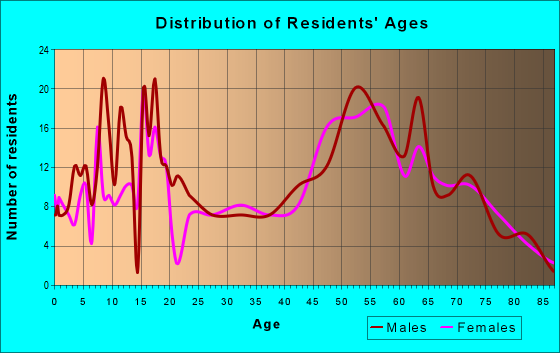
Males: 1,040
(49.6%)
Females: 1,055
(50.4%)
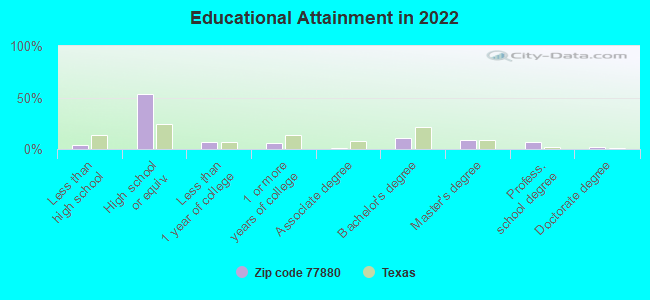
For population 25 years and over in 77880:
High school or higher: 95.7%
Bachelor's degree or higher: 28.0%
Graduate or professional degree: 17.3%
Unemployed: 0.5%
Mean travel time to work (commute): 27.4 minutes
For population 15 years and over in 77880:
Never married: 12.2%
Now married: 65.4%
Separated: 6.1%
Widowed: 7.9%
Divorced: 8.3%
Zip code 77880 compared to state average:
Unemployed percentage significantly below state average.
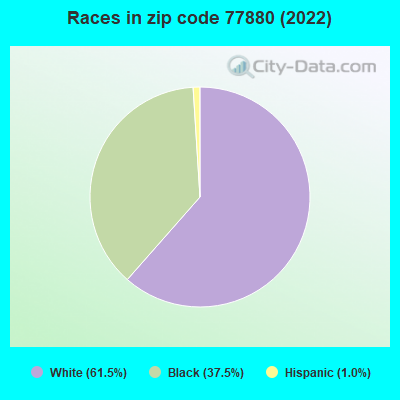
Black race population percentage significantly above state average.
Hispanic race population percentage significantly below state average.
Median age significantly above state average.
Foreign-born population percentage significantly below state average.
Renting percentage significantly below state average.
Length of stay since moving in significantly above state average.
Averages for the 2020 tax year for zip code 77880, filed in 2021:
Average Adjusted Gross Income (AGI) in 2020: $80,173 (Individual Income Tax Returns)
Here:
$80,173
State:
$77,054
Salary/wage: $56,966 (reported on 78.8% of returns)
Here:
$56,966
State:
$62,766
(% of AGI for various income ranges: 1340.0% for AGIs below $25k, 4135.3% for AGIs $25k-50k, 6635.7% for AGIs $50k-75k, 10623.3% for AGIs $75k-100k, 13790.0% for AGIs $100k-200k)
Taxable interest for individuals: $1,826 (reported on 31.8% of returns)
This zip code:
$1,826
Texas:
$2,665
(% of AGI for various income ranges: 15.9% for AGIs below $25k, 31.3% for AGIs $25k-50k, 57.1% for AGIs $50k-75k, 313.3% for AGIs $75k-100k, 75.7% for AGIs $100k-200k)
Ordinary dividends: $9,438 (reported on 18.8% of returns)
Here:
$9,438
State:
$10,044
(% of AGI for various income ranges: 41.4% for AGIs below $25k, 102.9% for AGIs $50k-75k, 831.4% for AGIs $100k-200k)
Net capital gain/loss in AGI: +$39,506 (reported on 21.2% of returns)
Here:
+$39,506
State:
+$39,590
(% of AGI for various income ranges: 46.4% for AGIs below $25k, 250.0% for AGIs $50k-75k, 672.9% for AGIs $100k-200k)
Profit/loss from business: +$8,600 (reported on 20.0% of returns)
Here:
+$8,600
State:
+$10,888
(% of AGI for various income ranges: 28.2% for AGIs below $25k, 432.9% for AGIs $50k-75k, 1567.1% for AGIs $100k-200k)
Taxable individual retirement arrangement distribution: $27,310 (reported on 11.8% of returns)
77880:
$27,310
Texas:
$24,740
(% of AGI for various income ranges: 113.2% for AGIs below $25k, 751.4% for AGIs $50k-75k, 2794.3% for AGIs $100k-200k)
Total itemized deductions: $39,550 (reported on 9.4% of returns)
Here:
$39,550
State:
$40,428
(% of AGI for various income ranges: 640.0% for AGIs $25k-50k, 1274.3% for AGIs $100k-200k)
Charity contributions: $13,950 (reported on 7.1% of returns)
Here:
$13,950
State:
$18,201
(% of AGI for various income ranges: 49.5% for AGIs below $25k, 1040.0% for AGIs $100k-200k)
Taxes paid: $7,186 (reported on 8.2% of returns)
77880:
$7,186
State:
$7,821
(% of AGI for various income ranges: 106.0% for AGIs $25k-50k, 214.3% for AGIs $100k-200k)
Earned income credit: $2,650 (reported on 18.8% of returns)
Here:
$2,650
State:
$2,584
(% of AGI for various income ranges: 135.9% for AGIs below $25k, 83.3% for AGIs $25k-50k)
Percentage of individuals using paid preparers for their 2020 taxes: 90.6%
Here:
91%
State:
92%
(% for various income ranges: 90.3% for AGIs below $25k, 85.7% for AGIs $25k-50k, 81.8% for AGIs $50k-75k, 100.0% for AGIs $75k-100k, 100.0% for AGIs $100k-200k, 100.0% for AGIs over 200k)
Averages for the 2012 tax year for zip code 77880, filed in 2013:
Average Adjusted Gross Income (AGI) in 2012: $55,983 (Individual Income Tax Returns)
Here:
$55,983
State:
$65,384
Salary/wage: $46,024 (reported on 84.0% of returns)
Here:
$46,024
State:
$52,524
(% of AGI for various income ranges: 77.6% for AGIs below $25k, 94.0% for AGIs $25k-50k, 76.6% for AGIs $50k-75k, 66.5% for AGIs $75k-100k, 72.5% for AGIs $100k-200k, 48.4% for AGIs over 200k)
Taxable interest for individuals: $962 (reported on 32.1% of returns)
This zip code:
$962
Texas:
$2,372
(% of AGI for various income ranges: 0.9% for AGIs below $25k, 0.5% for AGIs $25k-50k, 0.2% for AGIs $50k-75k, 0.4% for AGIs $75k-100k, 0.2% for AGIs $100k-200k, 0.8% for AGIs over 200k)
Ordinary dividends: $4,431 (reported on 16.0% of returns)
Here:
$4,431
State:
$9,721
(% of AGI for various income ranges: 2.4% for AGIs below $25k, 1.3% for AGIs $50k-75k, 1.2% for AGIs $75k-100k, 2.0% for AGIs $100k-200k, 1.3% for AGIs over 200k)
Net capital gain/loss in AGI: +$16,631 (reported on 16.0% of returns)
Here:
+$16,631
State:
+$35,319
(% of AGI for various income ranges: 0.5% for AGIs $25k-50k, 1.5% for AGIs $50k-75k, 6.3% for AGIs $100k-200k, 10.7% for AGIs over 200k)
Profit/loss from business: +$5,887 (reported on 18.5% of returns)
Here:
+$5,887
State:
+$13,732
(% of AGI for various income ranges: 5.2% for AGIs below $25k, 0.7% for AGIs $25k-50k, 6.9% for AGIs $50k-75k, 2.8% for AGIs $100k-200k)
Taxable individual retirement arrangement distribution: $17,975 (reported on 9.9% of returns)
77880:
$17,975
Texas:
$19,511
(% of AGI for various income ranges: 2.1% for AGIs below $25k, 6.2% for AGIs $25k-50k, 16.3% for AGIs $75k-100k)
Total itemized deductions: $22,840 (19% of AGI, reported on 24.7% of returns)
Here:
$22,840
State:
$24,724
Here:
18.5% of AGI
State:
15.9% of AGI
(% of AGI for various income ranges: 9.8% for AGIs $25k-50k, 12.5% for AGIs $50k-75k, 11.9% for AGIs $75k-100k, 11.3% for AGIs $100k-200k, 10.8% for AGIs over 200k)
Charity contributions: $6,527 (reported on 18.5% of returns)
Here:
$6,527
State:
$6,808
(% of AGI for various income ranges: 1.6% for AGIs $25k-50k, 2.3% for AGIs $50k-75k, 2.8% for AGIs $75k-100k, 1.9% for AGIs $100k-200k, 2.9% for AGIs over 200k)
Taxes paid: $6,332 (reported on 23.5% of returns)
77880:
$6,332
State:
$6,921
(% of AGI for various income ranges: 2.0% for AGIs $25k-50k, 1.9% for AGIs $50k-75k, 3.0% for AGIs $75k-100k, 3.7% for AGIs $100k-200k, 3.4% for AGIs over 200k)
Earned income credit: $2,391 (reported on 27.2% of returns)
Here:
$2,391
State:
$2,570
(% of AGI for various income ranges: 10.0% for AGIs below $25k, 1.5% for AGIs $25k-50k)
Percentage of individuals using paid preparers for their 2012 taxes: 55.6%
Here:
56%
State:
51%
(% for various income ranges: 46.9% for AGIs below $25k, 60.9% for AGIs $25k-50k, 60.0% for AGIs $50k-75k, 50.0% for AGIs $75k-100k, 66.7% for AGIs $100k-200k, 75.0% for AGIs over 200k)
Averages for the 2004 tax year for zip code 77880, filed in 2005:
Average Adjusted Gross Income (AGI) in 2004: $37,295 (Individual Income Tax Returns)
Here:
$37,295
State:
$47,881
Salary/wage: $34,836 (reported on 84.3% of returns)
Here:
$34,836
State:
$41,947
(% of AGI for various income ranges: 114.5% for AGIs below $10k, 85.2% for AGIs $10k-25k, 85.9% for AGIs $25k-50k, 81.5% for AGIs $50k-75k, 81.3% for AGIs $75k-100k, 66.2% for AGIs over 100k)
Taxable interest for individuals: $1,791 (reported on 35.2% of returns)
This zip code:
$1,791
Texas:
$2,255
(% of AGI for various income ranges: 4.1% for AGIs below $10k, 2.5% for AGIs $10k-25k, 1.8% for AGIs $25k-50k, 1.0% for AGIs $50k-75k, 1.0% for AGIs $75k-100k, 1.7% for AGIs over 100k)
Taxable dividends: $2,630 (reported on 16.6% of returns)
Here:
$2,630
State:
$4,261
(% of AGI for various income ranges: 1.9% for AGIs below $10k, 0.9% for AGIs $10k-25k, 0.9% for AGIs $25k-50k, 0.2% for AGIs $50k-75k, 0.4% for AGIs $75k-100k, 2.2% for AGIs over 100k)
Net capital gain/loss: +$5,395 (reported on 17.3% of returns)
Here:
+$5,395
State:
+$16,110
(% of AGI for various income ranges: 2.5% for AGIs below $10k, -0.1% for AGIs $10k-25k, 2.9% for AGIs $25k-50k, 0.0% for AGIs $50k-75k, 5.4% for AGIs over 100k)
Profit/loss from business: +$1,170 (reported on 13.9% of returns)
Here:
+$1,170
State:
+$11,013
(% of AGI for various income ranges: 13.4% for AGIs below $10k, -0.3% for AGIs $10k-25k, 1.0% for AGIs $25k-50k, 2.3% for AGIs $50k-75k, -4.1% for AGIs $75k-100k)
Total itemized deductions: $17,490 (22% of AGI, reported on 21.0% of returns)
Here:
$17,490
State:
$19,631
Here:
22.3% of AGI
State:
18.9% of AGI
(% of AGI for various income ranges: 10.3% for AGIs $10k-25k, 10.3% for AGIs $25k-50k, 10.4% for AGIs $50k-75k, 11.8% for AGIs $75k-100k, 9.2% for AGIs over 100k)
Charity contributions deductions: $4,642 (6% of AGI, reported on 17.1% of returns)
Here:
$4,642
State:
$4,753
Here:
5.6% of AGI
State:
4.2% of AGI
(% of AGI for various income ranges: 0.9% for AGIs $10k-25k, 1.7% for AGIs $25k-50k, 2.0% for AGIs $50k-75k, 1.1% for AGIs $75k-100k, 3.5% for AGIs over 100k)
Total tax: $6,591 (reported on 62.7% of returns)
77880:
$6,591
State:
$9,058
(% of AGI for various income ranges: 3.6% for AGIs below $10k, 2.2% for AGIs $10k-25k, 5.8% for AGIs $25k-50k, 9.5% for AGIs $50k-75k, 11.2% for AGIs $75k-100k, 19.7% for AGIs over 100k)
Earned income credit: $1,825 (reported on 30.2% of returns)
Here:
$1,825
State:
$2,024
Percentage of individuals using paid preparers for their 2004 taxes: 68.0%
Here:
68%
State:
57%
(% for various income ranges: 62.1% for AGIs below $10k, 67.8% for AGIs $10k-25k, 70.8% for AGIs $25k-50k, 67.6% for AGIs $50k-75k, 69.4% for AGIs $75k-100k, 82.9% for AGIs over 100k)
Household received Food Stamps/SNAP in the past 12 months: 0 Household did not receive Food Stamps/SNAP in the past 12 months: 1,105
Women who did not have a birth in the past 12 months: 267 (75 now married, 192 unmarried)
Housing units in zip code 77880 with a mortgage: 220 (19 second mortgage) Median monthly owner costs for units with a mortgage: $3,777 Median monthly owner costs for units without a mortgage: $491
Residents with income below the poverty level in 2022:
This zip code:
7.8%
Whole state:
14.0%
Residents with income below 50% of the poverty level in 2022:
This zip code:
3.3%
Whole state:
7.4%
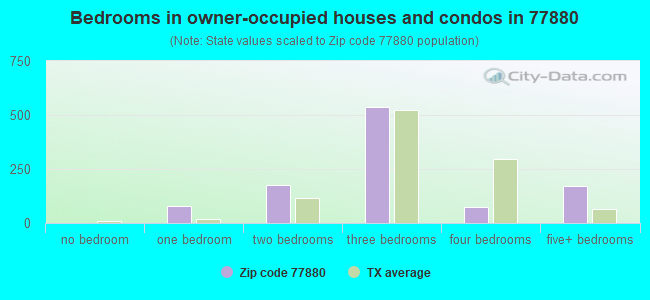
Median number of rooms in houses and condos:
Here:
5.0
State:
6.3
Median number of rooms in apartments:
Here:
6.6
State:
4.0
Notable locations in this zip code not listed on our city pages
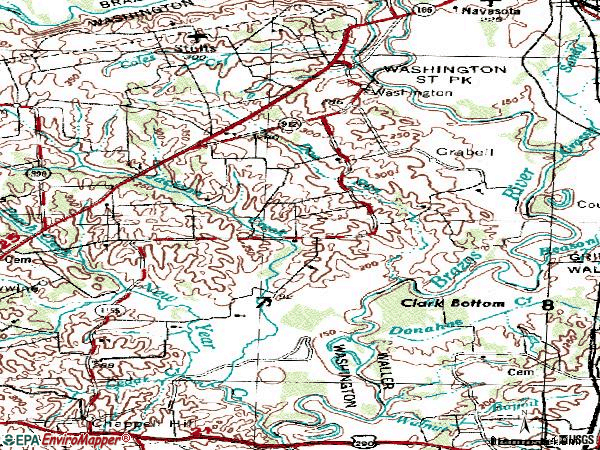
Notable locations in zip code 77880: Hatfield Plantation (A), John M Brown House (B), Star of the Republic Museum (C), Washington Volunteer Fire Department (D), Anson Jones Home (E). Display/hide their locations on the map
Churches in zip code 77880 include: Sacred Heart Church (A), Saint Matthew Church (B), Bethlehem Church (C), Friedens Church (D), Mercy Seat Church (E), Mount Calvary Church (F), Mount Zion Church (G), Paul Felder Church (H). Display/hide their locations on the map
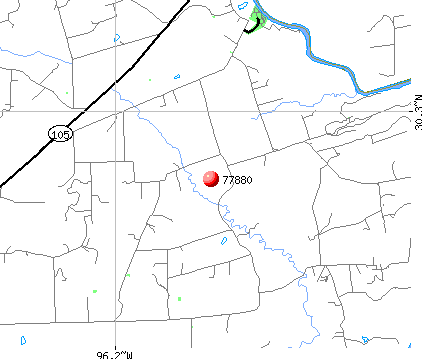
Streams, rivers, and creeks: Sand Branch (A), Rocky Creek (B), Little Cedar Creek (C), Doe Run (D), Coles Creek (E). Display/hide their locations on the map
Size of family households: 681 2-persons, 6 3-persons, 29 4-persons, 34 5-persons, 14 7-or-more-persons
Size of nonfamily households: 356 1-person
228 married couples with children.
13 single-parent households (13 women).
100.8% of residents of 77880 zip code speak English at home.
Foreign born population: 0 (0.0%)
:
0.0%
Whole state:
17.2%
18%German
15%English
5%Norwegian
4%Irish
2%French Canadian
2%European
1%Armenian
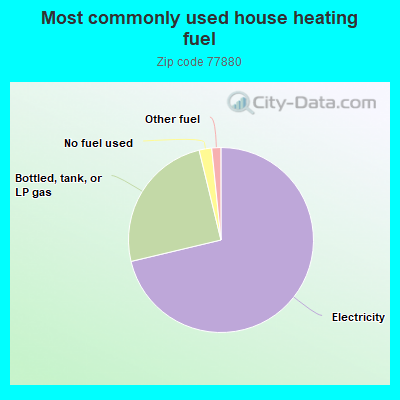
71.5%Electricity
25.0%Bottled, tank, or LP gas
2.2%No fuel used
1.6%Other fuel
Population in 1990: 616. Population change in the 1990s: +797 (+129.4%).
Place of birth for U.S.-born residents:
This state: 1,526
Northeast: 49
Midwest: 181
South: 231
West: 96
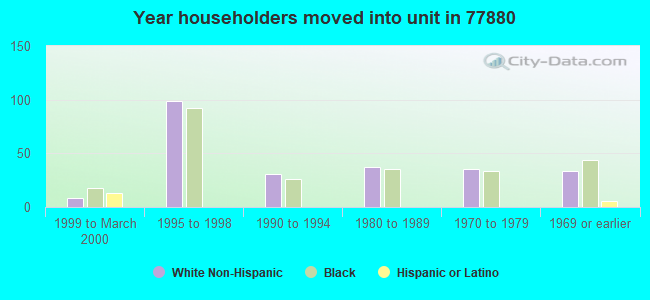
69% of the 77880 zip code residents lived in the same house 5 years ago. Out of people who lived in different houses, 71% lived in this county. Out of people who lived in different counties, 50% lived in Texas.
100% of the 77880 zip code residents lived in the same house 1 year ago. Out of people who lived in different houses, 300% moved from this county.
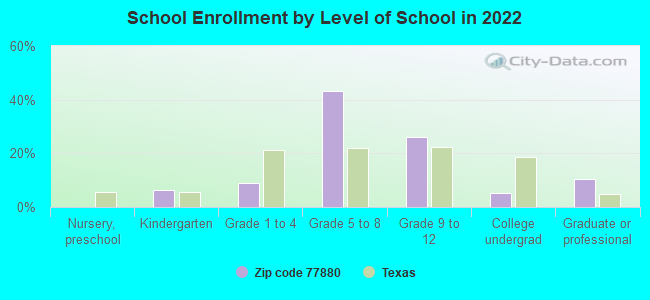
Private vs. public school enrollment:
Students in private schools in grades 1 to 8 (elementary and middle school): 91
Here:
65.4%
Texas:
8.8%
Students in private schools in grades 9 to 12 (high school): 17
Here:
25.3%
Texas:
8.0%
Students in private undergraduate colleges:
Here:
0.0%
Texas:
16.2%
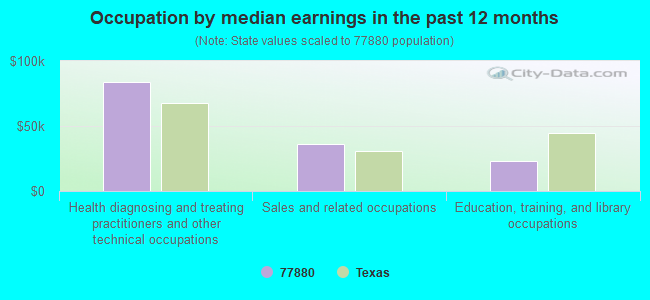
Occupation by median earnings in the past 12 months ($)
84,068Health diagnosing and treating practitioners and other technical occupations
35,964Sales and related occupations
22,902Education, training, and library occupations
Top industries in this zip code by the number of employees in 2005:
Construction: Poured Concrete Foundation and Structure Contractors (20-49 employees: 1 establishment, 10-19 employees: 1 establishment)
Real Estate and Rental and Leasing: Residential Property Managers (10-19: 1)
Construction: Electrical Contractors (5-9: 1)
Other Services (except Public Administration): Religious Organizations (5-9: 1)
Accommodation and Food Services: Recreational and Vacation Camps (except Campgrounds) (1-4: 1)
Construction: Land Subdivision (1-4: 1)
Administrative and Support and Waste Management and Remediation Services: Landscaping Services (1-4: 1)
Fatal accident statistics in 2014:
Fatal accident count: 3
Vehicles involved in fatal accidents: 4
Fatal accidents caused by drunken drivers: 1
Fatalities: 3
Persons involved in fatal accidents: 8
Pedestrians involved in fatal accidents: 0
Fatal accident statistics in 2013:
Fatal accident count: 2
Vehicles involved in fatal accidents: 2
Fatal accidents caused by drunken drivers: 0
Fatalities: 2
Persons involved in fatal accidents: 2
Pedestrians involved in fatal accidents: 1
2003 - 2018 National Fire Incident Reporting System (NFIRS) incidents
Based on the data from the years 2003 - 2018 the average number of fires per year is 17. The highest number of fire incidents - 38 took place in 2005, and the least - 1 in 2007. The data has a dropping trend.
When looking into fire subcategories, the most incidents belonged to: Outside Fires (72.4%), and Structure Fires (16.2%).
Fire incident types reported to NFIRS in Zip Code 77880
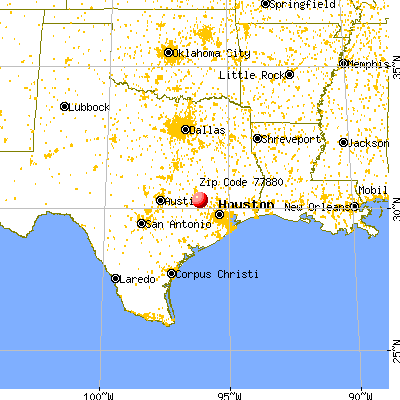


 Nearest zip codes: 77868, 77426, 77445, 77833, 77446, 77845.
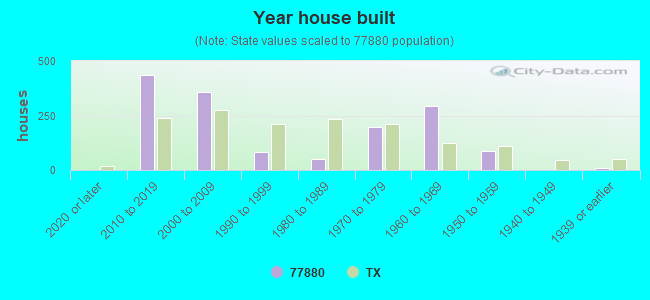


 Based on the data from the years 2003 - 2018 the average number of fires per year is 17. The highest number of fire incidents - 38 took place in 2005, and the least - 1 in 2007. The data has a dropping trend.
 When looking into fire subcategories, the most incidents belonged to: Outside Fires (72.4%), and Structure Fires (16.2%).