Estimated zip code population in 2022: 5,387 Zip code population in 2010: 5,459 Zip code population in 2000: 5,406
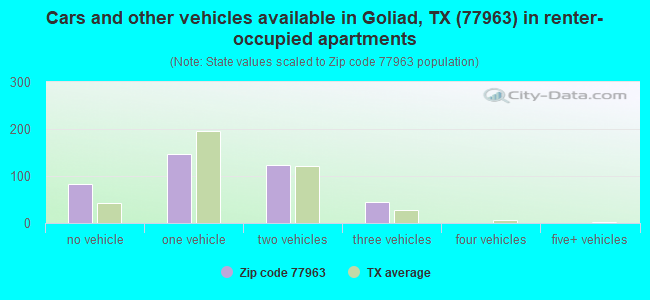
Houses and condos: 2,674 Renter-occupied apartments: 397
% of renters here:
19%
State:
38%
March 2022 cost of living index in zip code 77963: 79.6 (low, U.S. average is 100)
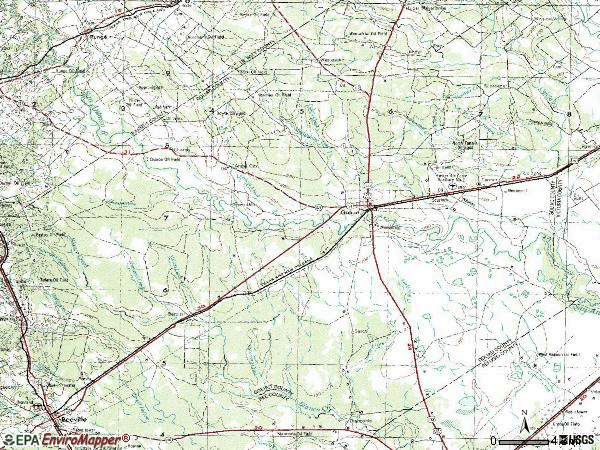
Land area: 647.4 sq. mi. Water area: 3.5 sq. mi.
Population density: 8 people per square mile
(very low).
OSM Map
General Map
Google Map
MSN Map
OSM Map
General Map
Google Map
MSN Map
OSM Map
General Map
Google Map
MSN Map
OSM Map
General Map
Google Map
MSN Map
Please wait while loading the map...
Real estate property taxes paid for housing units in 2022:
This zip code:
0.9% ($1,749)
Texas:
1.5% ($4,050)
Median real estate property taxes paid for housing units with mortgages in 2022: $2,049 (1.0%) Median real estate property taxes paid for housing units with no mortgage in 2022: $1,700 (0.8%)
Averages for the 2020 tax year for zip code 77963, filed in 2021:
Average Adjusted Gross Income (AGI) in 2020: $60,811 (Individual Income Tax Returns)
Here:
$60,811
State:
$77,054
Salary/wage: $52,841 (reported on 79.3% of returns)
Here:
$52,841
State:
$62,766
(% of AGI for various income ranges: 1256.7% for AGIs below $25k, 3433.9% for AGIs $25k-50k, 6534.6% for AGIs $50k-75k, 9783.3% for AGIs $75k-100k, 16675.5% for AGIs $100k-200k, 44066.7% for AGIs over 200k)
Taxable interest for individuals: $1,383 (reported on 33.7% of returns)
This zip code:
$1,383
Texas:
$2,665
(% of AGI for various income ranges: 25.1% for AGIs below $25k, 25.9% for AGIs $25k-50k, 51.7% for AGIs $50k-75k, 47.3% for AGIs $75k-100k, 221.4% for AGIs $100k-200k, 663.3% for AGIs over 200k)
Ordinary dividends: $6,172 (reported on 19.1% of returns)
Here:
$6,172
State:
$10,044
(% of AGI for various income ranges: 21.0% for AGIs below $25k, 53.9% for AGIs $25k-50k, 210.8% for AGIs $50k-75k, 190.0% for AGIs $75k-100k, 443.2% for AGIs $100k-200k, 2566.7% for AGIs over 200k)
Net capital gain/loss in AGI: +$15,649 (reported on 18.3% of returns)
Here:
+$15,649
State:
+$39,590
(% of AGI for various income ranges: 10.5% for AGIs below $25k, 58.2% for AGIs $25k-50k, 190.0% for AGIs $50k-75k, 253.3% for AGIs $75k-100k, 989.5% for AGIs $100k-200k, 12363.3% for AGIs over 200k)
Profit/loss from business: +$9,082 (reported on 22.4% of returns)
Here:
+$9,082
State:
+$10,888
(% of AGI for various income ranges: 186.4% for AGIs below $25k, 71.8% for AGIs $25k-50k, 52.9% for AGIs $50k-75k, 220.0% for AGIs $75k-100k, 915.9% for AGIs $100k-200k, 3566.7% for AGIs over 200k)
Taxable individual retirement arrangement distribution: $17,870 (reported on 9.3% of returns)
77963:
$17,870
Texas:
$24,740
(% of AGI for various income ranges: 63.6% for AGIs below $25k, 124.3% for AGIs $25k-50k, 302.5% for AGIs $50k-75k, 360.7% for AGIs $75k-100k, 867.3% for AGIs $100k-200k)
Total itemized deductions: $36,570 (reported on 4.1% of returns)
Here:
$36,570
State:
$40,428
(% of AGI for various income ranges: 627.9% for AGIs $50k-75k, 977.3% for AGIs $100k-200k)
Charity contributions: $9,414 (reported on 2.8% of returns)
Here:
$9,414
State:
$18,201
(% of AGI for various income ranges: 61.3% for AGIs $50k-75k, 232.7% for AGIs $100k-200k)
Taxes paid: $5,967 (reported on 3.7% of returns)
77963:
$5,967
State:
$7,821
(% of AGI for various income ranges: 90.0% for AGIs $50k-75k, 145.9% for AGIs $100k-200k)
Earned income credit: $2,627 (reported on 19.9% of returns)
Here:
$2,627
State:
$2,584
(% of AGI for various income ranges: 150.5% for AGIs below $25k, 83.9% for AGIs $25k-50k)
Percentage of individuals using paid preparers for their 2020 taxes: 93.1%
Here:
93%
State:
92%
(% for various income ranges: 90.8% for AGIs below $25k, 94.7% for AGIs $25k-50k, 94.1% for AGIs $50k-75k, 95.5% for AGIs $75k-100k, 91.9% for AGIs $100k-200k, 100.0% for AGIs over 200k)
Averages for the 2012 tax year for zip code 77963, filed in 2013:
Average Adjusted Gross Income (AGI) in 2012: $60,866 (Individual Income Tax Returns)
Here:
$60,866
State:
$65,384
Salary/wage: $46,732 (reported on 80.5% of returns)
Here:
$46,732
State:
$52,524
(% of AGI for various income ranges: 75.3% for AGIs below $25k, 73.6% for AGIs $25k-50k, 74.6% for AGIs $50k-75k, 75.6% for AGIs $75k-100k, 74.0% for AGIs $100k-200k, 21.8% for AGIs over 200k)
Taxable interest for individuals: $1,165 (reported on 33.9% of returns)
This zip code:
$1,165
Texas:
$2,372
(% of AGI for various income ranges: 1.1% for AGIs below $25k, 0.7% for AGIs $25k-50k, 0.6% for AGIs $50k-75k, 0.6% for AGIs $75k-100k, 0.8% for AGIs $100k-200k, 0.4% for AGIs over 200k)
Ordinary dividends: $5,079 (reported on 17.8% of returns)
Here:
$5,079
State:
$9,721
(% of AGI for various income ranges: 2.0% for AGIs below $25k, 1.1% for AGIs $25k-50k, 1.4% for AGIs $50k-75k, 1.2% for AGIs $75k-100k, 1.0% for AGIs $100k-200k, 2.2% for AGIs over 200k)
Net capital gain/loss in AGI: +$17,426 (reported on 16.1% of returns)
Here:
+$17,426
State:
+$35,319
(% of AGI for various income ranges: 0.5% for AGIs $25k-50k, 1.7% for AGIs $50k-75k, 1.7% for AGIs $75k-100k, 2.5% for AGIs $100k-200k, 14.1% for AGIs over 200k)
Profit/loss from business: +$17,530 (reported on 18.6% of returns)
Here:
+$17,530
State:
+$13,732
(% of AGI for various income ranges: 8.4% for AGIs below $25k, 3.8% for AGIs $25k-50k, 5.2% for AGIs $50k-75k, 4.7% for AGIs $75k-100k, 10.8% for AGIs $100k-200k)
Taxable individual retirement arrangement distribution: $11,477 (reported on 9.3% of returns)
77963:
$11,477
Texas:
$19,511
(% of AGI for various income ranges: 2.6% for AGIs below $25k, 2.2% for AGIs $25k-50k, 2.8% for AGIs $50k-75k, 1.8% for AGIs $75k-100k, 2.3% for AGIs $100k-200k)
Total itemized deductions: $21,276 (18% of AGI, reported on 15.7% of returns)
Here:
$21,276
State:
$24,724
Here:
18.1% of AGI
State:
15.9% of AGI
(% of AGI for various income ranges: 7.6% for AGIs below $25k, 6.6% for AGIs $25k-50k, 6.3% for AGIs $50k-75k, 5.5% for AGIs $75k-100k, 6.0% for AGIs $100k-200k, 3.2% for AGIs over 200k)
Charity contributions: $5,559 (reported on 11.4% of returns)
Here:
$5,559
State:
$6,808
(% of AGI for various income ranges: 0.7% for AGIs below $25k, 0.8% for AGIs $25k-50k, 0.6% for AGIs $50k-75k, 0.9% for AGIs $75k-100k, 1.2% for AGIs $100k-200k, 1.4% for AGIs over 200k)
Taxes paid: $3,484 (reported on 15.7% of returns)
77963:
$3,484
State:
$6,921
(% of AGI for various income ranges: 0.7% for AGIs below $25k, 0.9% for AGIs $25k-50k, 0.8% for AGIs $50k-75k, 0.9% for AGIs $75k-100k, 1.3% for AGIs $100k-200k, 0.6% for AGIs over 200k)
Earned income credit: $2,447 (reported on 19.9% of returns)
Here:
$2,447
State:
$2,570
(% of AGI for various income ranges: 8.0% for AGIs below $25k, 1.1% for AGIs $25k-50k)
Percentage of individuals using paid preparers for their 2012 taxes: 58.9%
Here:
59%
State:
51%
(% for various income ranges: 50.5% for AGIs below $25k, 54.9% for AGIs $25k-50k, 62.5% for AGIs $50k-75k, 72.0% for AGIs $75k-100k, 71.4% for AGIs $100k-200k, 100.0% for AGIs over 200k)
Averages for the 2004 tax year for zip code 77963, filed in 2005:
Average Adjusted Gross Income (AGI) in 2004: $41,504 (Individual Income Tax Returns)
Here:
$41,504
State:
$47,881
Salary/wage: $32,372 (reported on 80.0% of returns)
Here:
$32,372
State:
$41,947
(% of AGI for various income ranges: 139.3% for AGIs below $10k, 81.9% for AGIs $10k-25k, 74.1% for AGIs $25k-50k, 76.5% for AGIs $50k-75k, 70.5% for AGIs $75k-100k, 31.8% for AGIs over 100k)
Taxable interest for individuals: $1,649 (reported on 43.8% of returns)
This zip code:
$1,649
Texas:
$2,255
(% of AGI for various income ranges: 8.8% for AGIs below $10k, 1.6% for AGIs $10k-25k, 1.8% for AGIs $25k-50k, 1.4% for AGIs $50k-75k, 1.6% for AGIs $75k-100k, 1.7% for AGIs over 100k)
Taxable dividends: $3,297 (reported on 19.5% of returns)
Here:
$3,297
State:
$4,261
(% of AGI for various income ranges: 4.7% for AGIs below $10k, 0.7% for AGIs $10k-25k, 1.2% for AGIs $25k-50k, 0.8% for AGIs $50k-75k, 2.2% for AGIs $75k-100k, 2.1% for AGIs over 100k)
Net capital gain/loss: +$8,453 (reported on 17.9% of returns)
Here:
+$8,453
State:
+$16,110
(% of AGI for various income ranges: 4.6% for AGIs below $10k, 1.2% for AGIs $10k-25k, 0.7% for AGIs $25k-50k, 1.7% for AGIs $50k-75k, 2.5% for AGIs $75k-100k, 8.1% for AGIs over 100k)
Profit/loss from business: +$10,938 (reported on 19.2% of returns)
Here:
+$10,938
State:
+$11,013
(% of AGI for various income ranges: 7.9% for AGIs below $10k, 6.1% for AGIs $10k-25k, 4.2% for AGIs $25k-50k, 4.4% for AGIs $50k-75k, 3.4% for AGIs $75k-100k, 6.5% for AGIs over 100k)
IRA payment deduction: $2,662 (reported on 3.1% of returns)
77963:
$2,662
Texas:
$3,120
(% of AGI for various income ranges: 0.3% for AGIs $10k-25k, 0.3% for AGIs $25k-50k, 0.3% for AGIs $50k-75k, 0.3% for AGIs $75k-100k)
Total itemized deductions: $16,047 (19% of AGI, reported on 13.2% of returns)
Here:
$16,047
State:
$19,631
Here:
19.1% of AGI
State:
18.9% of AGI
(% of AGI for various income ranges: 8.1% for AGIs below $10k, 5.6% for AGIs $10k-25k, 4.8% for AGIs $25k-50k, 4.5% for AGIs $50k-75k, 5.3% for AGIs $75k-100k, 5.2% for AGIs over 100k)
Charity contributions deductions: $3,871 (4% of AGI, reported on 10.2% of returns)
Here:
$3,871
State:
$4,753
Here:
4.0% of AGI
State:
4.2% of AGI
(% of AGI for various income ranges: 0.5% for AGIs $10k-25k, 0.8% for AGIs $25k-50k, 0.7% for AGIs $50k-75k, 1.0% for AGIs $75k-100k, 1.4% for AGIs over 100k)
Total tax: $7,274 (reported on 70.0% of returns)
77963:
$7,274
State:
$9,058
(% of AGI for various income ranges: 6.1% for AGIs below $10k, 3.5% for AGIs $10k-25k, 6.7% for AGIs $25k-50k, 8.8% for AGIs $50k-75k, 11.5% for AGIs $75k-100k, 21.7% for AGIs over 100k)
Earned income credit: $1,915 (reported on 22.3% of returns)
Here:
$1,915
State:
$2,024
Percentage of individuals using paid preparers for their 2004 taxes: 66.3%
Here:
66%
State:
57%
(% for various income ranges: 62.9% for AGIs below $10k, 65.7% for AGIs $10k-25k, 63.0% for AGIs $25k-50k, 65.7% for AGIs $50k-75k, 73.9% for AGIs $75k-100k, 83.3% for AGIs over 100k)
Household received Food Stamps/SNAP in the past 12 months: 246 Household did not receive Food Stamps/SNAP in the past 12 months: 1,792
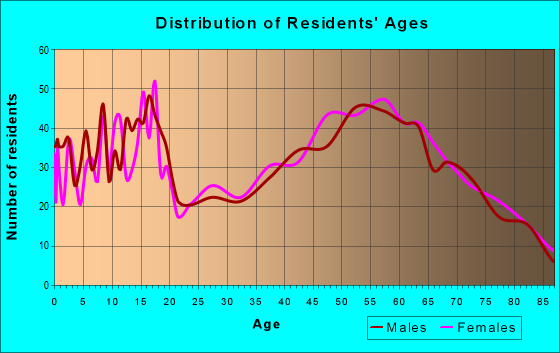
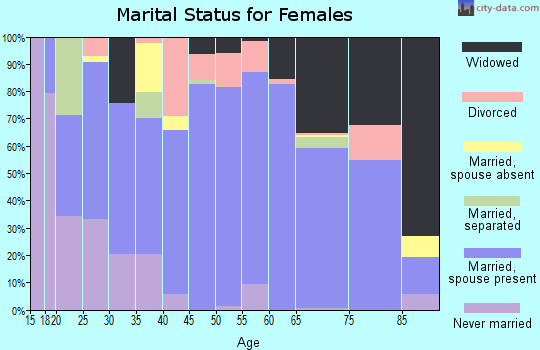
Women who had a birth in the past 12 months: 41 (42 now married, 0 unmarried) Women who did not have a birth in the past 12 months: 1,062 (472 now married, 589 unmarried)
Housing units in zip code 77963 with a mortgage: 498 (8 second mortgage, 9 both second mortgage and home equity loan) Median monthly owner costs for units with a mortgage: $1,273 Median monthly owner costs for units without a mortgage: $499
Residents with income below the poverty level in 2022:
This zip code:
11.2%
Whole state:
14.0%
Residents with income below 50% of the poverty level in 2022:
This zip code:
6.4%
Whole state:
7.4%
Median number of rooms in houses and condos:
Here:
5.8
State:
6.3
Median number of rooms in apartments:
Here:
4.8
State:
4.0
Notable locations in this zip code not listed on our city pages
Notable locations in zip code 77963: Clip Ranch (A), Coyote Windmill (B), Dial Ranch (C), Dutch Trap Windmill (D), Elkins Windmill (E), Farley Windmill (F), Gin Windmill (G), Henke Windmill (H), Irby Ranch (I), Lake Windmill (J), Little Sarco Windmill (K), Lott Windmill (L), Lower Buzzard Windmill (M), Matt Windmill (N), Melo Ranch (O), Mission Nuestra Senora del Rosario (P), Mulley Windmill (Q), Number One Windmill (R), Number Two Windmill (S), Number Three Windmill (T). Display/hide their locations on the map
Churches in zip code 77963 include: Mount Moriah Baptist Church (A), Saint Andrews Church (B), Zion Hill Church (C), Saint Lukes Church (D), Minnehulla Church (E), Mission Espiritu Santo (F). Display/hide their locations on the map
Cemeteries: Lott Pettus Cemetery (1), Lott Cemetery (2), Killebrew Cemetery (3), John Pettus Cemetery (4), Mistletoe Cemetery (5), San Antonio Cemetery (6), Wisbey Cemetery (7). Display/hide their locations on the map
Lakes and reservoirs: Gibson Lake (A), Redding Lake (B), Milinda Lake (C), Hardaman Lake (D), Horseshoe Lake (E), Flat Lake (F), Fulcrod Lake (G), Live Oak Lake (H). Display/hide their locations on the map
Streams, rivers, and creeks: Blue Branch (A), Alligator Creek (B), Murphy Creek (C), Manahuilla Creek (D), Cabeza Creek (E), Sarco Creek (F), Salt Creek (G), Road Creek (H), Chicken Creek (I). Display/hide their locations on the map
In group quarters: 110 (-1 institutionalized population)
Size of family households: 565 2-persons, 269 3-persons, 278 4-persons, 171 5-persons, 9 7-or-more-persons
Size of nonfamily households: 700 1-person, 47 2-persons
966 married couples with children.
172 single-parent households (42 men, 130 women).
80.4% of residents of 77963 zip code speak English at home.
19.4% of residents speak Spanish at home (69% very well, 16% well, 10% not well, 5% not at all).
0.4% of residents speak other Indo-European language at home (100% very well).
0.2% of residents speak Asian or Pacific Island language at home (33% very well, 67% well).
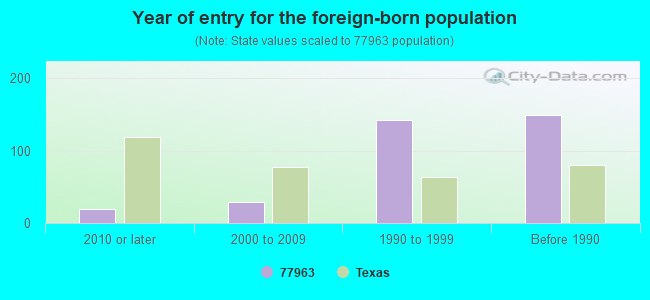
Foreign born population: 335 (6.2%) (31.2% of them are naturalized citizens)
This zip code:
6.2%
Whole state:
17.2%
90%Honduras
1%Costa Rica
1%United Kingdom, excluding England and Scotland
1%Hong Kong
0%Sweden
0%Thailand
0%Guatemala
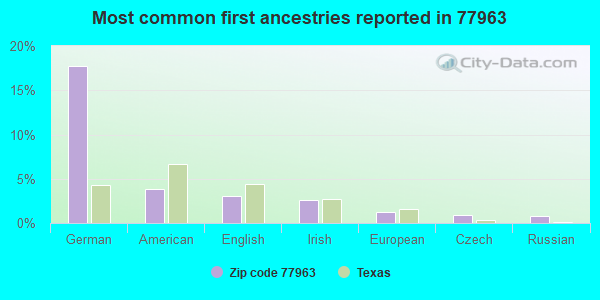
18%German
4%American
3%English
3%Irish
1%European
1%Czech
1%Russian
Year of entry for the foreign-born population
192010 or later
292000 to 2009
1421990 to 1999
149Before 1990
Housing units lacking complete plumbing facilities: 4.7% Housing units lacking complete kitchen facilities: 6.9%
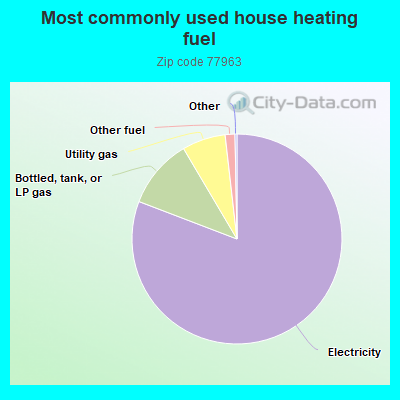
80.9%Electricity
10.7%Bottled, tank, or LP gas
6.7%Utility gas
1.5%Other fuel
Population in 1990: 5,980.
Place of birth for U.S.-born residents:
This state: 4,650
Northeast: 14
Midwest: 76
South: 128
West: 95
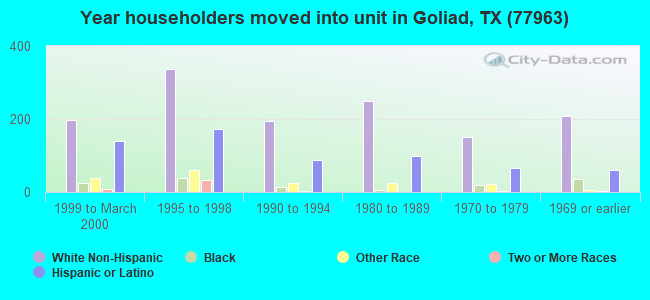
61% of the 77963 zip code residents lived in the same house 5 years ago. Out of people who lived in different houses, 40% lived in this county. Out of people who lived in different counties, 50% lived in Texas.
97% of the 77963 zip code residents lived in the same house 1 year ago. Out of people who lived in different houses, 25% moved from this county. Out of people who lived in different houses, 87% moved from different county within same state.
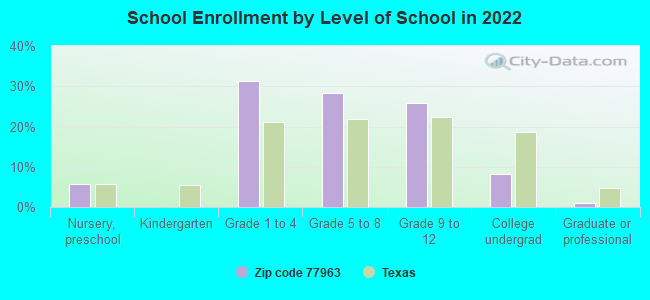
Private vs. public school enrollment:
Students in private schools in grades 1 to 8 (elementary and middle school): 81
Here:
12.3%
Texas:
8.8%
Students in private schools in grades 9 to 12 (high school): 8
Here:
3.0%
Texas:
8.0%
Students in private undergraduate colleges: 12
Here:
13.9%
Texas:
16.2%
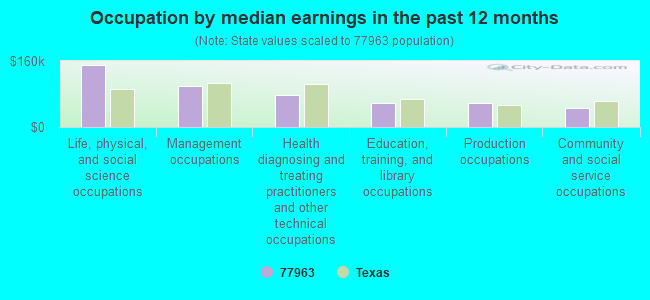
Occupation by median earnings in the past 12 months ($)
150,707Life, physical, and social science occupations
98,666Management occupations
77,232Health diagnosing and treating practitioners and other technical occupations
57,117Education, training, and library occupations
57,067Production occupations
46,977Community and social service occupations
Companies with federal contracts located in this zip code:
GRITZ TOWERS INC (3375 POST OAK RD in GOLIAD, TX; small business) : $25,539 in 5 contractsfrom 2004 to 2005
Contracts for Construction of Structures and Facilities -- Other Utilities, Other Utilities by U.S. Army Corps of Engineers - civil program financing only, Army Signed by year:2000: $0; 2001: $0; 2002: $0; 2003: $0; 2004: $9,058; 2005: $16,481; 2006: $0.
Biggest contracts:
$7,778 with U.S. Army Corps of Engineers - civil program financing only for Construction of Structures and Facilities -- Other Utilities. Signed on 2005-08-29. Completion date: 2005-09-01.
$7,778 with Army for Construction of Structures and Facilities -- Other Utilities. Signed on 2005-08-29. Completion date: 2005-09-01.
$4,529 with Army for Other Utilities. Signed on 2004-08-03. Completion date: 2004-08-19.
$4,529 with U.S. Army Corps of Engineers - civil program financing only for Other Utilities. Signed on 2004-08-03. Completion date: 2004-08-19.
Top industries in this zip code by the number of employees in 2005:
Health Care and Social Assistance: Nursing Care Facilities (50-99 employees: 1 establishment, 10-19 employees: 1 establishment)
Accommodation and Food Services: Full-Service Restaurants (10-19: 2, 5-9: 3)
Accommodation and Food Services: Limited-Service Restaurants (20-49: 1, 10-19: 1)
Finance and Insurance: Commercial Banking (20-49: 1, 1-4: 1)
Other Services (except Public Administration): Religious Organizations (10-19: 1, 1-4: 6)
People in group quarters in 2010:
49 people in nursing facilities/skilled-nursing facilities
30 people in local jails and other municipal confinement facilities
9 people in group homes for juveniles (non-correctional)
5 people in workers' group living quarters and job corps centers
People in group quarters in 2000:
71 people in nursing homes
18 people in local jails and other confinement facilities (including police lockups)
14 people in other noninstitutional group quarters
12 people in federal prisons and detention centers
8 people in state prisons
Fatal accident statistics in 2013:
Fatal accident count: 1
Vehicles involved in fatal accidents: 2
Fatal accidents caused by drunken drivers: 0
Fatalities: 1
Persons involved in fatal accidents: 2
Pedestrians involved in fatal accidents: 0
Fatal accident statistics in 2012:
Fatal accident count: 2
Vehicles involved in fatal accidents: 2
Fatal accidents caused by drunken drivers: 2
Fatalities: 2
Persons involved in fatal accidents: 3
Pedestrians involved in fatal accidents: 0
2002 - 2017 National Fire Incident Reporting System (NFIRS) incidents
Based on the data from the years 2002 - 2017 the average number of fire incidents per year is 6. The highest number of fire incidents - 38 took place in 2003, and the least - 0 in 2006. The data has a decreasing trend.
When looking into fire subcategories, the most incidents belonged to: Outside Fires (73.1%), and Mobile Property/Vehicle Fires (9.6%).
Fire incident types reported to NFIRS in Zip Code 77963
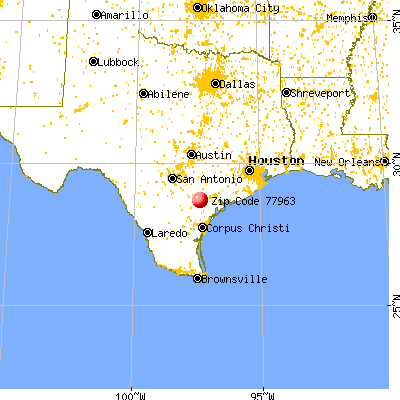


 Nearest zip codes: 78107, 77993, 77960, 77974, 78141, 78164.


 : $25,539 in 5 contracts from 2004 to 2005

 Based on the data from the years 2002 - 2017 the average number of fire incidents per year is 6. The highest number of fire incidents - 38 took place in 2003, and the least - 0 in 2006. The data has a decreasing trend.
 When looking into fire subcategories, the most incidents belonged to: Outside Fires (73.1%), and Mobile Property/Vehicle Fires (9.6%).