Estimated zip code population in 2022: 7,315 Zip code population in 2010: 5,137 Zip code population in 2000: 4,767
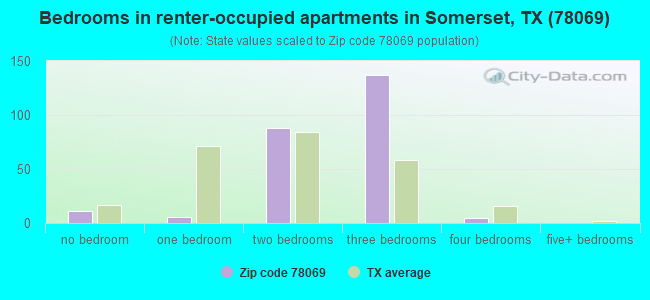
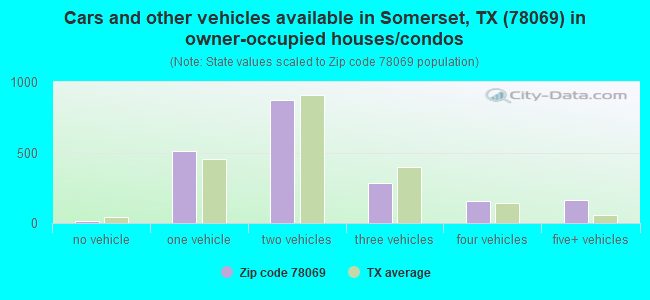
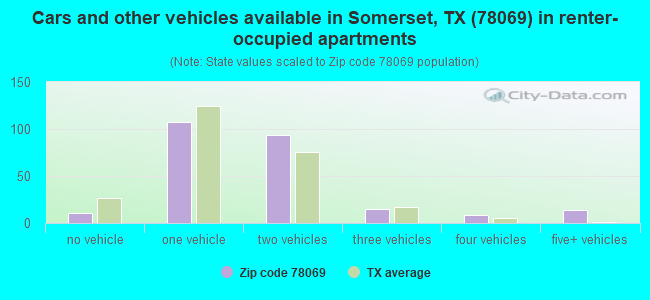
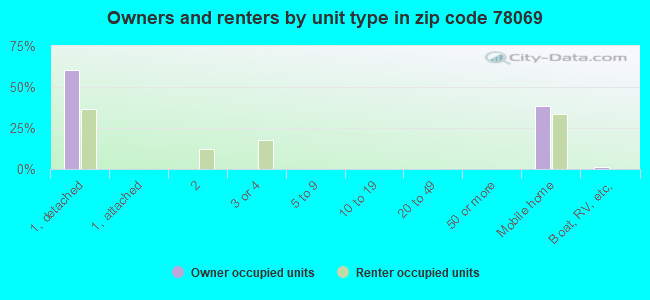
Houses and condos: 2,503 Renter-occupied apartments: 251
% of renters here:
11%
State:
38%
March 2022 cost of living index in zip code 78069: 78.0 (low, U.S. average is 100)
Land area: 32.6 sq. mi. Water area: 0.0 sq. mi.
Population density: 225 people per square mile
(very low).
OSM Map
General Map
Google Map
MSN Map
OSM Map
General Map
Google Map
MSN Map
OSM Map
General Map
Google Map
MSN Map
OSM Map
General Map
Google Map
MSN Map
Please wait while loading the map...
Real estate property taxes paid for housing units in 2022:
This zip code:
1.4% ($1,579)
Texas:
1.5% ($4,050)
Median real estate property taxes paid for housing units with mortgages in 2022: $1,423 (0.7%) Median real estate property taxes paid for housing units with no mortgage in 2022: $1,861 (1.1%)
Business Search- 14 Million verified businesses
Males: 3,689
(50.4%)
Females: 3,626
(49.6%)
For population 25 years and over in 78069:
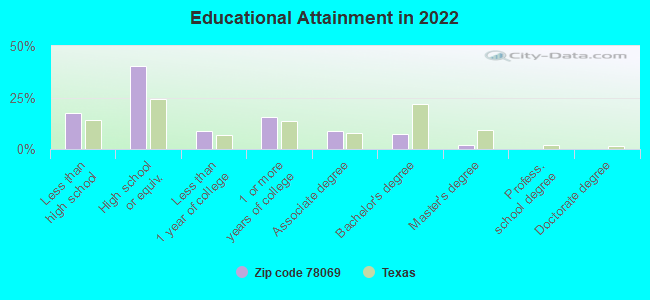
High school or higher: 81.2%
Bachelor's degree or higher: 9.4%
Graduate or professional degree: 1.9%
Unemployed: 3.8%
Mean travel time to work (commute): 34.0 minutes
For population 15 years and over in 78069:
Never married: 35.3%
Now married: 44.6%
Separated: 2.3%
Widowed: 9.8%
Divorced: 8.0%
Zip code 78069 compared to state average:
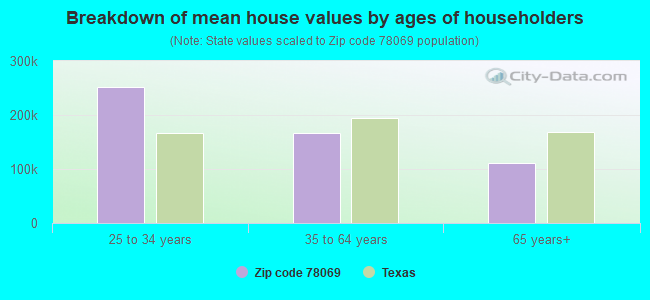
Median house value significantly below state average.
Black race population percentage significantly below state average.
Hispanic race population percentage above state average.
Foreign-born population percentage below state average.
Renting percentage significantly below state average.
Length of stay since moving in significantly above state average.
House age below state average.
Percentage of population with a bachelor's degree or higher significantly below state average.
Averages for the 2020 tax year for zip code 78069, filed in 2021:
Average Adjusted Gross Income (AGI) in 2020: $42,173 (Individual Income Tax Returns)
Here:
$42,173
State:
$77,054
Salary/wage: $40,553 (reported on 82.7% of returns)
Here:
$40,553
State:
$62,766
(% of AGI for various income ranges: 1102.9% for AGIs below $25k, 3552.8% for AGIs $25k-50k, 6174.1% for AGIs $50k-75k, 8849.3% for AGIs $75k-100k, 15495.7% for AGIs $100k-200k)
Taxable interest for individuals: $627 (reported on 11.5% of returns)
This zip code:
$627
Texas:
$2,665
(% of AGI for various income ranges: 5.4% for AGIs below $25k, 5.2% for AGIs $25k-50k, 2.4% for AGIs $50k-75k, 18.6% for AGIs $75k-100k, 53.6% for AGIs $100k-200k)
Ordinary dividends: $1,162 (reported on 3.1% of returns)
Here:
$1,162
State:
$10,044
(% of AGI for various income ranges: 2.8% for AGIs below $25k, 2.6% for AGIs $50k-75k, 42.9% for AGIs $100k-200k)
Net capital gain/loss in AGI: +$18,711 (reported on 3.5% of returns)
Here:
+$18,711
State:
+$39,590
(% of AGI for various income ranges: 7.6% for AGIs below $25k, 33.2% for AGIs $50k-75k, 1075.7% for AGIs $100k-200k)
Profit/loss from business: +$6,083 (reported on 18.5% of returns)
Here:
+$6,083
State:
+$10,888
(% of AGI for various income ranges: 219.6% for AGIs below $25k, 143.3% for AGIs $25k-50k, 22.6% for AGIs $50k-75k, 107.1% for AGIs $75k-100k)
Taxable individual retirement arrangement distribution: $14,086 (reported on 2.7% of returns)
78069:
$14,086
Texas:
$24,740
(% of AGI for various income ranges: 14.4% for AGIs below $25k, 51.2% for AGIs $25k-50k, 382.9% for AGIs $75k-100k)
Total itemized deductions: $27,983 (reported on 2.3% of returns)
Here:
$27,983
State:
$40,428
(% of AGI for various income ranges: 128.0% for AGIs $25k-50k, 614.3% for AGIs $75k-100k)
Charity contributions: $4,975 (reported on 1.5% of returns)
Here:
$4,975
State:
$18,201
(% of AGI for various income ranges: 58.5% for AGIs $50k-75k)
Taxes paid: $6,117 (reported on 2.3% of returns)
78069:
$6,117
State:
$7,821
(% of AGI for various income ranges: 27.0% for AGIs $25k-50k, 138.6% for AGIs $75k-100k)
Earned income credit: $2,813 (reported on 28.8% of returns)
Here:
$2,813
State:
$2,584
(% of AGI for various income ranges: 159.6% for AGIs below $25k, 117.7% for AGIs $25k-50k)
Percentage of individuals using paid preparers for their 2020 taxes: 91.9%
Here:
92%
State:
92%
(% for various income ranges: 90.4% for AGIs below $25k, 93.5% for AGIs $25k-50k, 92.7% for AGIs $50k-75k, 88.9% for AGIs $75k-100k, 105.6% for AGIs $100k-200k, 0.0% for AGIs over 200k)
Averages for the 2012 tax year for zip code 78069, filed in 2013:
Average Adjusted Gross Income (AGI) in 2012: $35,594 (Individual Income Tax Returns)
Here:
$35,594
State:
$65,384
Salary/wage: $34,095 (reported on 86.8% of returns)
Here:
$34,095
State:
$52,524
(% of AGI for various income ranges: 76.9% for AGIs below $25k, 85.7% for AGIs $25k-50k, 83.8% for AGIs $50k-75k, 86.4% for AGIs $75k-100k, 82.1% for AGIs $100k-200k)
Taxable interest for individuals: $582 (reported on 13.2% of returns)
This zip code:
$582
Texas:
$2,372
(% of AGI for various income ranges: 0.3% for AGIs below $25k, 0.3% for AGIs $50k-75k, 0.2% for AGIs $75k-100k, 0.2% for AGIs $100k-200k)
Ordinary dividends: $944 (reported on 4.2% of returns)
Here:
$944
State:
$9,721
Net capital gain/loss in AGI: +$760 (reported on 2.4% of returns)
Here:
+$760
State:
+$35,319
Profit/loss from business: +$8,043 (reported on 17.5% of returns)
Here:
+$8,043
State:
+$13,732
(% of AGI for various income ranges: 13.1% for AGIs below $25k, 2.6% for AGIs $25k-50k, 2.9% for AGIs $50k-75k, 1.7% for AGIs $75k-100k)
Taxable individual retirement arrangement distribution: $9,483 (reported on 2.8% of returns)
78069:
$9,483
Texas:
$19,511
(% of AGI for various income ranges: 1.2% for AGIs below $25k, 1.2% for AGIs $25k-50k, 1.0% for AGIs $50k-75k)
Total itemized deductions: $19,168 (26% of AGI, reported on 10.4% of returns)
Here:
$19,168
State:
$24,724
Here:
26.0% of AGI
State:
15.9% of AGI
(% of AGI for various income ranges: 2.5% for AGIs below $25k, 5.2% for AGIs $25k-50k, 4.8% for AGIs $50k-75k, 8.5% for AGIs $75k-100k, 8.0% for AGIs $100k-200k)
Charity contributions: $4,379 (reported on 6.6% of returns)
Here:
$4,379
State:
$6,808
(% of AGI for various income ranges: 0.6% for AGIs $25k-50k, 0.5% for AGIs $50k-75k, 1.3% for AGIs $75k-100k, 1.9% for AGIs $100k-200k)
Taxes paid: $4,784 (reported on 9.0% of returns)
78069:
$4,784
State:
$6,921
(% of AGI for various income ranges: 0.7% for AGIs below $25k, 1.1% for AGIs $25k-50k, 0.9% for AGIs $50k-75k, 1.7% for AGIs $75k-100k, 1.8% for AGIs $100k-200k)
Earned income credit: $2,784 (reported on 35.8% of returns)
Here:
$2,784
State:
$2,570
(% of AGI for various income ranges: 12.2% for AGIs below $25k, 2.3% for AGIs $25k-50k)
Percentage of individuals using paid preparers for their 2012 taxes: 52.4%
Here:
52%
State:
51%
(% for various income ranges: 50.0% for AGIs below $25k, 52.6% for AGIs $25k-50k, 53.6% for AGIs $50k-75k, 58.3% for AGIs $75k-100k, 66.7% for AGIs $100k-200k)
Averages for the 2004 tax year for zip code 78069, filed in 2005:
Average Adjusted Gross Income (AGI) in 2004: $28,986 (Individual Income Tax Returns)
Here:
$28,986
State:
$47,881
Salary/wage: $28,184 (reported on 85.3% of returns)
Here:
$28,184
State:
$41,947
(% of AGI for various income ranges: 87.8% for AGIs below $10k, 80.2% for AGIs $10k-25k, 85.0% for AGIs $25k-50k, 82.3% for AGIs $50k-75k, 87.0% for AGIs $75k-100k, 75.5% for AGIs over 100k)
Taxable interest for individuals: $856 (reported on 20.6% of returns)
This zip code:
$856
Texas:
$2,255
(% of AGI for various income ranges: 1.2% for AGIs below $10k, 0.6% for AGIs $10k-25k, 0.8% for AGIs $25k-50k, 0.3% for AGIs $50k-75k, 0.7% for AGIs $75k-100k, 0.4% for AGIs over 100k)
Taxable dividends: $617 (reported on 5.9% of returns)
Here:
$617
State:
$4,261
(% of AGI for various income ranges: 0.1% for AGIs below $10k, 0.0% for AGIs $10k-25k, 0.2% for AGIs $25k-50k, 0.1% for AGIs $50k-75k, 0.2% for AGIs $75k-100k)
Net capital gain/loss: +$2,659 (reported on 4.5% of returns)
Here:
+$2,659
State:
+$16,110
(% of AGI for various income ranges: 0.1% for AGIs $10k-25k, 0.2% for AGIs $25k-50k, 1.3% for AGIs $50k-75k, 0.6% for AGIs $75k-100k)
Profit/loss from business: +$6,922 (reported on 16.0% of returns)
Here:
+$6,922
State:
+$11,013
(% of AGI for various income ranges: 7.3% for AGIs below $10k, 8.1% for AGIs $10k-25k, 3.2% for AGIs $25k-50k, 2.0% for AGIs $50k-75k, 3.2% for AGIs $75k-100k)
IRA payment deduction: $2,786 (reported on 0.8% of returns)
78069:
$2,786
Texas:
$3,120
Total itemized deductions: $13,990 (24% of AGI, reported on 10.5% of returns)
Here:
$13,990
State:
$19,631
Here:
24.3% of AGI
State:
18.9% of AGI
(% of AGI for various income ranges: 2.9% for AGIs $10k-25k, 5.2% for AGIs $25k-50k, 5.2% for AGIs $50k-75k, 8.0% for AGIs $75k-100k, 7.5% for AGIs over 100k)
Charity contributions deductions: $2,423 (4% of AGI, reported on 7.5% of returns)
Here:
$2,423
State:
$4,753
Here:
3.9% of AGI
State:
4.2% of AGI
(% of AGI for various income ranges: 0.2% for AGIs $10k-25k, 0.6% for AGIs $25k-50k, 0.7% for AGIs $50k-75k, 1.0% for AGIs $75k-100k, 1.3% for AGIs over 100k)
Total tax: $3,501 (reported on 62.4% of returns)
78069:
$3,501
State:
$9,058
(% of AGI for various income ranges: 2.9% for AGIs below $10k, 3.5% for AGIs $10k-25k, 5.4% for AGIs $25k-50k, 8.8% for AGIs $50k-75k, 11.0% for AGIs $75k-100k, 19.0% for AGIs over 100k)
Earned income credit: $2,087 (reported on 35.9% of returns)
Here:
$2,087
State:
$2,024
Percentage of individuals using paid preparers for their 2004 taxes: 57.7%
Here:
58%
State:
57%
(% for various income ranges: 51.7% for AGIs below $10k, 62.3% for AGIs $10k-25k, 57.4% for AGIs $25k-50k, 52.7% for AGIs $50k-75k, 60.0% for AGIs $75k-100k, 71.0% for AGIs over 100k)
Household received Food Stamps/SNAP in the past 12 months: 309 Household did not receive Food Stamps/SNAP in the past 12 months: 1,937
Women who had a birth in the past 12 months: 215 (209 now married, 8 unmarried) Women who did not have a birth in the past 12 months: 1,853 (516 now married, 1,346 unmarried)
Housing units in zip code 78069 with a mortgage: 758 (6 second mortgage, 7 both second mortgage and home equity loan) Houses without a mortgage: 89
Median monthly owner costs for units with a mortgage: $1,378 Median monthly owner costs for units without a mortgage: $485
Residents with income below the poverty level in 2022:
This zip code:
12.9%
Whole state:
14.0%
Residents with income below 50% of the poverty level in 2022:
This zip code:
10.3%
Whole state:
7.4%
Median number of rooms in houses and condos:
Here:
5.8
State:
6.3
Median number of rooms in apartments:
Here:
4.4
State:
4.0
Notable locations in this zip code not listed on our city pages
In group quarters: 20 (-1 institutionalized population)
Size of family households: 633 2-persons, 175 3-persons, 334 4-persons, 289 5-persons, 116 6-persons, 96 7-or-more-persons
Size of nonfamily households: 444 1-person, 144 2-persons
854 married couples with children.
289 single-parent households (166 men, 123 women).
40.5% of residents of 78069 zip code speak English at home.
58.8% of residents speak Spanish at home (65% very well, 15% well, 17% not well, 4% not at all).
0.5% of residents speak Asian or Pacific Island language at home (81% very well, 19% well).
Foreign born population: 664 (9.1%) (16.9% of them are naturalized citizens)
This zip code:
9.1%
Whole state:
17.2%
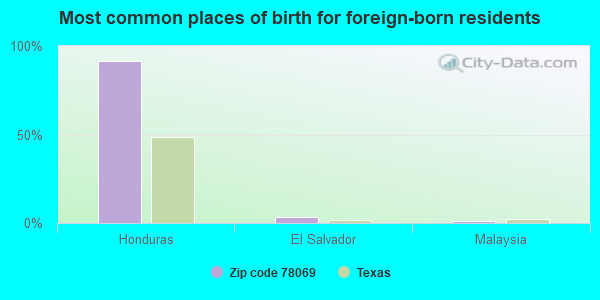
91%Honduras
3%El Salvador
1%Malaysia
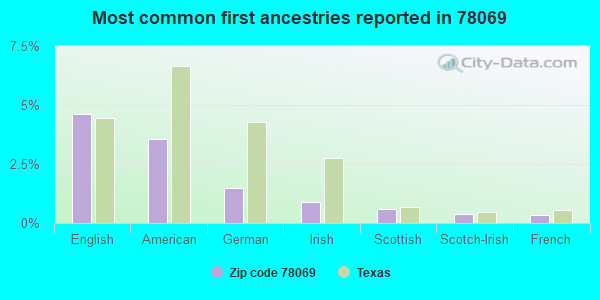
5%English
4%American
1%German
1%Irish
1%Scottish
0%Scotch-Irish
0%French
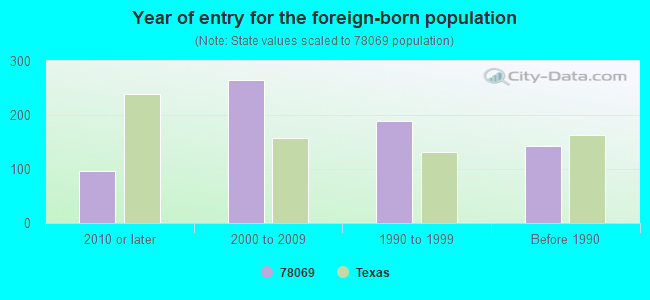
Year of entry for the foreign-born population
962010 or later
2642000 to 2009
1881990 to 1999
142Before 1990
Facilities with environmental interests located in this zip code:
ATASCOSA CO ALTER (19644 SOMERSET RD in SOMERSET, TX)
(National Center for Education Statistics) - STATE ID-015909002 Organizations: SOMERSET ISD (SCHOOL DISTRICT)
Housing units lacking complete plumbing facilities: 5.1% Housing units lacking complete kitchen facilities: 5.5%
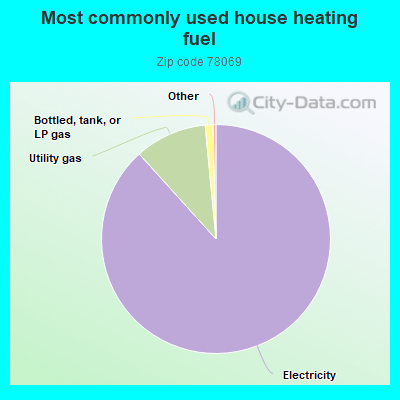
88.4%Electricity
10.2%Utility gas
1.1%Bottled, tank, or LP gas
Population in 1990: 3,477. Population change in the 1990s: +1,290 (+37.1%).
Place of birth for U.S.-born residents:
This state: 5,801
Northeast: 78
Midwest: 198
South: 54
West: 414
61% of the 78069 zip code residents lived in the same house 5 years ago. Out of people who lived in different houses, 38% lived in this county. Out of people who lived in different counties, 50% lived in Texas.
94% of the 78069 zip code residents lived in the same house 1 year ago. Out of people who lived in different houses, 19% moved from this county. Out of people who lived in different houses, 74% moved from different county within same state. Out of people who lived in different houses, 14% moved from different state.
Private vs. public school enrollment:
Students in private schools in grades 1 to 8 (elementary and middle school): 8
Here:
2.2%
Texas:
8.8%
Students in private schools in grades 9 to 12 (high school): 60
Here:
13.0%
Texas:
8.0%
Students in private undergraduate colleges: 10
Here:
3.9%
Texas:
16.2%
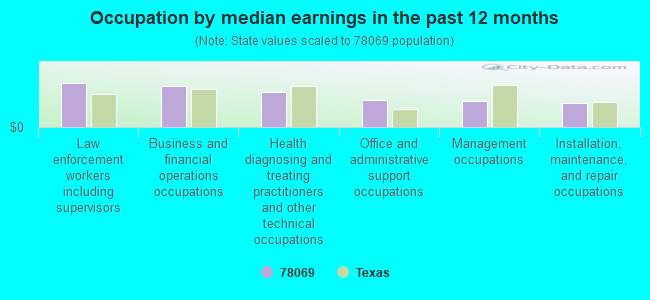
Occupation by median earnings in the past 12 months ($)
102,545Law enforcement workers including supervisors
94,664Business and financial operations occupations
80,823Health diagnosing and treating practitioners and other technical occupations
62,715Office and administrative support occupations
61,032Management occupations
55,944Installation, maintenance, and repair occupations
Top industries in this zip code by the number of employees in 2005:
Finance and Insurance: Commercial Banking (50-99 employees: 1 establishment)
Other Services (except Public Administration): Pet Care (except Veterinary) Services (20-49: 1)
Health Care and Social Assistance: Child Day Care Services (10-19: 1, 1-4: 2)
Accommodation and Food Services: Limited-Service Restaurants (10-19: 1)
Health Care and Social Assistance: Offices of Physicians (except Mental Health Specialists) (10-19: 1)
People in group quarters in 2010:
23 people in workers' group living quarters and job corps centers
Fatal accident statistics in 2014:
Fatal accident count: 2
Vehicles involved in fatal accidents: 3
Fatal accidents caused by drunken drivers: 1
Fatalities: 2
Persons involved in fatal accidents: 4
Pedestrians involved in fatal accidents: 0
Fatal accident statistics in 2011:
Fatal accident count: 2
Vehicles involved in fatal accidents: 2
Fatal accidents caused by drunken drivers: 2
Fatalities: 2
Persons involved in fatal accidents: 2
Pedestrians involved in fatal accidents: 0
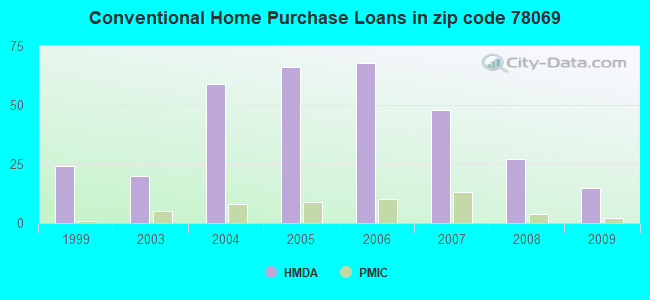
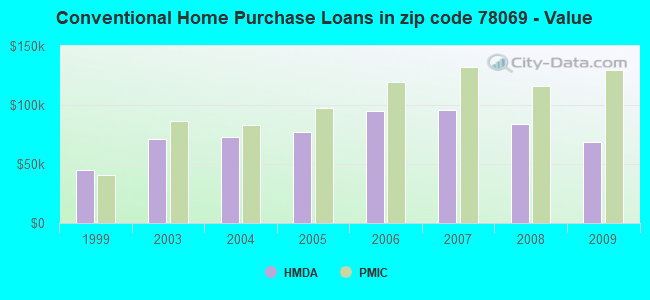
Home Mortgage Disclosure Act Aggregated Statistics For Year 2009 (Based on 6 partial tracts)
A) FHA, FSA/RHS & VA Home Purchase Loans
B) Conventional Home Purchase Loans
C) Refinancings
D) Home Improvement Loans
F) Non-occupant Loans on < 5 Family Dwellings (A B C & D)
G) Loans On Manufactured Home Dwelling (A B C & D)
Number
Average Value
Number
Average Value
Number
Average Value
Number
Average Value
Number
Average Value
Number
Average Value
LOANS ORIGINATED
22
$121,741
15
$68,442
32
$116,167
14
$20,291
6
$72,202
16
$74,273
APPLICATIONS APPROVED, NOT ACCEPTED
1
$107,380
8
$76,469
9
$93,744
2
$13,385
2
$33,930
8
$53,658
APPLICATIONS DENIED
4
$79,962
23
$70,738
42
$119,738
25
$32,727
5
$77,064
23
$57,118
APPLICATIONS WITHDRAWN
2
$212,470
2
$85,970
14
$141,228
1
$44,930
2
$100,515
3
$77,723
FILES CLOSED FOR INCOMPLETENESS
1
$64,920
2
$84,550
4
$80,260
1
$40,550
0
$0
4
$57,295
Aggregated Statistics For Year 2008 (Based on 6 partial tracts)
A) FHA, FSA/RHS & VA Home Purchase Loans
B) Conventional Home Purchase Loans
C) Refinancings
D) Home Improvement Loans
F) Non-occupant Loans on < 5 Family Dwellings (A B C & D)
G) Loans On Manufactured Home Dwelling (A B C & D)
Number
Average Value
Number
Average Value
Number
Average Value
Number
Average Value
Number
Average Value
Number
Average Value
LOANS ORIGINATED
22
$152,003
27
$84,129
30
$115,934
16
$31,823
6
$62,475
24
$76,929
APPLICATIONS APPROVED, NOT ACCEPTED
3
$111,300
8
$73,498
8
$100,626
5
$28,186
1
$63,960
10
$59,672
APPLICATIONS DENIED
4
$92,690
31
$67,443
54
$86,275
46
$31,524
5
$60,722
35
$52,383
APPLICATIONS WITHDRAWN
2
$94,320
5
$106,476
16
$134,889
2
$46,885
3
$77,630
2
$44,795
FILES CLOSED FOR INCOMPLETENESS
0
$0
1
$55,780
5
$75,782
2
$16,980
0
$0
0
$0
Aggregated Statistics For Year 2007 (Based on 6 partial tracts)
A) FHA, FSA/RHS & VA Home Purchase Loans
B) Conventional Home Purchase Loans
C) Refinancings
D) Home Improvement Loans
F) Non-occupant Loans on < 5 Family Dwellings (A B C & D)
G) Loans On Manufactured Home Dwelling (A B C & D)
Number
Average Value
Number
Average Value
Number
Average Value
Number
Average Value
Number
Average Value
Number
Average Value
LOANS ORIGINATED
20
$113,432
48
$95,602
45
$119,052
25
$27,026
10
$112,112
27
$71,527
APPLICATIONS APPROVED, NOT ACCEPTED
1
$128,320
20
$72,905
10
$121,980
5
$53,188
2
$59,200
16
$55,017
APPLICATIONS DENIED
3
$145,390
73
$66,474
68
$86,511
59
$26,371
10
$60,159
67
$55,972
APPLICATIONS WITHDRAWN
3
$136,137
13
$106,160
30
$102,594
7
$42,537
4
$86,835
9
$53,506
FILES CLOSED FOR INCOMPLETENESS
1
$88,110
5
$97,298
7
$136,254
1
$16,360
2
$16,625
0
$0
Aggregated Statistics For Year 2006 (Based on 6 partial tracts)
A) FHA, FSA/RHS & VA Home Purchase Loans
B) Conventional Home Purchase Loans
C) Refinancings
D) Home Improvement Loans
F) Non-occupant Loans on < 5 Family Dwellings (A B C & D)
G) Loans On Manufactured Home Dwelling (A B C & D)
Number
Average Value
Number
Average Value
Number
Average Value
Number
Average Value
Number
Average Value
Number
Average Value
LOANS ORIGINATED
17
$114,569
68
$95,012
46
$109,287
31
$28,239
16
$97,118
30
$80,254
APPLICATIONS APPROVED, NOT ACCEPTED
3
$97,447
24
$63,405
13
$96,299
3
$26,880
3
$52,087
20
$49,634
APPLICATIONS DENIED
5
$89,194
73
$67,302
82
$78,670
50
$23,471
7
$62,894
62
$48,897
APPLICATIONS WITHDRAWN
4
$82,742
20
$87,906
48
$90,023
8
$33,425
7
$85,717
7
$70,087
FILES CLOSED FOR INCOMPLETENESS
1
$69,080
6
$97,043
5
$122,930
1
$34,310
0
$0
1
$52,250
Aggregated Statistics For Year 2005 (Based on 6 partial tracts)
A) FHA, FSA/RHS & VA Home Purchase Loans
B) Conventional Home Purchase Loans
C) Refinancings
D) Home Improvement Loans
F) Non-occupant Loans on < 5 Family Dwellings (A B C & D)
G) Loans On Manufactured Home Dwelling (A B C & D)
Number
Average Value
Number
Average Value
Number
Average Value
Number
Average Value
Number
Average Value
Number
Average Value
LOANS ORIGINATED
22
$107,905
66
$77,435
66
$92,784
23
$29,020
11
$78,888
39
$76,883
APPLICATIONS APPROVED, NOT ACCEPTED
3
$73,953
35
$62,685
13
$72,418
3
$16,497
1
$87,330
24
$53,656
APPLICATIONS DENIED
5
$46,008
88
$50,958
101
$78,127
54
$24,658
14
$67,359
84
$44,788
APPLICATIONS WITHDRAWN
2
$127,300
16
$72,211
50
$77,034
13
$109,720
4
$71,345
9
$62,391
FILES CLOSED FOR INCOMPLETENESS
1
$129,530
3
$71,037
16
$101,222
0
$0
1
$40,110
0
$0
Aggregated Statistics For Year 2004 (Based on 6 partial tracts)
A) FHA, FSA/RHS & VA Home Purchase Loans
B) Conventional Home Purchase Loans
C) Refinancings
D) Home Improvement Loans
F) Non-occupant Loans on < 5 Family Dwellings (A B C & D)
G) Loans On Manufactured Home Dwelling (A B C & D)
Number
Average Value
Number
Average Value
Number
Average Value
Number
Average Value
Number
Average Value
Number
Average Value
LOANS ORIGINATED
20
$102,653
59
$72,563
63
$86,581
20
$20,600
11
$68,782
47
$80,034
APPLICATIONS APPROVED, NOT ACCEPTED
2
$47,055
20
$45,205
17
$85,738
4
$41,530
1
$43,320
21
$44,776
APPLICATIONS DENIED
1
$123,450
89
$48,691
90
$75,155
51
$19,293
6
$43,613
79
$44,465
APPLICATIONS WITHDRAWN
3
$104,793
12
$75,453
46
$81,128
5
$20,896
2
$61,475
5
$81,922
FILES CLOSED FOR INCOMPLETENESS
1
$128,260
1
$88,890
13
$92,895
0
$0
1
$33,250
1
$78,640
Aggregated Statistics For Year 2003 (Based on 2 partial tracts)
A) FHA, FSA/RHS & VA Home Purchase Loans
B) Conventional Home Purchase Loans
C) Refinancings
D) Home Improvement Loans
F) Non-occupant Loans on < 5 Family Dwellings (A B C & D)
Number
Average Value
Number
Average Value
Number
Average Value
Number
Average Value
Number
Average Value
LOANS ORIGINATED
11
$117,172
20
$70,910
44
$76,687
5
$10,344
4
$37,870
APPLICATIONS APPROVED, NOT ACCEPTED
0
$0
8
$50,208
12
$69,186
2
$13,460
1
$32,200
APPLICATIONS DENIED
3
$91,660
26
$44,883
50
$62,988
12
$16,054
5
$38,952
APPLICATIONS WITHDRAWN
3
$99,050
8
$78,049
29
$69,833
2
$37,475
1
$82,340
FILES CLOSED FOR INCOMPLETENESS
1
$43,810
1
$67,560
5
$112,210
0
$0
0
$0
Aggregated Statistics For Year 1999 (Based on 1 partial tract)
A) FHA, FSA/RHS & VA Home Purchase Loans
B) Conventional Home Purchase Loans
C) Refinancings
D) Home Improvement Loans
F) Non-occupant Loans on < 5 Family Dwellings (A B C & D)
2004 - 2018 National Fire Incident Reporting System (NFIRS) incidents
Based on the data from the years 2004 - 2018 the average number of fires per year is 21. The highest number of fires - 52 took place in 2008, and the least - 3 in 2006. The data has an increasing trend.
When looking into fire subcategories, the most incidents belonged to: Outside Fires (63.3%), and Structure Fires (28.0%).
Fire incident types reported to NFIRS in Zip Code 78069


 Nearest zip codes: 78073, 78065, 78052, 78002, 78252, 78059.


 Based on the data from the years 2004 - 2018 the average number of fires per year is 21. The highest number of fires - 52 took place in 2008, and the least - 3 in 2006. The data has an increasing trend.
 When looking into fire subcategories, the most incidents belonged to: Outside Fires (63.3%), and Structure Fires (28.0%).