Estimated zip code population in 2022: 15,755
Zip code population in 2010: 9,206
Zip code population in 2000: 2,648
Houses and condos: 5,550
Renter-occupied apartments: 675
% of renters here:
12%State:
34%
March 2022 cost of living index in zip code 80018: 102.6
(near average, U.S. average is 100)
Land area: 26.5
sq. mi.
Water area: 0.0
sq. mi.
Population density: 594 people per square mile (low).
OSM Map
General Map
Google Map
MSN Map
OSM Map
General Map
Google Map
MSN Map
OSM Map
General Map
Google Map
MSN Map
OSM Map
General Map
Google Map
MSN Map
Please wait while loading the map...
Real estate property taxes paid for housing units in 2022:
This zip code:
0.8% ($4,189)Colorado:
0.5% ($2,422)
Median real estate property taxes paid for housing units with mortgages in 2022: $4,260 (0.8%)
Median real estate property taxes paid for housing units with no mortgage in 2022: $3,701 (0.7%)
Business Search - 14 Million verified businesses
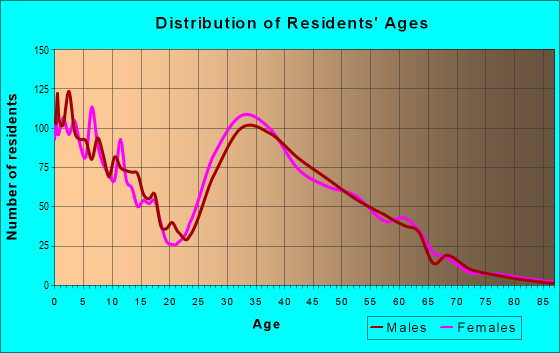
Males: 8,028 Females: 7,727
For population 25 years and over in 80018:
High school or higher: 91.6%Bachelor's degree or higher: 40.0%Graduate or professional degree: 12.6%Unemployed: 2.3%Mean travel time to work (commute): 29.5 minutes
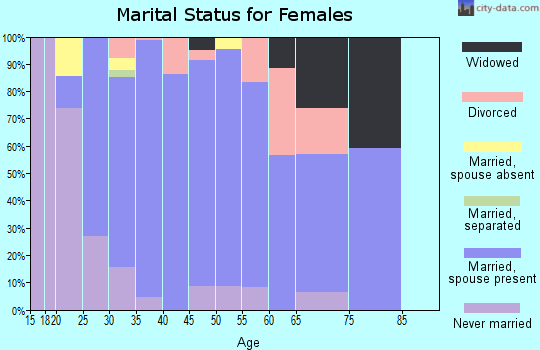
For population 15 years and over in 80018:
Never married: 24.0%Now married: 63.3%Separated: 1.2%Widowed: 2.9%Divorced: 8.6%
Zip code 80018 compared to state average:
Black race population percentage significantly above state average. Foreign-born population percentage above state average. Renting percentage significantly below state average. Length of stay since moving in above state average. House age significantly below state average. 7,985 50.7% White 3,152 20.0% Hispanic or Latino 2,498 15.9% Black 1,147 7.3% Two or more races 841 5.3% Asian 96 0.6% Some other race 27 0.2% Native Hawaiian and Other 6 0.04% American Indian
Data:
Median household income ($)
Median household income (% change since 2000)
Household income diversity
Ratio of average income to average house value (%)
Ratio of average income to average rent
Median household income ($) - White
Median household income ($) - Black or African American
Median household income ($) - Asian
Median household income ($) - Hispanic or Latino
Median household income ($) - American Indian and Alaska Native
Median household income ($) - Multirace
Median household income ($) - Other Race
Median household income for houses/condos with a mortgage ($)
Median household income for apartments without a mortgage ($)
Races - White alone (%)
Races - White alone (% change since 2000)
Races - Black alone (%)
Races - Black alone (% change since 2000)
Races - American Indian alone (%)
Races - American Indian alone (% change since 2000)
Races - Asian alone (%)
Races - Asian alone (% change since 2000)
Races - Hispanic (%)
Races - Hispanic (% change since 2000)
Races - Native Hawaiian and Other Pacific Islander alone (%)
Races - Native Hawaiian and Other Pacific Islander alone (% change since 2000)
Races - Two or more races (%)
Races - Two or more races (% change since 2000)
Races - Other race alone (%)
Races - Other race alone (% change since 2000)
Racial diversity
Unemployment (%)
Unemployment (% change since 2000)
Unemployment (%) - White
Unemployment (%) - Black or African American
Unemployment (%) - Asian
Unemployment (%) - Hispanic or Latino
Unemployment (%) - American Indian and Alaska Native
Unemployment (%) - Multirace
Unemployment (%) - Other Race
Population density (people per square mile)
Population - Males (%)
Population - Females (%)
Population - Males (%) - White
Population - Males (%) - Black or African American
Population - Males (%) - Asian
Population - Males (%) - Hispanic or Latino
Population - Males (%) - American Indian and Alaska Native
Population - Males (%) - Multirace
Population - Males (%) - Other Race
Population - Females (%) - White
Population - Females (%) - Black or African American
Population - Females (%) - Asian
Population - Females (%) - Hispanic or Latino
Population - Females (%) - American Indian and Alaska Native
Population - Females (%) - Multirace
Population - Females (%) - Other Race
Coronavirus confirmed cases (Jun 16, 2024)
Deaths caused by coronavirus (Jun 16, 2024)
Coronavirus confirmed cases (per 100k population) (Jun 16, 2024)
Deaths caused by coronavirus (per 100k population) (Jun 16, 2024)
Daily increase in number of cases (Jun 16, 2024)
Weekly increase in number of cases (Jun 16, 2024)
Cases doubled (in days) (Jun 16, 2024)
Hospitalized patients (Apr 18, 2022)
Negative test results (Apr 18, 2022)
Total test results (Apr 18, 2022)
COVID Vaccine doses distributed (per 100k population) (Sep 19, 2023)
COVID Vaccine doses administered (per 100k population) (Sep 19, 2023)
COVID Vaccine doses distributed (Sep 19, 2023)
COVID Vaccine doses administered (Sep 19, 2023)
Likely homosexual households (%)
Likely homosexual households (% change since 2000)
Likely homosexual households - Lesbian couples (%)
Likely homosexual households - Lesbian couples (% change since 2000)
Likely homosexual households - Gay men (%)
Likely homosexual households - Gay men (% change since 2000)
Cost of living index
Median gross rent ($)
Median contract rent ($)
Median monthly housing costs ($)
Median house or condo value ($)
Median house or condo value ($ change since 2000)
Mean house or condo value by units in structure - 1, detached ($)
Mean house or condo value by units in structure - 1, attached ($)
Mean house or condo value by units in structure - 2 ($)
Mean house or condo value by units in structure by units in structure - 3 or 4 ($)
Mean house or condo value by units in structure - 5 or more ($)
Mean house or condo value by units in structure - Boat, RV, van, etc. ($)
Mean house or condo value by units in structure - Mobile home ($)
Median house or condo value ($) - White
Median house or condo value ($) - Black or African American
Median house or condo value ($) - Asian
Median house or condo value ($) - Hispanic or Latino
Median house or condo value ($) - American Indian and Alaska Native
Median house or condo value ($) - Multirace
Median house or condo value ($) - Other Race
Median resident age
Resident age diversity
Median resident age - Males
Median resident age - Females
Median resident age - White
Median resident age - Black or African American
Median resident age - Asian
Median resident age - Hispanic or Latino
Median resident age - American Indian and Alaska Native
Median resident age - Multirace
Median resident age - Other Race
Median resident age - Males - White
Median resident age - Males - Black or African American
Median resident age - Males - Asian
Median resident age - Males - Hispanic or Latino
Median resident age - Males - American Indian and Alaska Native
Median resident age - Males - Multirace
Median resident age - Males - Other Race
Median resident age - Females - White
Median resident age - Females - Black or African American
Median resident age - Females - Asian
Median resident age - Females - Hispanic or Latino
Median resident age - Females - American Indian and Alaska Native
Median resident age - Females - Multirace
Median resident age - Females - Other Race
Commute - mean travel time to work (minutes)
Travel time to work - Less than 5 minutes (%)
Travel time to work - Less than 5 minutes (% change since 2000)
Travel time to work - 5 to 9 minutes (%)
Travel time to work - 5 to 9 minutes (% change since 2000)
Travel time to work - 10 to 19 minutes (%)
Travel time to work - 10 to 19 minutes (% change since 2000)
Travel time to work - 20 to 29 minutes (%)
Travel time to work - 20 to 29 minutes (% change since 2000)
Travel time to work - 30 to 39 minutes (%)
Travel time to work - 30 to 39 minutes (% change since 2000)
Travel time to work - 40 to 59 minutes (%)
Travel time to work - 40 to 59 minutes (% change since 2000)
Travel time to work - 60 to 89 minutes (%)
Travel time to work - 60 to 89 minutes (% change since 2000)
Travel time to work - 90 or more minutes (%)
Travel time to work - 90 or more minutes (% change since 2000)
Marital status - Never married (%)
Marital status - Now married (%)
Marital status - Separated (%)
Marital status - Widowed (%)
Marital status - Divorced (%)
Median family income ($)
Median family income (% change since 2000)
Median non-family income ($)
Median non-family income (% change since 2000)
Median per capita income ($)
Median per capita income (% change since 2000)
Median family income ($) - White
Median family income ($) - Black or African American
Median family income ($) - Asian
Median family income ($) - Hispanic or Latino
Median family income ($) - American Indian and Alaska Native
Median family income ($) - Multirace
Median family income ($) - Other Race
Median year house/condo built
Median year apartment built
Year house built - Built 2005 or later (%)
Year house built - Built 2000 to 2004 (%)
Year house built - Built 1990 to 1999 (%)
Year house built - Built 1980 to 1989 (%)
Year house built - Built 1970 to 1979 (%)
Year house built - Built 1960 to 1969 (%)
Year house built - Built 1950 to 1959 (%)
Year house built - Built 1940 to 1949 (%)
Year house built - Built 1939 or earlier (%)
Average household size
Household density (households per square mile)
Average household size - White
Average household size - Black or African American
Average household size - Asian
Average household size - Hispanic or Latino
Average household size - American Indian and Alaska Native
Average household size - Multirace
Average household size - Other Race
Occupied housing units (%)
Vacant housing units (%)
Owner occupied housing units (%)
Renter occupied housing units (%)
Vacancy status - For rent (%)
Vacancy status - For sale only (%)
Vacancy status - Rented or sold, not occupied (%)
Vacancy status - For seasonal, recreational, or occasional use (%)
Vacancy status - For migrant workers (%)
Vacancy status - Other vacant (%)
Residents with income below the poverty level (%)
Residents with income below 50% of the poverty level (%)
Children below poverty level (%)
Poor families by family type - Married-couple family (%)
Poor families by family type - Male, no wife present (%)
Poor families by family type - Female, no husband present (%)
Poverty status for native-born residents (%)
Poverty status for foreign-born residents (%)
Poverty among high school graduates not in families (%)
Poverty among people who did not graduate high school not in families (%)
Residents with income below the poverty level (%) - White
Residents with income below the poverty level (%) - Black or African American
Residents with income below the poverty level (%) - Asian
Residents with income below the poverty level (%) - Hispanic or Latino
Residents with income below the poverty level (%) - American Indian and Alaska Native
Residents with income below the poverty level (%) - Multirace
Residents with income below the poverty level (%) - Other Race
Air pollution - Air Quality Index (AQI)
Air pollution - CO
Air pollution - NO2
Air pollution - SO2
Air pollution - Ozone
Air pollution - PM10
Air pollution - PM25
Air pollution - Pb
Crime - Murders per 100,000 population
Crime - Rapes per 100,000 population
Crime - Robberies per 100,000 population
Crime - Assaults per 100,000 population
Crime - Burglaries per 100,000 population
Crime - Thefts per 100,000 population
Crime - Auto thefts per 100,000 population
Crime - Arson per 100,000 population
Crime - City-data.com crime index
Crime - Violent crime index
Crime - Property crime index
Crime - Murders per 100,000 population (5 year average)
Crime - Rapes per 100,000 population (5 year average)
Crime - Robberies per 100,000 population (5 year average)
Crime - Assaults per 100,000 population (5 year average)
Crime - Burglaries per 100,000 population (5 year average)
Crime - Thefts per 100,000 population (5 year average)
Crime - Auto thefts per 100,000 population (5 year average)
Crime - Arson per 100,000 population (5 year average)
Crime - City-data.com crime index (5 year average)
Crime - Violent crime index (5 year average)
Crime - Property crime index (5 year average)
1996 Presidential Elections Results (%) - Democratic Party (Clinton)
1996 Presidential Elections Results (%) - Republican Party (Dole)
1996 Presidential Elections Results (%) - Other
2000 Presidential Elections Results (%) - Democratic Party (Gore)
2000 Presidential Elections Results (%) - Republican Party (Bush)
2000 Presidential Elections Results (%) - Other
2004 Presidential Elections Results (%) - Democratic Party (Kerry)
2004 Presidential Elections Results (%) - Republican Party (Bush)
2004 Presidential Elections Results (%) - Other
2008 Presidential Elections Results (%) - Democratic Party (Obama)
2008 Presidential Elections Results (%) - Republican Party (McCain)
2008 Presidential Elections Results (%) - Other
2012 Presidential Elections Results (%) - Democratic Party (Obama)
2012 Presidential Elections Results (%) - Republican Party (Romney)
2012 Presidential Elections Results (%) - Other
2016 Presidential Elections Results (%) - Democratic Party (Clinton)
2016 Presidential Elections Results (%) - Republican Party (Trump)
2016 Presidential Elections Results (%) - Other
2020 Presidential Elections Results (%) - Democratic Party (Biden)
2020 Presidential Elections Results (%) - Republican Party (Trump)
2020 Presidential Elections Results (%) - Other
Ancestries Reported - Arab (%)
Ancestries Reported - Czech (%)
Ancestries Reported - Danish (%)
Ancestries Reported - Dutch (%)
Ancestries Reported - English (%)
Ancestries Reported - French (%)
Ancestries Reported - French Canadian (%)
Ancestries Reported - German (%)
Ancestries Reported - Greek (%)
Ancestries Reported - Hungarian (%)
Ancestries Reported - Irish (%)
Ancestries Reported - Italian (%)
Ancestries Reported - Lithuanian (%)
Ancestries Reported - Norwegian (%)
Ancestries Reported - Polish (%)
Ancestries Reported - Portuguese (%)
Ancestries Reported - Russian (%)
Ancestries Reported - Scotch-Irish (%)
Ancestries Reported - Scottish (%)
Ancestries Reported - Slovak (%)
Ancestries Reported - Subsaharan African (%)
Ancestries Reported - Swedish (%)
Ancestries Reported - Swiss (%)
Ancestries Reported - Ukrainian (%)
Ancestries Reported - United States (%)
Ancestries Reported - Welsh (%)
Ancestries Reported - West Indian (%)
Ancestries Reported - Other (%)
Educational Attainment - No schooling completed (%)
Educational Attainment - Less than high school (%)
Educational Attainment - High school or equivalent (%)
Educational Attainment - Less than 1 year of college (%)
Educational Attainment - 1 or more years of college (%)
Educational Attainment - Associate degree (%)
Educational Attainment - Bachelor's degree (%)
Educational Attainment - Master's degree (%)
Educational Attainment - Professional school degree (%)
Educational Attainment - Doctorate degree (%)
School Enrollment - Nursery, preschool (%)
School Enrollment - Kindergarten (%)
School Enrollment - Grade 1 to 4 (%)
School Enrollment - Grade 5 to 8 (%)
School Enrollment - Grade 9 to 12 (%)
School Enrollment - College undergrad (%)
School Enrollment - Graduate or professional (%)
School Enrollment - Not enrolled in school (%)
School enrollment - Public schools (%)
School enrollment - Private schools (%)
School enrollment - Not enrolled (%)
Median number of rooms in houses and condos
Median number of rooms in apartments
Housing units lacking complete plumbing facilities (%)
Housing units lacking complete kitchen facilities (%)
Density of houses
Urban houses (%)
Rural houses (%)
Households with people 60 years and over (%)
Households with people 65 years and over (%)
Households with people 75 years and over (%)
Households with one or more nonrelatives (%)
Households with no nonrelatives (%)
Population in households (%)
Family households (%)
Nonfamily households (%)
Population in families (%)
Family households with own children (%)
Median number of bedrooms in owner occupied houses
Mean number of bedrooms in owner occupied houses
Median number of bedrooms in renter occupied houses
Mean number of bedrooms in renter occupied houses
Median number of vehichles in owner occupied houses
Mean number of vehichles in owner occupied houses
Median number of vehichles in renter occupied houses
Mean number of vehichles in renter occupied houses
Mortgage status - with mortgage (%)
Mortgage status - with second mortgage (%)
Mortgage status - with home equity loan (%)
Mortgage status - with both second mortgage and home equity loan (%)
Mortgage status - without a mortgage (%)
Average family size
Average family size - White
Average family size - Black or African American
Average family size - Asian
Average family size - Hispanic or Latino
Average family size - American Indian and Alaska Native
Average family size - Multirace
Average family size - Other Race
Geographical mobility - Same house 1 year ago (%)
Geographical mobility - Moved within same county (%)
Geographical mobility - Moved from different county within same state (%)
Geographical mobility - Moved from different state (%)
Geographical mobility - Moved from abroad (%)
Place of birth - Born in state of residence (%)
Place of birth - Born in other state (%)
Place of birth - Native, outside of US (%)
Place of birth - Foreign born (%)
Housing units in structures - 1, detached (%)
Housing units in structures - 1, attached (%)
Housing units in structures - 2 (%)
Housing units in structures - 3 or 4 (%)
Housing units in structures - 5 to 9 (%)
Housing units in structures - 10 to 19 (%)
Housing units in structures - 20 to 49 (%)
Housing units in structures - 50 or more (%)
Housing units in structures - Mobile home (%)
Housing units in structures - Boat, RV, van, etc. (%)
House/condo owner moved in on average (years ago)
Renter moved in on average (years ago)
Year householder moved into unit - Moved in 1999 to March 2000 (%)
Year householder moved into unit - Moved in 1995 to 1998 (%)
Year householder moved into unit - Moved in 1990 to 1994 (%)
Year householder moved into unit - Moved in 1980 to 1989 (%)
Year householder moved into unit - Moved in 1970 to 1979 (%)
Year householder moved into unit - Moved in 1969 or earlier (%)
Means of transportation to work - Drove car alone (%)
Means of transportation to work - Carpooled (%)
Means of transportation to work - Public transportation (%)
Means of transportation to work - Bus or trolley bus (%)
Means of transportation to work - Streetcar or trolley car (%)
Means of transportation to work - Subway or elevated (%)
Means of transportation to work - Railroad (%)
Means of transportation to work - Ferryboat (%)
Means of transportation to work - Taxicab (%)
Means of transportation to work - Motorcycle (%)
Means of transportation to work - Bicycle (%)
Means of transportation to work - Walked (%)
Means of transportation to work - Other means (%)
Working at home (%)
Industry diversity
Most Common Industries - Agriculture, forestry, fishing and hunting, and mining (%)
Most Common Industries - Agriculture, forestry, fishing and hunting (%)
Most Common Industries - Mining, quarrying, and oil and gas extraction (%)
Most Common Industries - Construction (%)
Most Common Industries - Manufacturing (%)
Most Common Industries - Wholesale trade (%)
Most Common Industries - Retail trade (%)
Most Common Industries - Transportation and warehousing, and utilities (%)
Most Common Industries - Transportation and warehousing (%)
Most Common Industries - Utilities (%)
Most Common Industries - Information (%)
Most Common Industries - Finance and insurance, and real estate and rental and leasing (%)
Most Common Industries - Finance and insurance (%)
Most Common Industries - Real estate and rental and leasing (%)
Most Common Industries - Professional, scientific, and management, and administrative and waste management services (%)
Most Common Industries - Professional, scientific, and technical services (%)
Most Common Industries - Management of companies and enterprises (%)
Most Common Industries - Administrative and support and waste management services (%)
Most Common Industries - Educational services, and health care and social assistance (%)
Most Common Industries - Educational services (%)
Most Common Industries - Health care and social assistance (%)
Most Common Industries - Arts, entertainment, and recreation, and accommodation and food services (%)
Most Common Industries - Arts, entertainment, and recreation (%)
Most Common Industries - Accommodation and food services (%)
Most Common Industries - Other services, except public administration (%)
Most Common Industries - Public administration (%)
Occupation diversity
Most Common Occupations - Management, business, science, and arts occupations (%)
Most Common Occupations - Management, business, and financial occupations (%)
Most Common Occupations - Management occupations (%)
Most Common Occupations - Business and financial operations occupations (%)
Most Common Occupations - Computer, engineering, and science occupations (%)
Most Common Occupations - Computer and mathematical occupations (%)
Most Common Occupations - Architecture and engineering occupations (%)
Most Common Occupations - Life, physical, and social science occupations (%)
Most Common Occupations - Education, legal, community service, arts, and media occupations (%)
Most Common Occupations - Community and social service occupations (%)
Most Common Occupations - Legal occupations (%)
Most Common Occupations - Education, training, and library occupations (%)
Most Common Occupations - Arts, design, entertainment, sports, and media occupations (%)
Most Common Occupations - Healthcare practitioners and technical occupations (%)
Most Common Occupations - Health diagnosing and treating practitioners and other technical occupations (%)
Most Common Occupations - Health technologists and technicians (%)
Most Common Occupations - Service occupations (%)
Most Common Occupations - Healthcare support occupations (%)
Most Common Occupations - Protective service occupations (%)
Most Common Occupations - Fire fighting and prevention, and other protective service workers including supervisors (%)
Most Common Occupations - Law enforcement workers including supervisors (%)
Most Common Occupations - Food preparation and serving related occupations (%)
Most Common Occupations - Building and grounds cleaning and maintenance occupations (%)
Most Common Occupations - Personal care and service occupations (%)
Most Common Occupations - Sales and office occupations (%)
Most Common Occupations - Sales and related occupations (%)
Most Common Occupations - Office and administrative support occupations (%)
Most Common Occupations - Natural resources, construction, and maintenance occupations (%)
Most Common Occupations - Farming, fishing, and forestry occupations (%)
Most Common Occupations - Construction and extraction occupations (%)
Most Common Occupations - Installation, maintenance, and repair occupations (%)
Most Common Occupations - Production, transportation, and material moving occupations (%)
Most Common Occupations - Production occupations (%)
Most Common Occupations - Transportation occupations (%)
Most Common Occupations - Material moving occupations (%)
People in Group quarters - Institutionalized population (%)
People in Group quarters - Correctional institutions (%)
People in Group quarters - Federal prisons and detention centers (%)
People in Group quarters - Halfway houses (%)
People in Group quarters - Local jails and other confinement facilities (including police lockups) (%)
People in Group quarters - Military disciplinary barracks (%)
People in Group quarters - State prisons (%)
People in Group quarters - Other types of correctional institutions (%)
People in Group quarters - Nursing homes (%)
People in Group quarters - Hospitals/wards, hospices, and schools for the handicapped (%)
People in Group quarters - Hospitals/wards and hospices for chronically ill (%)
People in Group quarters - Hospices or homes for chronically ill (%)
People in Group quarters - Military hospitals or wards for chronically ill (%)
People in Group quarters - Other hospitals or wards for chronically ill (%)
People in Group quarters - Hospitals or wards for drug/alcohol abuse (%)
People in Group quarters - Mental (Psychiatric) hospitals or wards (%)
People in Group quarters - Schools, hospitals, or wards for the mentally retarded (%)
People in Group quarters - Schools, hospitals, or wards for the physically handicapped (%)
People in Group quarters - Institutions for the deaf (%)
People in Group quarters - Institutions for the blind (%)
People in Group quarters - Orthopedic wards and institutions for the physically handicapped (%)
People in Group quarters - Wards in general hospitals for patients who have no usual home elsewhere (%)
People in Group quarters - Wards in military hospitals for patients who have no usual home elsewhere (%)
People in Group quarters - Juvenile institutions (%)
People in Group quarters - Long-term care (%)
People in Group quarters - Homes for abused, dependent, and neglected children (%)
People in Group quarters - Residential treatment centers for emotionally disturbed children (%)
People in Group quarters - Training schools for juvenile delinquents (%)
People in Group quarters - Short-term care, detention or diagnostic centers for delinquent children (%)
People in Group quarters - Type of juvenile institution unknown (%)
People in Group quarters - Noninstitutionalized population (%)
People in Group quarters - College dormitories (includes college quarters off campus) (%)
People in Group quarters - Military quarters (%)
People in Group quarters - On base (%)
People in Group quarters - Barracks, unaccompanied personnel housing (UPH), (Enlisted/Officer), ;and similar group living quarters for military personnel (%)
People in Group quarters - Transient quarters for temporary residents (%)
People in Group quarters - Military ships (%)
People in Group quarters - Group homes (%)
People in Group quarters - Homes or halfway houses for drug/alcohol abuse (%)
People in Group quarters - Homes for the mentally ill (%)
People in Group quarters - Homes for the mentally retarded (%)
People in Group quarters - Homes for the physically handicapped (%)
People in Group quarters - Other group homes (%)
People in Group quarters - Religious group quarters (%)
People in Group quarters - Dormitories (%)
People in Group quarters - Agriculture workers' dormitories on farms (%)
People in Group quarters - Job Corps and vocational training facilities (%)
People in Group quarters - Other workers' dormitories (%)
People in Group quarters - Crews of maritime vessels (%)
People in Group quarters - Other nonhousehold living situations (%)
People in Group quarters - Other noninstitutional group quarters (%)
Residents speaking English at home (%)
Residents speaking English at home - Born in the United States (%)
Residents speaking English at home - Native, born elsewhere (%)
Residents speaking English at home - Foreign born (%)
Residents speaking Spanish at home (%)
Residents speaking Spanish at home - Born in the United States (%)
Residents speaking Spanish at home - Native, born elsewhere (%)
Residents speaking Spanish at home - Foreign born (%)
Residents speaking other language at home (%)
Residents speaking other language at home - Born in the United States (%)
Residents speaking other language at home - Native, born elsewhere (%)
Residents speaking other language at home - Foreign born (%)
Class of Workers - Employee of private company (%)
Class of Workers - Self-employed in own incorporated business (%)
Class of Workers - Private not-for-profit wage and salary workers (%)
Class of Workers - Local government workers (%)
Class of Workers - State government workers (%)
Class of Workers - Federal government workers (%)
Class of Workers - Self-employed workers in own not incorporated business and Unpaid family workers (%)
House heating fuel used in houses and condos - Utility gas (%)
House heating fuel used in houses and condos - Bottled, tank, or LP gas (%)
House heating fuel used in houses and condos - Electricity (%)
House heating fuel used in houses and condos - Fuel oil, kerosene, etc. (%)
House heating fuel used in houses and condos - Coal or coke (%)
House heating fuel used in houses and condos - Wood (%)
House heating fuel used in houses and condos - Solar energy (%)
House heating fuel used in houses and condos - Other fuel (%)
House heating fuel used in houses and condos - No fuel used (%)
House heating fuel used in apartments - Utility gas (%)
House heating fuel used in apartments - Bottled, tank, or LP gas (%)
House heating fuel used in apartments - Electricity (%)
House heating fuel used in apartments - Fuel oil, kerosene, etc. (%)
House heating fuel used in apartments - Coal or coke (%)
House heating fuel used in apartments - Wood (%)
House heating fuel used in apartments - Solar energy (%)
House heating fuel used in apartments - Other fuel (%)
House heating fuel used in apartments - No fuel used (%)
Armed forces status - In Armed Forces (%)
Armed forces status - Civilian (%)
Armed forces status - Civilian - Veteran (%)
Armed forces status - Civilian - Nonveteran (%)
Fatal accidents locations in years 2005-2021
Fatal accidents locations in 2005
Fatal accidents locations in 2006
Fatal accidents locations in 2007
Fatal accidents locations in 2008
Fatal accidents locations in 2009
Fatal accidents locations in 2010
Fatal accidents locations in 2011
Fatal accidents locations in 2012
Fatal accidents locations in 2013
Fatal accidents locations in 2014
Fatal accidents locations in 2015
Fatal accidents locations in 2016
Fatal accidents locations in 2017
Fatal accidents locations in 2018
Fatal accidents locations in 2019
Fatal accidents locations in 2020
Fatal accidents locations in 2021
Alcohol use - People drinking some alcohol every month (%)
Alcohol use - People not drinking at all (%)
Alcohol use - Average days/month drinking alcohol
Alcohol use - Average drinks/week
Alcohol use - Average days/year people drink much
Audiometry - Average condition of hearing (%)
Audiometry - People that can hear a whisper from across a quiet room (%)
Audiometry - People that can hear normal voice from across a quiet room (%)
Audiometry - Ears ringing, roaring, buzzing (%)
Audiometry - Had a job exposure to loud noise (%)
Audiometry - Had off-work exposure to loud noise (%)
Blood Pressure & Cholesterol - Has high blood pressure (%)
Blood Pressure & Cholesterol - Checking blood pressure at home (%)
Blood Pressure & Cholesterol - Frequently checking blood cholesterol (%)
Blood Pressure & Cholesterol - Has high cholesterol level (%)
Consumer Behavior - Money monthly spent on food at supermarket/grocery store
Consumer Behavior - Money monthly spent on food at other stores
Consumer Behavior - Money monthly spent on eating out
Consumer Behavior - Money monthly spent on carryout/delivered foods
Consumer Behavior - Income spent on food at supermarket/grocery store (%)
Consumer Behavior - Income spent on food at other stores (%)
Consumer Behavior - Income spent on eating out (%)
Consumer Behavior - Income spent on carryout/delivered foods (%)
Current Health Status - General health condition (%)
Current Health Status - Blood donors (%)
Current Health Status - Has blood ever tested for HIV virus (%)
Current Health Status - Left-handed people (%)
Dermatology - People using sunscreen (%)
Diabetes - Diabetics (%)
Diabetes - Had a blood test for high blood sugar (%)
Diabetes - People taking insulin (%)
Diet Behavior & Nutrition - Diet health (%)
Diet Behavior & Nutrition - Milk product consumption (# of products/month)
Diet Behavior & Nutrition - Meals not home prepared (#/week)
Diet Behavior & Nutrition - Meals from fast food or pizza place (#/week)
Diet Behavior & Nutrition - Ready-to-eat foods (#/month)
Diet Behavior & Nutrition - Frozen meals/pizza (#/month)
Drug Use - People that ever used marijuana or hashish (%)
Drug Use - Ever used hard drugs (%)
Drug Use - Ever used any form of cocaine (%)
Drug Use - Ever used heroin (%)
Drug Use - Ever used methamphetamine (%)
Health Insurance - People covered by health insurance (%)
Kidney Conditions-Urology - Avg. # of times urinating at night
Medical Conditions - People with asthma (%)
Medical Conditions - People with anemia (%)
Medical Conditions - People with psoriasis (%)
Medical Conditions - People with overweight (%)
Medical Conditions - Elderly people having difficulties in thinking or remembering (%)
Medical Conditions - People who ever received blood transfusion (%)
Medical Conditions - People having trouble seeing even with glass/contacts (%)
Medical Conditions - People with arthritis (%)
Medical Conditions - People with gout (%)
Medical Conditions - People with congestive heart failure (%)
Medical Conditions - People with coronary heart disease (%)
Medical Conditions - People with angina pectoris (%)
Medical Conditions - People who ever had heart attack (%)
Medical Conditions - People who ever had stroke (%)
Medical Conditions - People with emphysema (%)
Medical Conditions - People with thyroid problem (%)
Medical Conditions - People with chronic bronchitis (%)
Medical Conditions - People with any liver condition (%)
Medical Conditions - People who ever had cancer or malignancy (%)
Mental Health - People who have little interest in doing things (%)
Mental Health - People feeling down, depressed, or hopeless (%)
Mental Health - People who have trouble sleeping or sleeping too much (%)
Mental Health - People feeling tired or having little energy (%)
Mental Health - People with poor appetite or overeating (%)
Mental Health - People feeling bad about themself (%)
Mental Health - People who have trouble concentrating on things (%)
Mental Health - People moving or speaking slowly or too fast (%)
Mental Health - People having thoughts they would be better off dead (%)
Oral Health - Average years since last visit a dentist
Oral Health - People embarrassed because of mouth (%)
Oral Health - People with gum disease (%)
Oral Health - General health of teeth and gums (%)
Oral Health - Average days a week using dental floss/device
Oral Health - Average days a week using mouthwash for dental problem
Oral Health - Average number of teeth
Pesticide Use - Households using pesticides to control insects (%)
Pesticide Use - Households using pesticides to kill weeds (%)
Physical Activity - People doing vigorous-intensity work activities (%)
Physical Activity - People doing moderate-intensity work activities (%)
Physical Activity - People walking or bicycling (%)
Physical Activity - People doing vigorous-intensity recreational activities (%)
Physical Activity - People doing moderate-intensity recreational activities (%)
Physical Activity - Average hours a day doing sedentary activities
Physical Activity - Average hours a day watching TV or videos
Physical Activity - Average hours a day using computer
Physical Functioning - People having limitations keeping them from working (%)
Physical Functioning - People limited in amount of work they can do (%)
Physical Functioning - People that need special equipment to walk (%)
Physical Functioning - People experiencing confusion/memory problems (%)
Physical Functioning - People requiring special healthcare equipment (%)
Prescription Medications - Average number of prescription medicines taking
Preventive Aspirin Use - Adults 40+ taking low-dose aspirin (%)
Reproductive Health - Vaginal deliveries (%)
Reproductive Health - Cesarean deliveries (%)
Reproductive Health - Deliveries resulted in a live birth (%)
Reproductive Health - Pregnancies resulted in a delivery (%)
Reproductive Health - Women breastfeeding newborns (%)
Reproductive Health - Women that had a hysterectomy (%)
Reproductive Health - Women that had both ovaries removed (%)
Reproductive Health - Women that have ever taken birth control pills (%)
Reproductive Health - Women taking birth control pills (%)
Reproductive Health - Women that have ever used Depo-Provera or injectables (%)
Reproductive Health - Women that have ever used female hormones (%)
Sexual Behavior - People 18+ that ever had sex (vaginal, anal, or oral) (%)
Sexual Behavior - Males 18+ that ever had vaginal sex with a woman (%)
Sexual Behavior - Males 18+ that ever performed oral sex on a woman (%)
Sexual Behavior - Males 18+ that ever had anal sex with a woman (%)
Sexual Behavior - Males 18+ that ever had any sex with a man (%)
Sexual Behavior - Females 18+ that ever had vaginal sex with a man (%)
Sexual Behavior - Females 18+ that ever performed oral sex on a man (%)
Sexual Behavior - Females 18+ that ever had anal sex with a man (%)
Sexual Behavior - Females 18+ that ever had any kind of sex with a woman (%)
Sexual Behavior - Average age people first had sex
Sexual Behavior - Average number of female sex partners in lifetime (males 18+)
Sexual Behavior - Average number of female vaginal sex partners in lifetime (males 18+)
Sexual Behavior - Average age people first performed oral sex on a woman (18+)
Sexual Behavior - Average number of woman performed oral sex on in lifetime (18+)
Sexual Behavior - Average number of male sex partners in lifetime (males 18+)
Sexual Behavior - Average number of male anal sex partners in lifetime (males 18+)
Sexual Behavior - Average age people first performed oral sex on a man (18+)
Sexual Behavior - Average number of male oral sex partners in lifetime (18+)
Sexual Behavior - People using protection when performing oral sex (%)
Sexual Behavior - Average number of times people have vaginal or anal sex a year
Sexual Behavior - People having sex without condom (%)
Sexual Behavior - Average number of male sex partners in lifetime (females 18+)
Sexual Behavior - Average number of male vaginal sex partners in lifetime (females 18+)
Sexual Behavior - Average number of female sex partners in lifetime (females 18+)
Sexual Behavior - Circumcised males 18+ (%)
Sleep Disorders - Average hours sleeping at night
Sleep Disorders - People that has trouble sleeping (%)
Smoking-Cigarette Use - People smoking cigarettes (%)
Taste & Smell - People 40+ having problems with smell (%)
Taste & Smell - People 40+ having problems with taste (%)
Taste & Smell - People 40+ that ever had wisdom teeth removed (%)
Taste & Smell - People 40+ that ever had tonsils teeth removed (%)
Taste & Smell - People 40+ that ever had a loss of consciousness because of a head injury (%)
Taste & Smell - People 40+ that ever had a broken nose or other serious injury to face or skull (%)
Taste & Smell - People 40+ that ever had two or more sinus infections (%)
Weight - Average height (inches)
Weight - Average weight (pounds)
Weight - Average BMI
Weight - People that are obese (%)
Weight - People that ever were obese (%)
Weight - People trying to lose weight (%)
Urban population: 5,176
Rural population: 10,578
Estimated median house/condo value in 2022: $556,749
80018:
$556,749Colorado:
$531,100
According to our research of Colorado and other state lists, there were 27 registered sex offenders living in 80018 zip code as of June 16, 2024 . The ratio of all residents to sex offenders in zip code 80018 is 440 to 1.The ratio of registered sex offenders to all residents in this zip code is near the state average.
Median resident age: This zip code:
35.1 yearsColorado median age:
37.7 years
Average household size: This zip code:
2.9 peopleColorado:
2.4 people
Averages for the 2020 tax year for zip code 80018, filed in 2021:
Average Adjusted Gross Income (AGI) in 2020: $76,596 (Individual Income Tax Returns) Here:
$76,596State:
$89,260
Salary/wage: $70,938 (reported on 89.7% of returns )Here:
$70,938State:
$70,330
(% of AGI for various income ranges: 1265.7% for AGIs below $25k , 3914.9% for AGIs $25k-50k , 7067.0% for AGIs $50k-75k , 9897.1% for AGIs $75k-100k , 19452.3% for AGIs $100k-200k , 50754.6% for AGIs over 200k ) Taxable interest for individuals: $599 (reported on 22.0% of returns )This zip code:
$599Colorado:
$2,176
(% of AGI for various income ranges: 3.6% for AGIs below $25k , 8.1% for AGIs $25k-50k , 16.1% for AGIs $50k-75k , 17.2% for AGIs $75k-100k , 37.7% for AGIs $100k-200k , 129.2% for AGIs over 200k ) Ordinary dividends: $1,368 (reported on 13.8% of returns )(% of AGI for various income ranges: 6.9% for AGIs below $25k , 9.1% for AGIs $25k-50k , 18.7% for AGIs $50k-75k , 24.7% for AGIs $75k-100k , 49.9% for AGIs $100k-200k , 271.5% for AGIs over 200k ) Net capital gain/loss in AGI: +$11,168 (reported on 13.7% of returns )Here:
+$11,168State:
+$37,276
(% of AGI for various income ranges: 4.8% for AGIs below $25k , 19.4% for AGIs $25k-50k , 36.2% for AGIs $50k-75k , 50.8% for AGIs $75k-100k , 217.2% for AGIs $100k-200k , 7199.2% for AGIs over 200k ) Profit/loss from business: +$11,888 (reported on 18.8% of returns )Here:
+$11,888State:
+$15,295
(% of AGI for various income ranges: 169.2% for AGIs below $25k , 252.5% for AGIs $25k-50k , 302.1% for AGIs $50k-75k , 328.4% for AGIs $75k-100k , 483.6% for AGIs $100k-200k , 915.4% for AGIs over 200k ) Taxable individual retirement arrangement distribution: $17,132 (reported on 4.2% of returns )80018:
$17,132Colorado:
$23,785
(% of AGI for various income ranges: 15.9% for AGIs below $25k , 30.9% for AGIs $25k-50k , 80.0% for AGIs $50k-75k , 119.5% for AGIs $75k-100k , 285.3% for AGIs $100k-200k ) Total itemized deductions: $26,536 (reported on 17.0% of returns )Here:
$26,536State:
$35,141
(% of AGI for various income ranges: 42.0% for AGIs below $25k , 222.0% for AGIs $25k-50k , 524.7% for AGIs $50k-75k , 933.5% for AGIs $75k-100k , 1328.7% for AGIs $100k-200k , 3436.2% for AGIs over 200k ) Charity contributions: $5,565 (reported on 11.3% of returns )(% of AGI for various income ranges: 22.6% for AGIs $25k-50k , 39.9% for AGIs $50k-75k , 97.8% for AGIs $75k-100k , 218.6% for AGIs $100k-200k , 790.8% for AGIs over 200k ) Taxes paid: $7,568 (reported on 16.9% of returns )(% of AGI for various income ranges: 8.4% for AGIs below $25k , 49.0% for AGIs $25k-50k , 139.0% for AGIs $50k-75k , 261.4% for AGIs $75k-100k , 412.2% for AGIs $100k-200k , 895.4% for AGIs over 200k ) Earned income credit: $2,304 (reported on 10.1% of returns )(% of AGI for various income ranges: 79.4% for AGIs below $25k , 67.3% for AGIs $25k-50k , 1.2% for AGIs $50k-75k ) Percentage of individuals using paid preparers for their 2020 taxes: 94.0%(% for various income ranges: 91.0% for AGIs below $25k , 93.6% for AGIs $25k-50k , 94.7% for AGIs $50k-75k , 96.5% for AGIs $75k-100k , 94.6% for AGIs $100k-200k , 96.8% for AGIs over 200k )
Averages for the 2012 tax year for zip code 80018, filed in 2013:
Average Adjusted Gross Income (AGI) in 2012: $67,905 (Individual Income Tax Returns) Here:
$67,905State:
$69,103
Salary/wage: $64,062 (reported on 92.0% of returns )Here:
$64,062State:
$54,794
(% of AGI for various income ranges: 80.2% for AGIs below $25k , 86.6% for AGIs $25k-50k , 87.1% for AGIs $50k-75k , 89.9% for AGIs $75k-100k , 88.9% for AGIs $100k-200k , 72.5% for AGIs over 200k ) Taxable interest for individuals: $488 (reported on 28.7% of returns )This zip code:
$488Colorado:
$1,971
(% of AGI for various income ranges: 0.3% for AGIs below $25k , 0.2% for AGIs $25k-50k , 0.3% for AGIs $50k-75k , 0.2% for AGIs $75k-100k , 0.2% for AGIs $100k-200k , 0.2% for AGIs over 200k ) Ordinary dividends: $1,353 (reported on 15.1% of returns )(% of AGI for various income ranges: 0.8% for AGIs below $25k , 0.1% for AGIs $25k-50k , 0.4% for AGIs $50k-75k , 0.2% for AGIs $75k-100k , 0.2% for AGIs $100k-200k , 0.7% for AGIs over 200k ) Net capital gain/loss in AGI: +$1,061 (reported on 11.4% of returns )Here:
+$1,061State:
+$23,009
(% of AGI for various income ranges: 0.3% for AGIs $100k-200k , 1.3% for AGIs over 200k ) Profit/loss from business: +$10,415 (reported on 16.0% of returns )Here:
+$10,415State:
+$13,514
(% of AGI for various income ranges: 9.1% for AGIs below $25k , 4.2% for AGIs $25k-50k , 2.2% for AGIs $50k-75k , 2.0% for AGIs $75k-100k , 1.4% for AGIs $100k-200k , 3.4% for AGIs over 200k ) Taxable individual retirement arrangement distribution: $13,638 (reported on 5.3% of returns )80018:
$13,638Colorado:
$17,927
(% of AGI for various income ranges: 1.2% for AGIs below $25k , 0.9% for AGIs $25k-50k , 1.1% for AGIs $50k-75k , 1.3% for AGIs $75k-100k , 1.2% for AGIs $100k-200k ) Total itemized deductions: $21,279 (22% of AGI, reported on 51.4% of returns )Here:
$21,279State:
$24,621
Here:
22.0% of AGIState:
18.5% of AGI
(% of AGI for various income ranges: 9.5% for AGIs below $25k , 13.6% for AGIs $25k-50k , 18.0% for AGIs $50k-75k , 17.9% for AGIs $75k-100k , 16.7% for AGIs $100k-200k , 12.9% for AGIs over 200k ) Charity contributions: $2,543 (reported on 41.9% of returns )(% of AGI for various income ranges: 0.5% for AGIs below $25k , 1.1% for AGIs $25k-50k , 1.6% for AGIs $50k-75k , 1.6% for AGIs $75k-100k , 1.6% for AGIs $100k-200k , 2.3% for AGIs over 200k ) Taxes paid: $6,243 (reported on 51.2% of returns )(% of AGI for various income ranges: 1.5% for AGIs below $25k , 2.6% for AGIs $25k-50k , 4.8% for AGIs $50k-75k , 4.8% for AGIs $75k-100k , 5.4% for AGIs $100k-200k , 5.4% for AGIs over 200k ) Earned income credit: $2,233 (reported on 12.9% of returns )(% of AGI for various income ranges: 6.2% for AGIs below $25k , 1.3% for AGIs $25k-50k ) Percentage of individuals using paid preparers for their 2012 taxes: 45.4%(% for various income ranges: 43.7% for AGIs below $25k , 45.4% for AGIs $25k-50k , 47.4% for AGIs $50k-75k , 44.6% for AGIs $75k-100k , 44.8% for AGIs $100k-200k , 60.0% for AGIs over 200k )
Averages for the 2004 tax year for zip code 80018, filed in 2005:
Average Adjusted Gross Income (AGI) in 2004: $59,115 (Individual Income Tax Returns) Here:
$59,115State:
$55,014
Salary/wage: $54,530 (reported on 93.0% of returns )Here:
$54,530State:
$46,010
(% of AGI for various income ranges: 153.9% for AGIs below $10k , 84.2% for AGIs $10k-25k , 88.2% for AGIs $25k-50k , 92.0% for AGIs $50k-75k , 92.4% for AGIs $75k-100k , 74.7% for AGIs over 100k ) Taxable interest for individuals: $818 (reported on 39.6% of returns )This zip code:
$818Colorado:
$2,127
(% of AGI for various income ranges: 0.6% for AGIs below $10k , 0.8% for AGIs $10k-25k , 0.5% for AGIs $25k-50k , 0.3% for AGIs $50k-75k , 0.2% for AGIs $75k-100k , 0.9% for AGIs over 100k ) Taxable dividends: $783 (reported on 16.4% of returns )(% of AGI for various income ranges: 0.5% for AGIs $10k-25k , 0.2% for AGIs $25k-50k , 0.2% for AGIs $50k-75k , 0.2% for AGIs $75k-100k , 0.2% for AGIs over 100k ) Net capital gain/loss: +$7,747 (reported on 14.4% of returns )Here:
+$7,747State:
+$17,882
(% of AGI for various income ranges: 3.3% for AGIs below $10k , -0.4% for AGIs $10k-25k , 0.0% for AGIs $25k-50k , 0.3% for AGIs $50k-75k , -0.1% for AGIs $75k-100k , 5.6% for AGIs over 100k ) Profit/loss from business: +$6,969 (reported on 17.5% of returns )Here:
+$6,969State:
+$11,247
(% of AGI for various income ranges: 20.6% for AGIs below $10k , 6.0% for AGIs $10k-25k , 4.6% for AGIs $25k-50k , 1.0% for AGIs $50k-75k , 1.3% for AGIs $75k-100k , 1.3% for AGIs over 100k ) IRA payment deduction: $2,920 (reported on 2.1% of returns )80018:
$2,920Colorado:
$2,947
Total itemized deductions: $19,560 (25% of AGI, reported on 58.5% of returns )Here:
$19,560State:
$20,560
Here:
24.5% of AGIState:
21.4% of AGI
(% of AGI for various income ranges: 15.1% for AGIs below $10k , 16.4% for AGIs $10k-25k , 20.9% for AGIs $25k-50k , 21.3% for AGIs $50k-75k , 21.4% for AGIs $75k-100k , 16.3% for AGIs over 100k ) Charity contributions deductions: $2,140 (3% of AGI, reported on 50.0% of returns )Here:
2.6% of AGIState:
3.4% of AGI
(% of AGI for various income ranges: 1.1% for AGIs $10k-25k , 1.8% for AGIs $25k-50k , 1.7% for AGIs $50k-75k , 2.0% for AGIs $75k-100k , 1.9% for AGIs over 100k ) Total tax: $7,212 (reported on 83.7% of returns )(% of AGI for various income ranges: 5.0% for AGIs below $10k , 4.7% for AGIs $10k-25k , 6.5% for AGIs $25k-50k , 7.6% for AGIs $50k-75k , 9.5% for AGIs $75k-100k , 15.1% for AGIs over 100k ) Earned income credit: $1,671 (reported on 9.6% of returns )Percentage of individuals using paid preparers for their 2004 taxes: 52.0%(% for various income ranges: 44.6% for AGIs below $10k , 54.0% for AGIs $10k-25k , 51.1% for AGIs $25k-50k , 53.3% for AGIs $50k-75k , 51.1% for AGIs $75k-100k , 55.7% for AGIs over 100k )
Estimated median household income in 2022: This zip code:
$125,642Colorado:
$89,302
Nearest zip codes: 80013 ,
80016 ,
80017 ,
80019 ,
80011 ,
80015 .
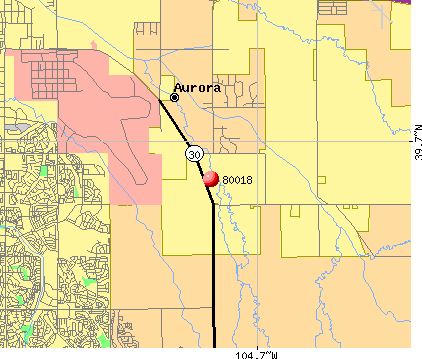
Aurora Zip Code Map
Percentage of family households: This zip code:
68.1%Colorado:
45.0%
Percentage of households with unmarried partners: This zip code:
3.6%Colorado:
48.0%
No gay or lesbian households reported
Household received Food Stamps/SNAP in the past 12 months: 327Household did not receive Food Stamps/SNAP in the past 12 months: 5,087
Women who had a birth in the past 12 months: 279 (243 now married , 38 unmarried) Women who did not have a birth in the past 12 months: 3,856 (2,358 now married , 1,479 unmarried)
Housing units in zip code 80018 with a mortgage: 3,929 (384
second mortgage , 335
both second mortgage and home equity loan )
Median monthly owner costs for units with a mortgage: $2,409
Median monthly owner costs for units without a mortgage: $715
Residents with income below the poverty level in 2022:
This zip code:
3.5%Whole state:
9.4%
Residents with income below 50% of the poverty level in 2022:
This zip code:
1.3%Whole state:
4.6%
Median number of rooms in houses and condos: Median number of rooms in apartments:
Year house built (houses)
334 2020 or later2,258 2010 to 20192,044 2000 to 2009618 1990 to 1999162 1980 to 1989190 1970 to 197974 1960 to 1969123 1950 to 19590 1940 to 19497 1939 or earlier
Zip code 80018 household income distribution in 2022 93 Less than $10,00075 $10,000 to $14,99948 $15,000 to $19,99928 $20,000 to $24,99961 $25,000 to $29,999140 $30,000 to $34,99912 $35,000 to $39,99951 $40,000 to $44,99981 $45,000 to $49,999171 $50,000 to $59,999495 $60,000 to $74,999760 $75,000 to $99,999759 $100,000 to $124,999967 $125,000 to $149,999925 $150,000 to $199,999762 $200,000 or moreEstimate of home value of owner-occupied houses/condos in 2022 in zip code 80018 87 Less than $10,0006 $25,000 to $29,9993 $35,000 to $39,99942 $40,000 to $49,99955 $50,000 to $59,99919 $60,000 to $69,99929 $70,000 to $79,99959 $80,000 to $89,99926 $100,000 to $124,9995 $200,000 to $249,99930 $250,000 to $299,999226 $300,000 to $399,9991,741 $400,000 to $499,9992,277 $500,000 to $749,99974 $750,000 to $999,99934 $1,000,000 to $1,499,999149 $2,000,000 or moreRent paid by renters in 2022 in zip code 80018 35 $750 to $79938 $1,000 to $1,249150 $1,250 to $1,49997 $1,500 to $1,999108 $2,000 to $2,499228 $2,500 to $2,99941 $3,000 to $3,4998 $3,500 or more8 No cash rent
Median gross rent in 2022: $2,216.
Median price asked for vacant for-sale houses and condos in 2022: $267,393.
Estimated median house (or condo) value in 2022 for: White Non-Hispanic householders: $823,168Black or African American householders: $827,437Asian householders: $800,539Two or more races householders: $615,668Hispanic or Latino householders: $800,539Estimated median house or condo value in 2022: $556,749
80018:
$556,749Colorado:
$531,100
Lower value quartile - upper value quartile: $485,937 - $678,020
Mean price in 2022: Detached houses: $614,512Here:
$614,512State:
$676,667
Townhouses or other attached units: $439,436Here:
$439,436State:
$526,340
In 2-unit structures: $500,398Here:
$500,398State:
$431,509
In 3-to-4-unit structures: $359,248Here:
$359,248State:
$385,502
In 5-or-more-unit structures: $209,301Here:
$209,301State:
$417,586
Mobile homes: $95,804Here:
$95,804State:
$115,510
Occupied boats, RVs, vans, etc.: $16,219Here:
$16,219State:
$70,094
Housing units in structures:
One, detached: 4,933One, attached: 1503 or 4: 75 to 9: 2920 to 49: 96Mobile homes: 281Unemployment : 2.3%
Means of transportation to work in zip code 80018 67.2% 6,068 Drove a car alone10.5% 947 Carpooled0.1% 8 Bus or trolley bus0.1% 6 Streetcar or trolley car0.0% 3 Subway or elevated0.3% 26 Motorcycle1.0% 89 Bicycle0.9% 82 Walked0.1% 8 Other means19.8% 1,791 Worked at homeTravel time to work (commute) in zip code 80018 20 Less than 5 minutes113 5 to 9 minutes296 10 to 14 minutes852 15 to 19 minutes1,403 20 to 24 minutes660 25 to 29 minutes1,425 30 to 34 minutes436 35 to 39 minutes678 40 to 44 minutes1,002 45 to 59 minutes227 60 to 89 minutes94 90 or more minutes
Neighborhoods in zip code 80018: Percentage of zip code residents living and working in this county: 56.6%
Household type by relationship:
Households: 15,755
Male householders: 3,063 (383 living alone ), Female householders: 2,360 (301 living alone )3,702 spouses (3,526 opposite-sex spouses ), 157 unmarried partners , (147 opposite-sex unmarried partners ), 5,117 children (4,642 natural , 115 adopted , 363 stepchildren ), 327 grandchildren , 10 brothers or sisters , 365 parents , 0 foster children , 210 other relatives , 354 non-relatives
Size of family households: 1,779 2-persons , 1,203 3-persons , 849 4-persons , 400 5-persons , 167 6-persons , 59 7-or-more-persons
Size of nonfamily households: 684 1-person , 162 2-persons , 43 3-persons
3,222 married couples with children. single-parent households (276 men , 404 women ).
76.5% of residents of 80018 zip code speak English at home. of residents speak Spanish at home (66% very well, 25% well, 7% not well, 1% not at all ).of residents speak other Indo-European language at home (77% very well, 6% well, 16% not well ).of residents speak Asian or Pacific Island language at home (58% very well, 19% well, 19% not well, 4% not at all ).of residents speak other language at home (68% very well, 21% well, 9% not well, 2% not at all ).
Foreign born population: 2,282 (14.5%)
(57.1%
of them are naturalized citizens )
This zip code:
14.5%Whole state:
9.5%
28% Honduras 10% Malaysia 7% Thailand 6% Mexico 5% Lithuania 5% Cabo Verde 4% France 9% German 5% English 4% American 4% Irish 3% African 2% Norwegian 2% European
Year of entry for the foreign-born population
1,019 2010 or later 502 2000 to 2009 563 1990 to 1999 641 Before 1990
There are
9 Medical Specialists in Zip Code 80018 .
Facilities with environmental interests located in this zip code:
FOXRIDGE FARMS MH COMMUNITY (26900 EAST COLFAX AVENUE in AURORA, CO)
STATE MASTER (Colorado database) - NPDES-CO0028908, NPDES NON-MAJOR National Pollutant Discharge Elimination System NON-MAJOR (Tracking pollutant discharge elimination systems) - permit COMMUNITY WATER SYSTEM (SDWIS) - SDWIS-CO0103050 2T, WATER TREATMENT PLANT, SDWIS-CO0103050 3T, SDWIS-CO0103050 4T, Business SIC classification: SEWERAGE SYSTEMSAlternative names: COLORADO REAL ESTATE & INVESTM, FOXRIDGE FARMS MHP
AGGREGATE INDUSTRIES WCR INC GUN CLUB READY MIX PLANT (3100 SOUTH GUN CLUB ROAD in AURORA, CO)
AIR MINOR (AIRS/AFS) AIR SYNTHETIC MINOR (AIRS/AFS) CRITERIA AND HAZARDOUS AIR POLLUTANT INVENTORY (Inventory of air pollution sources) TRI REPORTER (Tracking of toxic chemicals releasing facilities) Business SIC classification: CONSTRUCTION SAND AND GRAVEL; ASPHALT PAVING MIXTURES AND BLOCKS; READY-MIXED CONCRETE; BRICK, STONE, AND RELATED CONSTRUCTION MATERIALSAlternative names: AGGREGATE INDUSTRIES WCR INCORPORATED, CAMAS COLORADO INCORPORATED, GUN CLUB ASPHALT PLANT, GUN CLUB ASPHALT PLANT/RECYCLED MATERIALS COMPANY, RECYCLED MATERIALS
CENTEX HOMES (1245 SOUTH COOLIDGE CIRCLE in AURORA, CO)
National Pollutant Discharge Elimination System NON-MAJOR (Tracking pollutant discharge elimination systems) - permit Business SIC classification: GENERAL CONTRACTORS-RESIDENTIAL BUILDINGS, OTHER THAN SINGLE-FAMILY
FOUR C'S OIL INC. DBA PEORIA STANDARD (603 PEORIA in AURORA, CO)
Conditionally Exempt Small Quantity Generators, less than 100 kg/month of hazardous waste (Resource Conservation and Recovery Act (tracking hazardous waste)) - notification Organizations: AMOCO OIL CO (CONTACT/OWNER)
CENTEX HOMES (MISSISSIPPI AND SOUTH DEQUESNE STREET in AURORA, CO)
ENFORCEMENT/COMPLIANCE ACTIVITY (Integrated Compliance Information System)
67.6% Utility gas 27.8% Electricity 2.6% Bottled, tank, or LP gas 1.9% Solar energy
Population in 1990: 321. Population change in the 1990s: +2,327 (+724.9%).
Place of birth for U.S.-born residents:
This state: 6,910Northeast: 627Midwest: 2,109South: 1,733West: 1,685
31% of the 80018 zip code residents lived in the same house 5 years ago.
Out of people who lived in different houses, 35% lived in this county.
Out of people who lived in different counties, 50% lived in Colorado.
88% of the 80018 zip code residents lived in the same house 1 year ago.
Out of people who lived in different houses, 37% moved from this county.
Out of people who lived in different houses, 30% moved from different county within same state.
Out of people who lived in different houses, 32% moved from different state.
Out of people who lived in different houses, 1% moved from abroad.
Private vs. public school enrollment:
Students in private schools in grades 1 to 8 (elementary and middle school): 109
Students in private schools in grades 9 to 12 (high school): 30
Students in private undergraduate colleges: 119
Occupation by median earnings in the past 12 months ($)
112,693 Law enforcement workers including supervisors 93,747 Computer and mathematical occupations 92,348 Management occupations 90,024 Business and financial operations occupations 87,687 Architecture and engineering occupations 78,079 Health diagnosing and treating practitioners and other technical occupations
Top industries in this zip code by the number of employees in 2005:
Administrative and Support and Waste Management and Remediation Services: Solid Waste Landfill (50-99 employees: 1 establishment)Construction: Plumbing, Heating, and Air-Conditioning Contractors (20-49: 1, 10-19: 1, 1-4: 2)Information: Wired Telecommunications Carriers (20-49: 1, 1-4: 1)Arts, Entertainment, and Recreation: Fitness and Recreational Sports Centers (10-19: 1)Administrative and Support and Waste Management and Remediation Services: Landscaping Services (5-9: 1, 1-4: 2)Construction: Site Preparation Contractors (5-9: 1)Administrative and Support and Waste Management and Remediation Services: Janitorial Services (5-9: 1)Real Estate and Rental and Leasing: Lessors of Other Real Estate Property (5-9: 1)Construction: New Single-Family Housing Construction (except Operative Builders) (1-4: 2)
Fatal accident statistics in 2014:
Fatal accident count: 3Vehicles involved in fatal accidents: 10Fatal accidents caused by drunken drivers: 1Fatalities: 3Persons involved in fatal accidents: 11Pedestrians involved in fatal accidents: 1
Fatal accident statistics in 2011:
Fatal accident count: 1Vehicles involved in fatal accidents: 2Fatal accidents caused by drunken drivers: 0Fatalities: 2Persons involved in fatal accidents: 5Pedestrians involved in fatal accidents: 0
Home Mortgage Disclosure Act Aggregated Statistics For Year 2009(Based on 2 partial tracts) A) FHA, FSA/RHS & VA B) Conventional C) Refinancings D) Home Improvement Loans F) Non-occupant Loans on Number Average Value Number Average Value Number Average Value Number Average Value Number Average Value
LOANS ORIGINATED 310 $193,392 125 $164,480 593 $203,013 15 $42,129 36 $131,704 APPLICATIONS APPROVED, NOT ACCEPTED 20 $185,038 11 $173,376 62 $189,493 1 $7,570 6 $137,485 APPLICATIONS DENIED 46 $190,615 23 $155,802 195 $202,225 20 $46,619 12 $140,954 APPLICATIONS WITHDRAWN 23 $201,934 14 $164,280 145 $203,924 4 $131,115 8 $144,454 FILES CLOSED FOR INCOMPLETENESS 2 $265,260 5 $179,210 42 $197,074 1 $163,470 2 $141,145
Aggregated Statistics For Year 2008(Based on 2 partial tracts) A) FHA, FSA/RHS & VA B) Conventional C) Refinancings D) Home Improvement Loans E) Loans on Dwellings For 5+ Families F) Non-occupant Loans on G) Loans On Manufactured Number Average Value Number Average Value Number Average Value Number Average Value Number Average Value Number Average Value Number Average Value
LOANS ORIGINATED 251 $198,698 228 $180,308 281 $199,693 16 $47,252 1 $1,059,520 60 $156,405 0 $0 APPLICATIONS APPROVED, NOT ACCEPTED 17 $201,086 24 $177,942 54 $197,945 10 $24,520 0 $0 3 $176,083 1 $128,660 APPLICATIONS DENIED 45 $210,407 46 $188,624 241 $206,091 33 $56,462 0 $0 13 $126,909 1 $17,410 APPLICATIONS WITHDRAWN 25 $229,825 38 $184,799 112 $195,606 6 $60,165 0 $0 9 $176,923 0 $0 FILES CLOSED FOR INCOMPLETENESS 4 $148,142 6 $185,795 16 $218,195 2 $39,730 0 $0 2 $80,980 0 $0
Aggregated Statistics For Year 2007(Based on 2 partial tracts) A) FHA, FSA/RHS & VA B) Conventional C) Refinancings D) Home Improvement Loans F) Non-occupant Loans on G) Loans On Manufactured Number Average Value Number Average Value Number Average Value Number Average Value Number Average Value Number Average Value
LOANS ORIGINATED 76 $209,654 565 $171,299 372 $165,261 36 $60,229 71 $176,334 1 $16,650 APPLICATIONS APPROVED, NOT ACCEPTED 6 $166,622 67 $166,417 106 $163,719 21 $72,364 12 $144,928 0 $0 APPLICATIONS DENIED 11 $246,166 151 $178,911 429 $176,382 45 $56,171 41 $191,009 2 $16,270 APPLICATIONS WITHDRAWN 5 $227,040 79 $195,839 177 $180,550 10 $131,078 11 $223,600 0 $0 FILES CLOSED FOR INCOMPLETENESS 2 $152,875 15 $215,739 51 $191,174 0 $0 2 $252,015 0 $0
Aggregated Statistics For Year 2006(Based on 2 partial tracts) A) FHA, FSA/RHS & VA B) Conventional C) Refinancings D) Home Improvement Loans E) Loans on Dwellings For 5+ Families F) Non-occupant Loans on G) Loans On Manufactured Number Average Value Number Average Value Number Average Value Number Average Value Number Average Value Number Average Value Number Average Value
LOANS ORIGINATED 137 $199,337 1,153 $144,776 575 $147,140 62 $46,641 1 $101,410 176 $136,387 2 $21,570 APPLICATIONS APPROVED, NOT ACCEPTED 8 $197,051 162 $144,301 150 $159,342 20 $35,456 0 $0 44 $148,694 2 $34,055 APPLICATIONS DENIED 14 $206,066 239 $154,435 530 $164,754 71 $73,026 0 $0 64 $140,162 2 $37,460 APPLICATIONS WITHDRAWN 11 $209,771 170 $167,070 266 $177,791 14 $117,358 0 $0 30 $153,706 0 $0 FILES CLOSED FOR INCOMPLETENESS 0 $0 19 $139,729 62 $175,395 2 $98,005 0 $0 2 $199,795 0 $0
Aggregated Statistics For Year 2005(Based on 2 partial tracts) A) FHA, FSA/RHS & VA B) Conventional C) Refinancings D) Home Improvement Loans E) Loans on Dwellings For 5+ Families F) Non-occupant Loans on G) Loans On Manufactured Number Average Value Number Average Value Number Average Value Number Average Value Number Average Value Number Average Value Number Average Value
LOANS ORIGINATED 128 $202,450 1,235 $143,660 718 $150,948 50 $60,468 1 $147,580 154 $130,691 0 $0 APPLICATIONS APPROVED, NOT ACCEPTED 3 $251,007 127 $151,306 148 $147,351 13 $46,805 0 $0 17 $125,050 0 $0 APPLICATIONS DENIED 11 $215,964 217 $139,785 545 $175,660 76 $59,419 0 $0 41 $133,954 2 $124,495 APPLICATIONS WITHDRAWN 11 $206,537 204 $160,367 363 $179,224 14 $138,656 0 $0 36 $126,470 2 $134,710 FILES CLOSED FOR INCOMPLETENESS 2 $185,795 31 $140,594 58 $184,411 2 $55,245 0 $0 6 $136,980 0 $0
Aggregated Statistics For Year 2004(Based on 2 partial tracts) A) FHA, FSA/RHS & VA B) Conventional C) Refinancings D) Home Improvement Loans F) Non-occupant Loans on G) Loans On Manufactured Number Average Value Number Average Value Number Average Value Number Average Value Number Average Value Number Average Value
LOANS ORIGINATED 204 $198,289 763 $148,559 730 $167,748 45 $46,098 69 $144,022 5 $97,174 APPLICATIONS APPROVED, NOT ACCEPTED 6 $199,795 82 $166,718 148 $163,694 14 $56,706 11 $156,726 0 $0 APPLICATIONS DENIED 20 $195,216 135 $143,579 443 $178,538 55 $29,804 30 $146,819 2 $62,815 APPLICATIONS WITHDRAWN 26 $205,355 114 $148,844 257 $187,039 9 $69,878 11 $136,293 0 $0 FILES CLOSED FOR INCOMPLETENESS 6 $199,668 15 $142,934 62 $190,091 7 $48,976 3 $140,260 0 $0
Aggregated Statistics For Year 2003(Based on 2 partial tracts) A) FHA, FSA/RHS & VA B) Conventional C) Refinancings D) Home Improvement Loans F) Non-occupant Loans on Number Average Value Number Average Value Number Average Value Number Average Value Number Average Value
LOANS ORIGINATED 186 $196,251 258 $161,184 1,378 $164,737 39 $26,682 58 $142,683 APPLICATIONS APPROVED, NOT ACCEPTED 5 $154,690 36 $157,541 184 $157,818 5 $47,072 14 $148,116 APPLICATIONS DENIED 19 $212,621 51 $148,689 356 $167,391 48 $29,578 16 $132,582 APPLICATIONS WITHDRAWN 21 $217,021 32 $161,411 244 $175,785 7 $23,244 7 $157,199 FILES CLOSED FOR INCOMPLETENESS 2 $233,095 7 $169,523 43 $176,106 2 $62,060 2 $118,440
Aggregated Statistics For Year 2002(Based on 2 partial tracts) A) FHA, FSA/RHS & VA B) Conventional C) Refinancings D) Home Improvement Loans F) Non-occupant Loans on Number Average Value Number Average Value Number Average Value Number Average Value Number Average Value
LOANS ORIGINATED 295 $204,713 381 $173,909 948 $156,341 64 $26,736 32 $136,342 APPLICATIONS APPROVED, NOT ACCEPTED 7 $188,227 23 $180,546 120 $148,509 18 $19,803 2 $173,685 APPLICATIONS DENIED 26 $208,644 53 $156,315 272 $147,312 42 $15,532 6 $124,747 APPLICATIONS WITHDRAWN 36 $224,917 70 $184,248 187 $159,608 14 $22,542 8 $143,509 FILES CLOSED FOR INCOMPLETENESS 2 $244,445 5 $165,890 63 $159,312 2 $25,355 0 $0
Aggregated Statistics For Year 2001(Based on 2 partial tracts) A) FHA, FSA/RHS & VA B) Conventional C) Refinancings D) Home Improvement Loans F) Non-occupant Loans on Number Average Value Number Average Value Number Average Value Number Average Value Number Average Value
LOANS ORIGINATED 267 $179,801 347 $161,087 917 $147,447 69 $24,130 43 $139,216 APPLICATIONS APPROVED, NOT ACCEPTED 9 $170,028 22 $121,604 104 $130,060 17 $44,429 2 $119,575 APPLICATIONS DENIED 17 $192,183 38 $144,529 252 $111,436 45 $22,014 8 $104,628 APPLICATIONS WITHDRAWN 40 $186,324 61 $165,739 166 $144,576 14 $55,463 11 $123,977 FILES CLOSED FOR INCOMPLETENESS 1 $161,200 8 $155,428 43 $157,925 3 $49,950 1 $142,280
Aggregated Statistics For Year 2000(Based on 2 partial tracts) A) FHA, FSA/RHS & VA B) Conventional C) Refinancings D) Home Improvement Loans F) Non-occupant Loans on Number Average Value Number Average Value Number Average Value Number Average Value Number Average Value
LOANS ORIGINATED 264 $161,522 255 $137,993 160 $102,920 76 $23,969 24 $126,859 APPLICATIONS APPROVED, NOT ACCEPTED 2 $170,280 23 $80,385 37 $99,284 25 $27,941 4 $62,058 APPLICATIONS DENIED 21 $215,075 41 $124,577 109 $73,722 54 $22,129 3 $84,003 APPLICATIONS WITHDRAWN 25 $160,018 28 $142,792 55 $91,628 5 $37,688 4 $103,870 FILES CLOSED FOR INCOMPLETENESS 2 $138,495 5 $164,982 11 $126,936 2 $17,030 1 $149,090
Aggregated Statistics For Year 1999(Based on 1 partial tract) A) FHA, FSA/RHS & VA B) Conventional C) Refinancings D) Home Improvement Loans F) Non-occupant Loans on Number Average Value Number Average Value Number Average Value Number Average Value Number Average Value
LOANS ORIGINATED 99 $145,273 85 $126,550 108 $96,762 21 $21,454 5 $84,516 APPLICATIONS APPROVED, NOT ACCEPTED 1 $142,150 3 $112,377 24 $85,189 6 $18,320 1 $15,540 APPLICATIONS DENIED 12 $147,980 21 $123,474 56 $78,873 18 $22,743 2 $83,310 APPLICATIONS WITHDRAWN 16 $146,524 9 $148,584 26 $101,895 2 $43,890 1 $62,920 FILES CLOSED FOR INCOMPLETENESS 2 $138,270 4 $124,580 3 $103,573 2 $33,400 0 $0
Detailed HMDA statistics for the following Tracts:
0070.33
Private Mortgage Insurance Companies Aggregated Statistics For Year 2009(Based on 2 partial tracts) A) Conventional B) Refinancings C) Non-occupant Loans on Number Average Value Number Average Value Number Average Value
LOANS ORIGINATED 27 $216,109 23 $226,645 2 $160,440 APPLICATIONS APPROVED, NOT ACCEPTED 10 $220,532 14 $230,446 0 $0 APPLICATIONS DENIED 7 $149,954 6 $251,762 1 $69,630 APPLICATIONS WITHDRAWN 2 $245,205 2 $292,505 0 $0 FILES CLOSED FOR INCOMPLETENESS 2 $215,690 0 $0 0 $0
Aggregated Statistics For Year 2008(Based on 2 partial tracts) A) Conventional B) Refinancings C) Non-occupant Loans on Number Average Value Number Average Value Number Average Value
LOANS ORIGINATED 103 $209,450 31 $231,044 11 $159,754 APPLICATIONS APPROVED, NOT ACCEPTED 42 $230,824 19 $228,833 2 $161,575 APPLICATIONS DENIED 11 $188,375 5 $255,042 5 $175,274 APPLICATIONS WITHDRAWN 8 $202,822 4 $298,368 0 $0 FILES CLOSED FOR INCOMPLETENESS 4 $244,825 2 $150,980 3 $294,647
Aggregated Statistics For Year 2007(Based on 2 partial tracts) A) Conventional B) Refinancings C) Non-occupant Loans on Number Average Value Number Average Value Number Average Value
LOANS ORIGINATED 170 $220,118 56 $233,148 17 $209,144 APPLICATIONS APPROVED, NOT ACCEPTED 22 $227,900 12 $233,410 2 $80,220 APPLICATIONS DENIED 2 $203,200 5 $189,654 1 $262,610 APPLICATIONS WITHDRAWN 5 $246,414 5 $205,698 1 $161,960 FILES CLOSED FOR INCOMPLETENESS 3 $232,590 0 $0 2 $146,820
Aggregated Statistics For Year 2006(Based on 2 partial tracts) A) Conventional B) Refinancings C) Non-occupant Loans on Number Average Value Number Average Value Number Average Value
LOANS ORIGINATED 51 $199,454 36 $221,637 5 $194,800 APPLICATIONS APPROVED, NOT ACCEPTED 11 $243,484 11 $257,656 2 $152,495 APPLICATIONS DENIED 0 $0 1 $161,960 1 $161,960 APPLICATIONS WITHDRAWN 1 $124,870 2 $320,125 0 $0 FILES CLOSED FOR INCOMPLETENESS 0 $0 1 $647,060 0 $0
Aggregated Statistics For Year 2005(Based on 2 partial tracts) A) Conventional B) Refinancings C) Non-occupant Loans on Number Average Value Number Average Value Number Average Value
LOANS ORIGINATED 50 $227,312 35 $206,066 11 $193,259 APPLICATIONS APPROVED, NOT ACCEPTED 11 $256,899 8 $212,094 1 $122,600 APPLICATIONS DENIED 0 $0 1 $155,900 0 $0 APPLICATIONS WITHDRAWN 2 $236,120 2 $160,065 0 $0 FILES CLOSED FOR INCOMPLETENESS 1 $163,470 1 $146,820 2 $155,145
Aggregated Statistics For Year 2004(Based on 2 partial tracts) A) Conventional B) Refinancings C) Non-occupant Loans on Number Average Value Number Average Value Number Average Value
LOANS ORIGINATED 64 $224,533 64 $208,357 6 $201,813 APPLICATIONS APPROVED, NOT ACCEPTED 14 $225,526 22 $206,641 2 $118,060 APPLICATIONS DENIED 2 $186,175 2 $136,600 0 $0 APPLICATIONS WITHDRAWN 7 $249,096 11 $201,103 2 $127,900 FILES CLOSED FOR INCOMPLETENESS 1 $126,390 1 $156,660 0 $0
Aggregated Statistics For Year 2003(Based on 2 partial tracts) A) Conventional B) Refinancings C) Non-occupant Loans on Number Average Value Number Average Value Number Average Value
LOANS ORIGINATED 85 $217,513 204 $198,352 7 $175,686 APPLICATIONS APPROVED, NOT ACCEPTED 17 $215,822 48 $195,475 1 $143,040 APPLICATIONS DENIED 0 $0 4 $190,145 0 $0 APPLICATIONS WITHDRAWN 1 $155,140 17 $211,414 0 $0 FILES CLOSED FOR INCOMPLETENESS 0 $0 1 $148,330 0 $0
Aggregated Statistics For Year 2002(Based on 2 partial tracts) A) Conventional B) Refinancings C) Non-occupant Loans on Number Average Value Number Average Value Number Average Value
LOANS ORIGINATED 122 $205,831 148 $189,706 5 $189,200 APPLICATIONS APPROVED, NOT ACCEPTED 20 $216,104 33 $182,320 2 $182,765 APPLICATIONS DENIED 4 $194,498 3 $187,183 2 $231,200 APPLICATIONS WITHDRAWN 8 $220,324 18 $189,957 0 $0 FILES CLOSED FOR INCOMPLETENESS 0 $0 2 $160,065 0 $0
Aggregated Statistics For Year 2001(Based on 2 partial tracts) A) Conventional B) Refinancings C) Non-occupant Loans on Number Average Value Number Average Value Number Average Value
LOANS ORIGINATED 158 $185,253 162 $178,077 14 $130,656 APPLICATIONS APPROVED, NOT ACCEPTED 30 $180,648 23 $165,279 2 $95,355 APPLICATIONS DENIED 3 $178,857 9 $178,689 0 $0 APPLICATIONS WITHDRAWN 4 $166,685 8 $163,941 0 $0 FILES CLOSED FOR INCOMPLETENESS 1 $130,170 2 $149,090 0 $0
Aggregated Statistics For Year 2000(Based on 2 partial tracts) A) Conventional B) Refinancings C) Non-occupant Loans on Number Average Value Number Average Value Number Average Value
LOANS ORIGINATED 137 $164,723 23 $145,766 9 $143,792 APPLICATIONS APPROVED, NOT ACCEPTED 23 $157,480 5 $130,320 2 $79,085 APPLICATIONS DENIED 5 $138,646 2 $125,630 1 $114,280 APPLICATIONS WITHDRAWN 5 $141,976 1 $128,660 1 $149,090 FILES CLOSED FOR INCOMPLETENESS 0 $0 1 $123,360 0 $0
Aggregated Statistics For Year 1999(Based on 1 partial tract) A) Conventional B) Refinancings C) Non-occupant Loans on Number Average Value Number Average Value Number Average Value
LOANS ORIGINATED 41 $146,749 24 $134,225 1 $87,390 APPLICATIONS APPROVED, NOT ACCEPTED 3 $164,293 6 $146,557 0 $0 APPLICATIONS DENIED 1 $168,950 1 $153,420 0 $0 APPLICATIONS WITHDRAWN 1 $129,730 0 $0 0 $0 FILES CLOSED FOR INCOMPLETENESS 0 $0 0 $0 0 $0
Detailed PMIC statistics for the following Tracts:
0070.33
2002 - 2018 National Fire Incident Reporting System (NFIRS) incidents See full 2006 National Fire Incident Reporting System statistics for zip code 80018, Colorado
Most common first names in zip code 80018 among deceased individuals Name Count Lived (average)
John 4 67.2 years Mary 4 75.8 years Richard 4 66.7 years Robert 4 79.5 years Charles 3 75.0 years Lois 3 69.6 years Donald 2 62.0 years Carol 2 61.0 years Carolyn 2 81.0 years Martha 2 89.0 years
Most common last names in zip code 80018 among deceased individuals Last name Count Lived (average)
Smith 4 78.2 years Anderson 2 71.0 years Jones 2 43.6 years Brown 2 68.5 years Bethel 2 80.5 years Huffman 2 75.5 years Hendrick 2 50.0 years Knee 2 88.4 years Rushing 2 73.0 years Schmall 2 77.0 years


 Nearest zip codes: 80013, 80016, 80017, 80019, 80011, 80015.


 Based on the data from the years 2002 - 2018 the average number of fires per year is 24. The highest number of reported fires - 61 took place in 2017, and the least - 2 in 2002. The data has a growing trend.
 When looking into fire subcategories, the most reports belonged to: Outside Fires (58.6%), and Mobile Property/Vehicle Fires (23.3%).