Estimated zip code population in 2022: 1,860 Zip code population in 2010: 1,403 Zip code population in 2000: 1,581
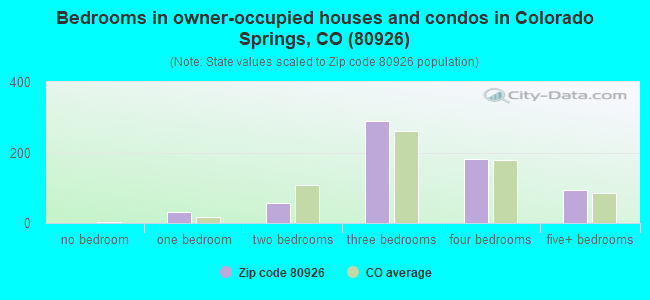
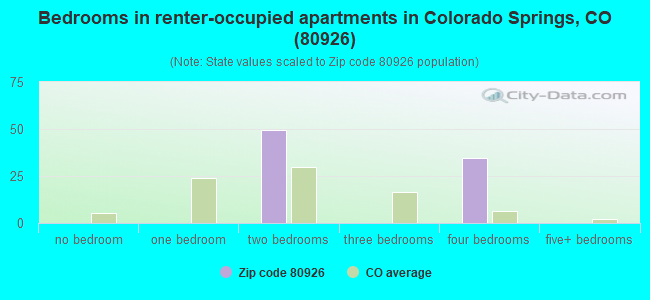
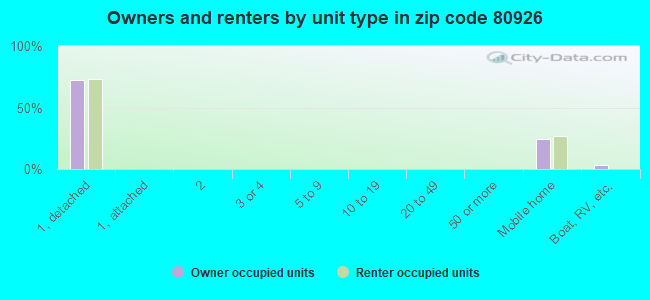
Houses and condos: 754 Renter-occupied apartments: 85
% of renters here:
12%
State:
34%
March 2022 cost of living index in zip code 80926: 91.4 (less than average, U.S. average is 100)
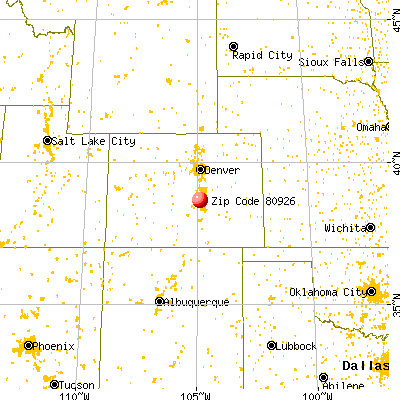
Land area: 64.7 sq. mi. Water area: 0.0 sq. mi.
Population density: 29 people per square mile
(very low).
OSM Map
General Map
Google Map
MSN Map
OSM Map
General Map
Google Map
MSN Map
OSM Map
General Map
Google Map
MSN Map
OSM Map
General Map
Google Map
MSN Map
Please wait while loading the map...
Real estate property taxes paid for housing units in 2022:
This zip code:
0.3% ($2,008)
Colorado:
0.5% ($2,422)
Median real estate property taxes paid for housing units with mortgages in 2022: $2,618 (0.6%) Median real estate property taxes paid for housing units with no mortgage in 2022: $1,265 (0.3%)
Business Search- 14 Million verified businesses
Males: 939
(50.5%)
Females: 920
(49.5%)
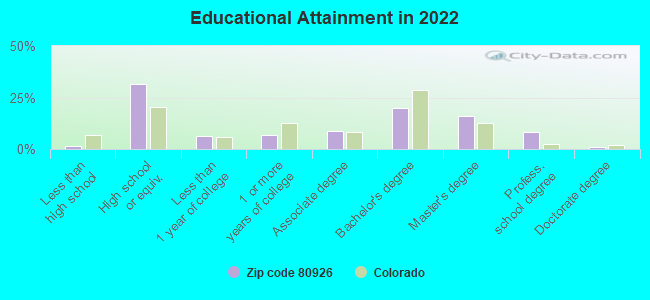
For population 25 years and over in 80926:
High school or higher: 98.5%
Bachelor's degree or higher: 45.0%
Graduate or professional degree: 25.2%
Unemployed: 7.1%
Mean travel time to work (commute): 22.4 minutes
For population 15 years and over in 80926:
Never married: 23.4%
Now married: 61.2%
Separated: 0.0%
Widowed: 3.0%
Divorced: 12.4%
Zip code 80926 compared to state average:
Unemployed percentage above state average.
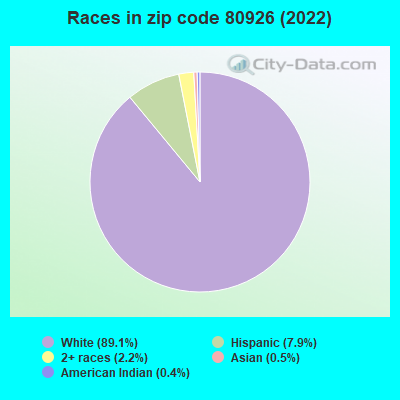
Black race population percentage significantly below state average.
Hispanic race population percentage below state average.
Median age above state average.
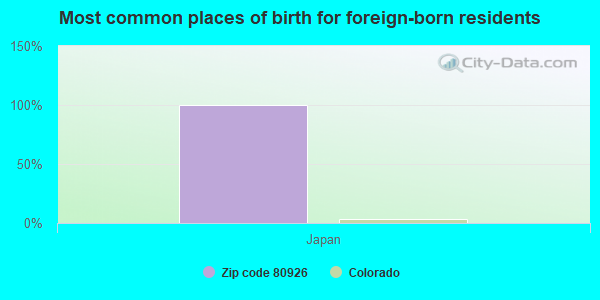
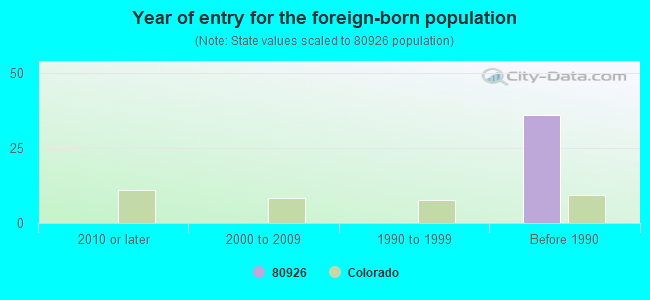
Foreign-born population percentage significantly below state average.
Renting percentage significantly below state average.
Length of stay since moving in above state average.
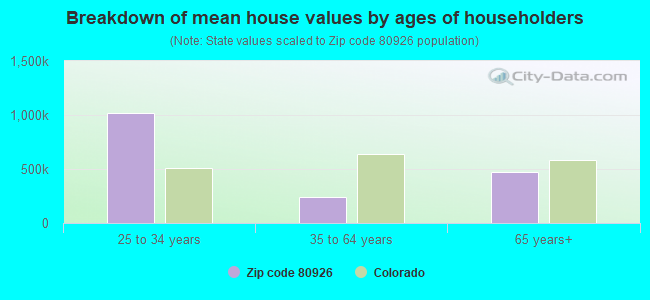
Estimated median house/condo value in 2022: $608,730
80926:
$608,730
Colorado:
$531,100
According to our research of Colorado and other state lists, there were 4 registered sex offenders living in 80926 zip code as of June 16, 2024. The ratio of all residents to sex offenders in zip code 80926 is 402 to 1. The ratio of registered sex offenders to all residents in this zip code is near the state average.
Median resident age:
This zip code:
44.2 years
Colorado median age:
37.7 years
Average household size:
This zip code:
2.5 people
Colorado:
2.4 people
Averages for the 2020 tax year for zip code 80926, filed in 2021:
Average Adjusted Gross Income (AGI) in 2020: $82,690 (Individual Income Tax Returns)
Here:
$82,690
State:
$89,260
Salary/wage: $61,434 (reported on 77.2% of returns)
Here:
$61,434
State:
$70,330
(% of AGI for various income ranges: 1200.6% for AGIs below $25k, 3422.9% for AGIs $25k-50k, 6570.0% for AGIs $50k-75k, 10274.0% for AGIs $75k-100k, 15261.4% for AGIs $100k-200k)
Taxable interest for individuals: $1,079 (reported on 35.4% of returns)
This zip code:
$1,079
Colorado:
$2,176
(% of AGI for various income ranges: 8.1% for AGIs below $25k, 24.3% for AGIs $25k-50k, 45.0% for AGIs $50k-75k, 36.0% for AGIs $75k-100k, 135.7% for AGIs $100k-200k)
Ordinary dividends: $4,382 (reported on 21.5% of returns)
Here:
$4,382
State:
$8,820
(% of AGI for various income ranges: 38.8% for AGIs below $25k, 118.3% for AGIs $50k-75k, 92.0% for AGIs $75k-100k, 294.3% for AGIs $100k-200k)
Net capital gain/loss in AGI: +$14,953 (reported on 21.5% of returns)
Here:
+$14,953
State:
+$37,276
(% of AGI for various income ranges: 25.7% for AGIs $25k-50k, 378.0% for AGIs $75k-100k, 994.3% for AGIs $100k-200k)
Profit/loss from business: +$11,473 (reported on 19.0% of returns)
Here:
+$11,473
State:
+$15,295
(% of AGI for various income ranges: 227.5% for AGIs below $25k, 224.3% for AGIs $25k-50k, 155.0% for AGIs $50k-75k, 1357.1% for AGIs $100k-200k)
Taxable individual retirement arrangement distribution: $22,586 (reported on 8.9% of returns)
80926:
$22,586
Colorado:
$23,785
(% of AGI for various income ranges: 1116.7% for AGIs $50k-75k, 1301.4% for AGIs $100k-200k)
Total itemized deductions: $30,000 (reported on 12.7% of returns)
Here:
$30,000
State:
$35,141
(% of AGI for various income ranges: 1245.0% for AGIs $50k-75k, 1800.0% for AGIs $100k-200k)
Charity contributions: $9,200 (reported on 10.1% of returns)
Here:
$9,200
State:
$12,103
(% of AGI for various income ranges: 642.9% for AGIs $100k-200k)
Taxes paid: $7,150 (reported on 12.7% of returns)
80926:
$7,150
State:
$7,710
(% of AGI for various income ranges: 190.0% for AGIs $50k-75k, 458.6% for AGIs $100k-200k)
Earned income credit: $2,008 (reported on 16.5% of returns)
Here:
$2,008
State:
$2,053
(% of AGI for various income ranges: 96.2% for AGIs below $25k, 76.4% for AGIs $25k-50k)
Percentage of individuals using paid preparers for their 2020 taxes: 92.4%
Here:
92%
State:
93%
(% for various income ranges: 91.7% for AGIs below $25k, 94.7% for AGIs $25k-50k, 90.0% for AGIs $50k-75k, 100.0% for AGIs $75k-100k, 91.7% for AGIs $100k-200k, 83.3% for AGIs over 200k)
Averages for the 2012 tax year for zip code 80926, filed in 2013:
Average Adjusted Gross Income (AGI) in 2012: $66,655 (Individual Income Tax Returns)
Here:
$66,655
State:
$69,103
Salary/wage: $49,977 (reported on 83.9% of returns)
Here:
$49,977
State:
$54,794
(% of AGI for various income ranges: 68.1% for AGIs below $25k, 75.5% for AGIs $25k-50k, 65.5% for AGIs $50k-75k, 66.1% for AGIs $75k-100k, 60.4% for AGIs $100k-200k, 56.5% for AGIs over 200k)
Taxable interest for individuals: $1,800 (reported on 43.5% of returns)
This zip code:
$1,800
Colorado:
$1,971
(% of AGI for various income ranges: 2.5% for AGIs below $25k, 0.3% for AGIs $25k-50k, 0.3% for AGIs $50k-75k, 4.0% for AGIs $75k-100k, 0.8% for AGIs $100k-200k, 0.7% for AGIs over 200k)
Ordinary dividends: $6,108 (reported on 19.4% of returns)
Here:
$6,108
State:
$7,140
(% of AGI for various income ranges: 2.6% for AGIs below $25k, 3.6% for AGIs $50k-75k, 4.3% for AGIs $100k-200k)
Net capital gain/loss in AGI: +$4,720 (reported on 16.1% of returns)
Here:
+$4,720
State:
+$23,009
(% of AGI for various income ranges: 3.2% for AGIs $100k-200k, 0.8% for AGIs over 200k)
Profit/loss from business: +$7,331 (reported on 21.0% of returns)
Here:
+$7,331
State:
+$13,514
(% of AGI for various income ranges: 8.6% for AGIs below $25k, 5.0% for AGIs $25k-50k, 1.3% for AGIs $50k-75k, 3.4% for AGIs $100k-200k)
Taxable individual retirement arrangement distribution: $15,629 (reported on 11.3% of returns)
80926:
$15,629
Colorado:
$17,927
Total itemized deductions: $25,938 (20% of AGI, reported on 33.9% of returns)
Here:
$25,938
State:
$24,621
Here:
20.1% of AGI
State:
18.5% of AGI
(% of AGI for various income ranges: 12.6% for AGIs $25k-50k, 15.5% for AGIs $50k-75k, 12.3% for AGIs $75k-100k, 15.5% for AGIs $100k-200k, 13.8% for AGIs over 200k)
Charity contributions: $4,856 (reported on 29.0% of returns)
Here:
$4,856
State:
$4,449
(% of AGI for various income ranges: 1.3% for AGIs $25k-50k, 1.8% for AGIs $50k-75k, 0.9% for AGIs $75k-100k, 3.0% for AGIs $100k-200k, 2.7% for AGIs over 200k)
Taxes paid: $6,838 (reported on 33.9% of returns)
80926:
$6,838
State:
$7,641
(% of AGI for various income ranges: 1.7% for AGIs $25k-50k, 2.8% for AGIs $50k-75k, 3.2% for AGIs $75k-100k, 3.7% for AGIs $100k-200k, 5.2% for AGIs over 200k)
Earned income credit: $2,269 (reported on 21.0% of returns)
Here:
$2,269
State:
$2,095
(% of AGI for various income ranges: 7.1% for AGIs below $25k, 1.9% for AGIs $25k-50k)
Percentage of individuals using paid preparers for their 2012 taxes: 51.6%
Here:
52%
State:
49%
(% for various income ranges: 40.9% for AGIs below $25k, 40.0% for AGIs $25k-50k, 57.1% for AGIs $50k-75k, 66.7% for AGIs $75k-100k, 66.7% for AGIs $100k-200k, 100.0% for AGIs over 200k)
Averages for the 2004 tax year for zip code 80926, filed in 2005:
Average Adjusted Gross Income (AGI) in 2004: $59,068 (Individual Income Tax Returns)
Here:
$59,068
State:
$55,014
Salary/wage: $42,816 (reported on 84.4% of returns)
Here:
$42,816
State:
$46,010
(% of AGI for various income ranges: 117.2% for AGIs below $10k, 78.2% for AGIs $10k-25k, 79.9% for AGIs $25k-50k, 66.9% for AGIs $50k-75k, 76.2% for AGIs $75k-100k, 45.3% for AGIs over 100k)
Taxable interest for individuals: $2,053 (reported on 44.5% of returns)
This zip code:
$2,053
Colorado:
$2,127
(% of AGI for various income ranges: 4.6% for AGIs below $10k, 1.0% for AGIs $10k-25k, 2.1% for AGIs $25k-50k, 2.0% for AGIs $50k-75k, 0.9% for AGIs $75k-100k, 1.4% for AGIs over 100k)
Taxable dividends: $3,568 (reported on 24.7% of returns)
Here:
$3,568
State:
$3,782
(% of AGI for various income ranges: 8.9% for AGIs below $10k, 0.7% for AGIs $10k-25k, 0.6% for AGIs $25k-50k, 0.6% for AGIs $50k-75k, 0.5% for AGIs $75k-100k, 2.3% for AGIs over 100k)
Net capital gain/loss: +$20,257 (reported on 23.0% of returns)
Here:
+$20,257
State:
+$17,882
(% of AGI for various income ranges: -1.2% for AGIs $10k-25k, 0.5% for AGIs $25k-50k, -0.3% for AGIs $50k-75k, 1.2% for AGIs $75k-100k, 16.3% for AGIs over 100k)
Profit/loss from business: +$8,876 (reported on 19.1% of returns)
Here:
+$8,876
State:
+$11,247
(% of AGI for various income ranges: -19.4% for AGIs below $10k, 3.7% for AGIs $10k-25k, -0.6% for AGIs $25k-50k, 8.9% for AGIs $50k-75k, 3.4% for AGIs over 100k)
Total itemized deductions: $23,709 (20% of AGI, reported on 33.2% of returns)
Here:
$23,709
State:
$20,560
Here:
19.8% of AGI
State:
21.4% of AGI
(% of AGI for various income ranges: 10.2% for AGIs $10k-25k, 10.7% for AGIs $25k-50k, 15.1% for AGIs $50k-75k, 19.9% for AGIs $75k-100k, 12.5% for AGIs over 100k)
Charity contributions deductions: $3,628 (3% of AGI, reported on 29.1% of returns)
Here:
$3,628
State:
$3,518
Here:
2.9% of AGI
State:
3.4% of AGI
(% of AGI for various income ranges: 1.1% for AGIs $10k-25k, 1.4% for AGIs $25k-50k, 1.1% for AGIs $50k-75k, 3.0% for AGIs $75k-100k, 1.9% for AGIs over 100k)
Total tax: $9,985 (reported on 76.6% of returns)
80926:
$9,985
State:
$9,173
(% of AGI for various income ranges: 2.8% for AGIs below $10k, 3.9% for AGIs $10k-25k, 6.4% for AGIs $25k-50k, 9.1% for AGIs $50k-75k, 10.9% for AGIs $75k-100k, 18.4% for AGIs over 100k)
Earned income credit: $1,951 (reported on 13.9% of returns)
Here:
$1,951
State:
$1,595
Percentage of individuals using paid preparers for their 2004 taxes: 59.1%
Here:
59%
State:
55%
(% for various income ranges: 48.5% for AGIs below $10k, 57.4% for AGIs $10k-25k, 61.3% for AGIs $25k-50k, 61.4% for AGIs $50k-75k, 56.4% for AGIs $75k-100k, 71.9% for AGIs over 100k)
Household received Food Stamps/SNAP in the past 12 months: 80 Household did not receive Food Stamps/SNAP in the past 12 months: 658
Women who did not have a birth in the past 12 months: 338 (190 now married, 146 unmarried)
Housing units in zip code 80926 with a mortgage: 348 (20 second mortgage, 21 both second mortgage and home equity loan) Median monthly owner costs for units with a mortgage: $2,314 Median monthly owner costs for units without a mortgage: $779
Residents with income below the poverty level in 2022:
This zip code:
6.1%
Whole state:
9.4%
Median number of rooms in houses and condos:
Here:
7.4
State:
6.8
Median number of rooms in apartments:
Here:
4.5
State:
4.0
Notable locations in this zip code not listed on our city pages
Notable locations in zip code 80926: J L Ranch (A), Louisiana State University Camp (B), Hitch Rack Ranch (C), Clark Ranch (D), Pinehurst Ranch (E), Fords Mountaindale Ranch (F), Turkey Canyon Ranch (G), Cheyenne Mountain NORAD Air Force Station Fire Department (H), Southwest Highway 115 Fire Protection District (I). Display/hide their locations on the map
Size of family households: 248 2-persons, 165 3-persons, 86 4-persons, 79 5-persons
Size of nonfamily households: 122 1-person, 25 2-persons
340 married couples with children.
70 single-parent households (70 men).
98.7% of residents of 80926 zip code speak English at home.
1.4% of residents speak Spanish at home (100% very well).
0.5% of residents speak Asian or Pacific Island language at home (100% very well).
Foreign born population: 9 (0.5%) (100.0% of them are naturalized citizens)
Facilities with environmental interests located in this zip code:
BROADMOOR PARK PROPERTIES (81160 PIUT ROAD in COLORADO SPRINGS, CO)
National Pollutant Discharge Elimination System NON-MAJOR (Tracking pollutant discharge elimination systems) - permit Business SIC classification: SEWERAGE SYSTEMS
Housing units lacking complete plumbing facilities: 3.2% Housing units lacking complete kitchen facilities: 3.3%
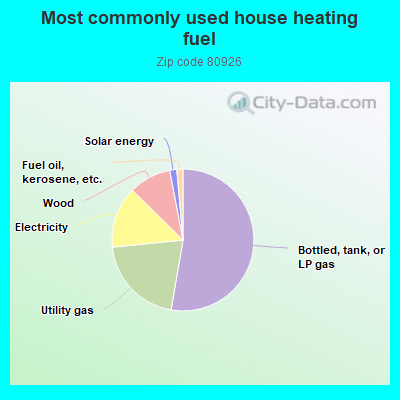
52.9%Bottled, tank, or LP gas
20.8%Utility gas
14.0%Electricity
9.7%Wood
1.6%Solar energy
1.4%Fuel oil, kerosene, etc.
Population in 1990: 1,040. Population change in the 1990s: +541 (+52.0%).
Place of birth for U.S.-born residents:
This state: 608
Northeast: 170
Midwest: 361
South: 418
West: 264
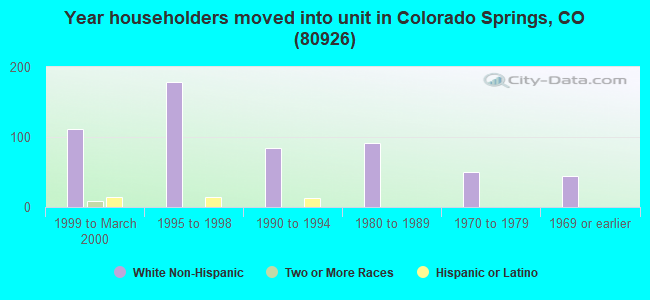
45% of the 80926 zip code residents lived in the same house 5 years ago. Out of people who lived in different houses, 56% lived in this county. Out of people who lived in different counties, 50% lived in Colorado.
96% of the 80926 zip code residents lived in the same house 1 year ago. Out of people who lived in different houses, 71% moved from this county. Out of people who lived in different houses, 40% moved from different state.
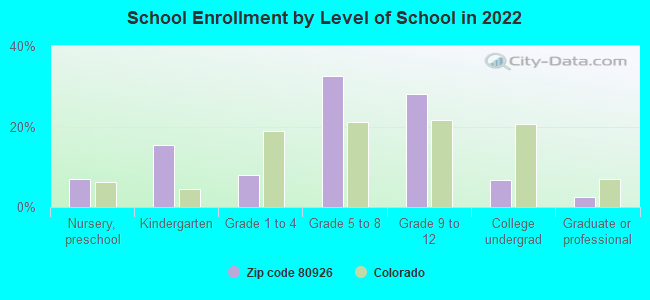
Private vs. public school enrollment:
Students in private schools in grades 1 to 8 (elementary and middle school):
Here:
0.0%
Colorado:
11.4%
Students in private schools in grades 9 to 12 (high school):
Here:
0.0%
Colorado:
8.5%
Students in private undergraduate colleges:
Here:
0.0%
Colorado:
14.0%
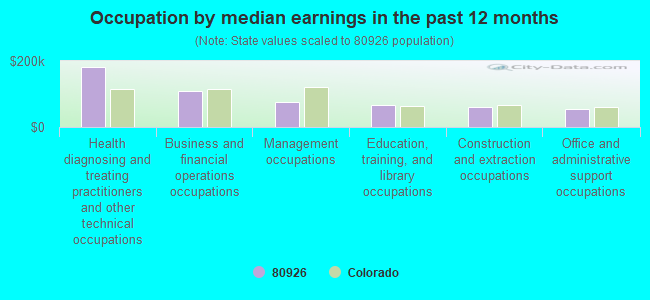
Occupation by median earnings in the past 12 months ($)
181,491Health diagnosing and treating practitioners and other technical occupations
108,287Business and financial operations occupations
76,214Management occupations
65,776Education, training, and library occupations
60,857Construction and extraction occupations
54,494Office and administrative support occupations
Companies with federal contracts located in this zip code:
EISENBERGER, MICHELLE (5660 SANDY CREEK HEIGHTS in COLORADO SPRIN, CO; small business) : $189,983 in 2 contractsin 2005
$189,983 with Army for Nursing Services. Signed on 2005-10-05. Completion date: 2006-09-30.
$0, same as above.Signed on 2005-10-05. Completion date: 2006-09-30.
RUSH GOLD WATER INC (2275 TWILIGHT CANYON TRL in COLORADO SPRIN, CO; small business) : $9,015 in 3 contractsfrom 2004 to 2006
$7,095 with Air Force for Water Services. Signed on 2004-10-01. Completion date: 2005-09-30.
$4,730, same as above.Signed on 2005-09-07. Completion date: 2005-09-30.
-$2,810, same as above.Signed on 2006-01-31. Completion date: 2005-09-30.
Top industries in this zip code by the number of employees in 2005:
Construction: All Other Specialty Trade Contractors (20-49 employees: 1 establishment)
Construction: Land Subdivision (5-9: 1)
Administrative and Support and Waste Management and Remediation Services: Septic Tank and Related Services (5-9: 1)
Real Estate and Rental and Leasing: Offices of Real Estate Agents and Brokers (1-4: 2)
Professional, Scientific, and Technical Services: Research and Development in the Physical, Engineering, and Life Sciences (1-4: 2)
Wholesale Trade: Industrial Machinery and Equipment Merchant Wholesalers (1-4: 1)
Construction: Plumbing, Heating, and Air-Conditioning Contractors (1-4: 1)
People in group quarters in 2000:
144 people in military barracks, etc.
Fatal accident statistics in 2014:
Fatal accident count: 1
Vehicles involved in fatal accidents: 1
Fatal accidents caused by drunken drivers: 1
Fatalities: 1
Persons involved in fatal accidents: 1
Pedestrians involved in fatal accidents: 0
Fatal accident statistics in 2013:
Fatal accident count: 1
Vehicles involved in fatal accidents: 1
Fatal accidents caused by drunken drivers: 0
Fatalities: 1
Persons involved in fatal accidents: 1
Pedestrians involved in fatal accidents: 1
Home Mortgage Disclosure Act Aggregated Statistics For Year 2009 (Based on 4 partial tracts)
A) FHA, FSA/RHS & VA Home Purchase Loans
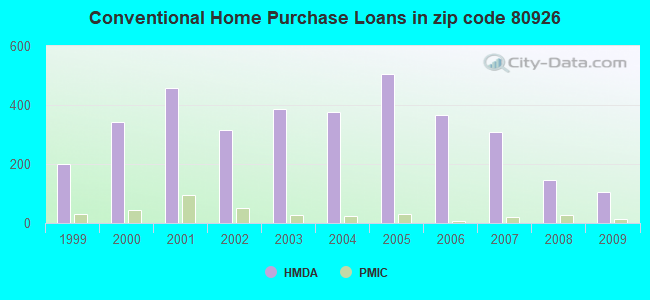
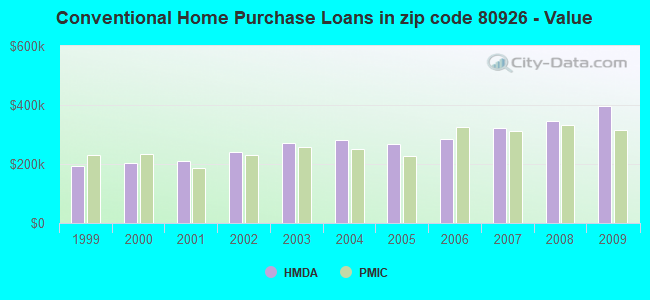
B) Conventional Home Purchase Loans
C) Refinancings
D) Home Improvement Loans
F) Non-occupant Loans on < 5 Family Dwellings (A B C & D)
G) Loans On Manufactured Home Dwelling (A B C & D)
Number
Average Value
Number
Average Value
Number
Average Value
Number
Average Value
Number
Average Value
Number
Average Value
LOANS ORIGINATED
64
$325,043
105
$397,564
627
$306,689
24
$153,405
47
$290,000
1
$183,910
APPLICATIONS APPROVED, NOT ACCEPTED
0
$0
12
$379,632
44
$390,650
5
$303,144
4
$195,925
0
$0
APPLICATIONS DENIED
2
$241,000
22
$484,843
114
$372,698
16
$55,749
11
$229,734
0
$0
APPLICATIONS WITHDRAWN
6
$324,740
12
$318,330
105
$340,468
2
$90,150
8
$260,291
0
$0
FILES CLOSED FOR INCOMPLETENESS
0
$0
2
$462,770
24
$363,405
1
$144,240
0
$0
0
$0
Aggregated Statistics For Year 2008 (Based on 4 partial tracts)
A) FHA, FSA/RHS & VA Home Purchase Loans
B) Conventional Home Purchase Loans
C) Refinancings
D) Home Improvement Loans
F) Non-occupant Loans on < 5 Family Dwellings (A B C & D)
G) Loans On Manufactured Home Dwelling (A B C & D)
Number
Average Value
Number
Average Value
Number
Average Value
Number
Average Value
Number
Average Value
Number
Average Value
LOANS ORIGINATED
31
$322,718
145
$346,392
249
$316,379
32
$65,584
26
$264,024
5
$87,986
APPLICATIONS APPROVED, NOT ACCEPTED
4
$264,440
27
$289,655
31
$269,132
0
$0
6
$345,175
4
$30,468
APPLICATIONS DENIED
4
$169,182
22
$340,227
81
$352,334
23
$73,499
8
$125,910
6
$26,443
APPLICATIONS WITHDRAWN
4
$239,198
18
$355,792
55
$320,825
5
$75,966
2
$416,495
0
$0
FILES CLOSED FOR INCOMPLETENESS
2
$201,935
2
$310,715
12
$458,062
1
$120,200
2
$99,165
0
$0
Aggregated Statistics For Year 2007 (Based on 4 partial tracts)
A) FHA, FSA/RHS & VA Home Purchase Loans
B) Conventional Home Purchase Loans
C) Refinancings
D) Home Improvement Loans
F) Non-occupant Loans on < 5 Family Dwellings (A B C & D)
G) Loans On Manufactured Home Dwelling (A B C & D)
Number
Average Value
Number
Average Value
Number
Average Value
Number
Average Value
Number
Average Value
Number
Average Value
LOANS ORIGINATED
31
$222,011
310
$321,563
296
$307,982
31
$95,459
66
$244,956
1
$39,670
APPLICATIONS APPROVED, NOT ACCEPTED
0
$0
32
$245,809
49
$295,226
5
$194,964
4
$98,262
4
$42,070
APPLICATIONS DENIED
5
$160,788
38
$503,385
124
$336,269
22
$100,918
7
$369,640
4
$53,490
APPLICATIONS WITHDRAWN
2
$362,405
37
$276,745
57
$304,073
7
$167,764
2
$203,140
0
$0
FILES CLOSED FOR INCOMPLETENESS
0
$0
6
$249,815
20
$340,586
2
$279,465
0
$0
0
$0
Aggregated Statistics For Year 2006 (Based on 4 partial tracts)
A) FHA, FSA/RHS & VA Home Purchase Loans
B) Conventional Home Purchase Loans
C) Refinancings
D) Home Improvement Loans
E) Loans on Dwellings For 5+ Families
F) Non-occupant Loans on < 5 Family Dwellings (A B C & D)
G) Loans On Manufactured Home Dwelling (A B C & D)
Number
Average Value
Number
Average Value
Number
Average Value
Number
Average Value
Number
Average Value
Number
Average Value
Number
Average Value
LOANS ORIGINATED
22
$272,417
367
$284,450
324
$291,675
60
$165,530
1
$10,036,700
83
$256,190
5
$104,850
APPLICATIONS APPROVED, NOT ACCEPTED
1
$369,010
47
$217,155
44
$424,907
18
$121,108
1
$12,020
11
$300,828
4
$24,040
APPLICATIONS DENIED
3
$148,467
40
$209,099
178
$317,658
41
$71,789
0
$0
10
$324,901
12
$69,352
APPLICATIONS WITHDRAWN
4
$198,930
56
$294,026
112
$319,231
14
$122,864
0
$0
14
$184,769
1
$733,220
FILES CLOSED FOR INCOMPLETENESS
0
$0
8
$205,241
22
$300,773
0
$0
0
$0
0
$0
0
$0
Aggregated Statistics For Year 2005 (Based on 4 partial tracts)
A) FHA, FSA/RHS & VA Home Purchase Loans
B) Conventional Home Purchase Loans
C) Refinancings
D) Home Improvement Loans
E) Loans on Dwellings For 5+ Families
F) Non-occupant Loans on < 5 Family Dwellings (A B C & D)
G) Loans On Manufactured Home Dwelling (A B C & D)
Number
Average Value
Number
Average Value
Number
Average Value
Number
Average Value
Number
Average Value
Number
Average Value
Number
Average Value
LOANS ORIGINATED
56
$232,676
505
$267,404
387
$300,325
41
$87,698
1
$275,260
80
$176,026
1
$49,280
APPLICATIONS APPROVED, NOT ACCEPTED
2
$308,315
54
$255,960
64
$287,595
11
$68,405
0
$0
8
$364,229
9
$48,400
APPLICATIONS DENIED
4
$177,455
121
$208,202
175
$313,329
25
$91,300
0
$0
31
$237,072
9
$41,051
APPLICATIONS WITHDRAWN
5
$173,898
102
$218,204
108
$289,448
16
$142,874
0
$0
22
$255,710
0
$0
FILES CLOSED FOR INCOMPLETENESS
2
$143,415
18
$174,243
43
$416,863
1
$601,000
0
$0
11
$408,824
0
$0
Aggregated Statistics For Year 2004 (Based on 4 partial tracts)
A) FHA, FSA/RHS & VA Home Purchase Loans
B) Conventional Home Purchase Loans
C) Refinancings
D) Home Improvement Loans
F) Non-occupant Loans on < 5 Family Dwellings (A B C & D)
G) Loans On Manufactured Home Dwelling (A B C & D)
Number
Average Value
Number
Average Value
Number
Average Value
Number
Average Value
Number
Average Value
Number
Average Value
LOANS ORIGINATED
19
$183,823
376
$282,265
395
$296,721
23
$123,283
58
$266,592
7
$41,727
APPLICATIONS APPROVED, NOT ACCEPTED
3
$89,370
50
$251,837
68
$297,816
8
$58,751
11
$148,191
4
$43,872
APPLICATIONS DENIED
8
$152,771
61
$256,681
140
$249,711
31
$39,212
15
$164,127
16
$42,644
APPLICATIONS WITHDRAWN
5
$193,508
63
$284,706
94
$283,470
6
$169,482
7
$315,236
0
$0
FILES CLOSED FOR INCOMPLETENESS
3
$148,190
6
$248,213
25
$369,826
0
$0
0
$0
0
$0
Aggregated Statistics For Year 2003 (Based on 4 partial tracts)
A) FHA, FSA/RHS & VA Home Purchase Loans
B) Conventional Home Purchase Loans
C) Refinancings
D) Home Improvement Loans
F) Non-occupant Loans on < 5 Family Dwellings (A B C & D)
Number
Average Value
Number
Average Value
Number
Average Value
Number
Average Value
Number
Average Value
LOANS ORIGINATED
19
$204,585
388
$270,807
1,323
$241,152
28
$35,244
73
$212,606
APPLICATIONS APPROVED, NOT ACCEPTED
0
$0
37
$243,052
115
$215,209
2
$48,080
7
$117,771
APPLICATIONS DENIED
1
$367,810
68
$176,560
173
$252,414
17
$69,725
9
$161,276
APPLICATIONS WITHDRAWN
2
$177,895
46
$251,845
179
$274,118
6
$79,532
14
$169,997
FILES CLOSED FOR INCOMPLETENESS
0
$0
5
$322,616
34
$286,462
2
$114,190
0
$0
Aggregated Statistics For Year 2002 (Based on 4 partial tracts)
A) FHA, FSA/RHS & VA Home Purchase Loans
B) Conventional Home Purchase Loans
C) Refinancings
D) Home Improvement Loans
E) Loans on Dwellings For 5+ Families
F) Non-occupant Loans on < 5 Family Dwellings (A B C & D)
Number
Average Value
Number
Average Value
Number
Average Value
Number
Average Value
Number
Average Value
Number
Average Value
LOANS ORIGINATED
22
$166,572
316
$242,366
850
$247,287
48
$53,714
0
$0
57
$194,985
APPLICATIONS APPROVED, NOT ACCEPTED
1
$210,350
31
$245,664
94
$187,741
4
$36,660
0
$0
6
$225,977
APPLICATIONS DENIED
5
$119,038
66
$184,787
127
$196,200
20
$39,602
0
$0
9
$177,370
APPLICATIONS WITHDRAWN
22
$123,353
43
$252,224
100
$266,952
8
$58,448
1
$721,200
7
$269,420
FILES CLOSED FOR INCOMPLETENESS
1
$247,610
10
$259,752
35
$185,657
1
$36,060
0
$0
4
$212,082
Aggregated Statistics For Year 2001 (Based on 4 partial tracts)
A) FHA, FSA/RHS & VA Home Purchase Loans
B) Conventional Home Purchase Loans
C) Refinancings
D) Home Improvement Loans
E) Loans on Dwellings For 5+ Families
F) Non-occupant Loans on < 5 Family Dwellings (A B C & D)
Number
Average Value
Number
Average Value
Number
Average Value
Number
Average Value
Number
Average Value
Number
Average Value
LOANS ORIGINATED
25
$157,445
456
$211,107
715
$225,549
58
$33,668
0
$0
36
$163,138
APPLICATIONS APPROVED, NOT ACCEPTED
7
$148,017
81
$174,013
73
$205,229
4
$13,388
0
$0
8
$213,355
APPLICATIONS DENIED
1
$106,980
171
$89,485
97
$194,762
8
$29,599
1
$300,500
12
$114,791
APPLICATIONS WITHDRAWN
4
$130,417
39
$148,223
99
$194,918
11
$56,604
0
$0
8
$198,030
FILES CLOSED FOR INCOMPLETENESS
0
$0
6
$142,437
27
$224,282
4
$59,800
0
$0
0
$0
Aggregated Statistics For Year 2000 (Based on 4 partial tracts)
A) FHA, FSA/RHS & VA Home Purchase Loans
B) Conventional Home Purchase Loans
C) Refinancings
D) Home Improvement Loans
E) Loans on Dwellings For 5+ Families
F) Non-occupant Loans on < 5 Family Dwellings (A B C & D)
Number
Average Value
Number
Average Value
Number
Average Value
Number
Average Value
Number
Average Value
Number
Average Value
LOANS ORIGINATED
13
$119,383
341
$202,782
147
$208,886
77
$31,112
1
$213,960
19
$167,521
APPLICATIONS APPROVED, NOT ACCEPTED
2
$23,600
55
$208,799
35
$172,161
6
$23,840
0
$0
4
$31,252
APPLICATIONS DENIED
3
$86,420
191
$88,151
79
$138,294
14
$69,894
0
$0
7
$38,464
APPLICATIONS WITHDRAWN
10
$108,060
38
$217,097
27
$233,153
10
$52,407
0
$0
1
$18,030
FILES CLOSED FOR INCOMPLETENESS
0
$0
5
$453,394
14
$194,896
0
$0
0
$0
0
$0
Aggregated Statistics For Year 1999 (Based on 2 partial tracts)
A) FHA, FSA/RHS & VA Home Purchase Loans
B) Conventional Home Purchase Loans
C) Refinancings
D) Home Improvement Loans
E) Loans on Dwellings For 5+ Families
F) Non-occupant Loans on < 5 Family Dwellings (A B C & D)
Detailed PMIC statistics for the following Tracts:0033.01
, 0044.00
2002 - 2018 National Fire Incident Reporting System (NFIRS) incidents
Based on the data from the years 2002 - 2018 the average number of fire incidents per year is 14. The highest number of reported fire incidents - 33 took place in 2014, and the least - 0 in 2003. The data has an increasing trend.
When looking into fire subcategories, the most incidents belonged to: Outside Fires (62.4%), and Structure Fires (17.7%).
Fire incident types reported to NFIRS in Zip Code 80926


 Nearest zip codes: 80902, 80906, 80913, 81240, 80905, 80829.


 Based on the data from the years 2002 - 2018 the average number of fire incidents per year is 14. The highest number of reported fire incidents - 33 took place in 2014, and the least - 0 in 2003. The data has an increasing trend.
 When looking into fire subcategories, the most incidents belonged to: Outside Fires (62.4%), and Structure Fires (17.7%).