Estimated zip code population in 2022: 724 Zip code population in 2010: 1,071 Zip code population in 2000: 1,109
Houses and condos: 534 Renter-occupied apartments: 52
% of renters here:
15%
State:
34%
March 2022 cost of living index in zip code 81025: 90.8 (less than average, U.S. average is 100)
Land area: 548.5 sq. mi. Water area: 1.5 sq. mi.
Population density: 1 people per square mile
(very low).
OSM Map
General Map
Google Map
MSN Map
OSM Map
General Map
Google Map
MSN Map
OSM Map
General Map
Google Map
MSN Map
OSM Map
General Map
Google Map
MSN Map
Please wait while loading the map...
Real estate property taxes paid for housing units in 2022:
This zip code:
0.6% ($784)
Colorado:
0.5% ($2,422)
Median real estate property taxes paid for housing units with mortgages in 2022: $931 (0.3%) Median real estate property taxes paid for housing units with no mortgage in 2022: $603 (0.2%)
Business Search- 14 Million verified businesses
Males: 363
(50.1%)
Females: 361
(49.9%)
For population 25 years and over in 81025:
High school or higher: 88.3%
Bachelor's degree or higher: 17.7%
Graduate or professional degree: 4.8%
Unemployed: 3.3%
Mean travel time to work (commute): 22.8 minutes
For population 15 years and over in 81025:
Never married: 24.1%
Now married: 44.2%
Separated: 4.7%
Widowed: 14.7%
Divorced: 12.3%
Zip code 81025 compared to state average:
Median household income below state average.
Median house value significantly below state average.
Black race population percentage significantly below state average.
Median age significantly above state average.
Foreign-born population percentage significantly below state average.
Renting percentage significantly below state average.
Length of stay since moving in significantly above state average.
House age above state average.
Number of college students below state average.
Percentage of population with a bachelor's degree or higher below state average.
Averages for the 2020 tax year for zip code 81025, filed in 2021:
Average Adjusted Gross Income (AGI) in 2020: $42,642 (Individual Income Tax Returns)
Here:
$42,642
State:
$89,260
Salary/wage: $38,100 (reported on 73.7% of returns)
Here:
$38,100
State:
$70,330
(% of AGI for various income ranges: 1355.0% for AGIs below $25k, 3662.5% for AGIs $25k-50k, 6010.0% for AGIs $50k-75k, 7320.0% for AGIs $75k-100k)
Taxable interest for individuals: $460 (reported on 26.3% of returns)
This zip code:
$460
Colorado:
$2,176
(% of AGI for various income ranges: 10.0% for AGIs below $25k, 32.5% for AGIs $25k-50k, 33.3% for AGIs $75k-100k)
Ordinary dividends: $1,067 (reported on 7.9% of returns)
Here:
$1,067
State:
$8,820
(% of AGI for various income ranges: 40.0% for AGIs $25k-50k)
Net capital gain/loss in AGI: +$4,525 (reported on 10.5% of returns)
Here:
+$4,525
State:
+$37,276
(% of AGI for various income ranges: 603.3% for AGIs $50k-75k)
Profit/loss from business: +$6,800 (reported on 13.2% of returns)
Here:
+$6,800
State:
+$15,295
(% of AGI for various income ranges: 340.0% for AGIs below $25k)
Earned income credit: $2,412 (reported on 21.1% of returns)
Here:
$2,412
State:
$2,053
(% of AGI for various income ranges: 111.0% for AGIs below $25k, 102.5% for AGIs $25k-50k)
Percentage of individuals using paid preparers for their 2020 taxes: 92.1%
Here:
92%
State:
93%
(% for various income ranges: 100.0% for AGIs below $25k, 90.9% for AGIs $25k-50k, 80.0% for AGIs $50k-75k, 75.0% for AGIs $75k-100k, 100.0% for AGIs $100k-200k)
Averages for the 2012 tax year for zip code 81025, filed in 2013:
Average Adjusted Gross Income (AGI) in 2012: $44,061 (Individual Income Tax Returns)
Here:
$44,061
State:
$69,103
Salary/wage: $34,134 (reported on 76.3% of returns)
Here:
$34,134
State:
$54,794
(% of AGI for various income ranges: 72.0% for AGIs below $25k, 70.7% for AGIs $25k-50k, 64.0% for AGIs $50k-75k, 75.8% for AGIs $75k-100k, 38.1% for AGIs $100k-200k)
Taxable interest for individuals: $664 (reported on 28.9% of returns)
This zip code:
$664
Colorado:
$1,971
(% of AGI for various income ranges: 0.6% for AGIs below $25k, 1.4% for AGIs $25k-50k, 0.2% for AGIs $75k-100k)
Ordinary dividends: $1,350 (reported on 5.3% of returns)
Here:
$1,350
State:
$7,140
Net capital gain/loss in AGI: +$13,567 (reported on 7.9% of returns)
Here:
+$13,567
State:
+$23,009
Profit/loss from business: +$3,660 (reported on 13.2% of returns)
Here:
+$3,660
State:
+$13,514
Taxable individual retirement arrangement distribution: $4,550 (reported on 5.3% of returns)
81025:
$4,550
Colorado:
$17,927
Total itemized deductions: $16,700 (22% of AGI, reported on 18.4% of returns)
Here:
$16,700
State:
$24,621
Here:
21.8% of AGI
State:
18.5% of AGI
Charity contributions: $1,525 (reported on 10.5% of returns)
Here:
$1,525
State:
$4,449
Taxes paid: $3,114 (reported on 18.4% of returns)
81025:
$3,114
State:
$7,641
Earned income credit: $2,400 (reported on 23.7% of returns)
Here:
$2,400
State:
$2,095
(% of AGI for various income ranges: 7.5% for AGIs below $25k, 1.2% for AGIs $25k-50k)
Percentage of individuals using paid preparers for their 2012 taxes: 55.3%
Here:
55%
State:
49%
(% for various income ranges: 47.1% for AGIs below $25k, 54.5% for AGIs $25k-50k, 100.0% for AGIs $50k-75k, 66.7% for AGIs $100k-200k)
Averages for the 2004 tax year for zip code 81025, filed in 2005:
Average Adjusted Gross Income (AGI) in 2004: $33,459 (Individual Income Tax Returns)
Here:
$33,459
State:
$55,014
Salary/wage: $30,929 (reported on 80.6% of returns)
Here:
$30,929
State:
$46,010
(% of AGI for various income ranges: 241.7% for AGIs below $10k, 71.6% for AGIs $10k-25k, 80.7% for AGIs $25k-50k, 81.5% for AGIs $50k-75k, 57.5% for AGIs $75k-100k)
Taxable interest for individuals: $764 (reported on 36.2% of returns)
This zip code:
$764
Colorado:
$2,127
(% of AGI for various income ranges: 1.6% for AGIs $10k-25k, 0.9% for AGIs $25k-50k, 0.6% for AGIs $50k-75k, 0.3% for AGIs $75k-100k)
Taxable dividends: $275 (reported on 11.4% of returns)
Here:
$275
State:
$3,782
Net capital gain/loss: +$1,763 (reported on 10.8% of returns)
Here:
+$1,763
State:
+$17,882
Profit/loss from business: +$2,512 (reported on 12.3% of returns)
Here:
+$2,512
State:
+$11,247
Total itemized deductions: $16,211 (30% of AGI, reported on 20.2% of returns)
Here:
$16,211
State:
$20,560
Here:
29.7% of AGI
State:
21.4% of AGI
Charity contributions deductions: $1,397 (3% of AGI, reported on 16.5% of returns)
Here:
$1,397
State:
$3,518
Here:
2.7% of AGI
State:
3.4% of AGI
Total tax: $3,538 (reported on 70.9% of returns)
81025:
$3,538
State:
$9,173
(% of AGI for various income ranges: 3.6% for AGIs $10k-25k, 6.1% for AGIs $25k-50k, 8.6% for AGIs $50k-75k, 11.9% for AGIs $75k-100k)
Earned income credit: $1,486 (reported on 20.5% of returns)
Here:
$1,486
State:
$1,595
Percentage of individuals using paid preparers for their 2004 taxes: 67.0%
Here:
67%
State:
55%
(% for various income ranges: 65.0% for AGIs below $10k, 63.7% for AGIs $10k-25k, 68.1% for AGIs $25k-50k, 72.1% for AGIs $50k-75k, 72.0% for AGIs $75k-100k)
Household received Food Stamps/SNAP in the past 12 months: 79 Household did not receive Food Stamps/SNAP in the past 12 months: 290
Women who had a birth in the past 12 months: 9 (9 now married, 0 unmarried) Women who did not have a birth in the past 12 months: 103 (20 now married, 83 unmarried)
Housing units in zip code 81025 with a mortgage: 120 (3 second mortgage, 1 both second mortgage and home equity loan) Houses without a mortgage: 33
Median monthly owner costs for units with a mortgage: $1,064 Median monthly owner costs for units without a mortgage: $331
Residents with income below the poverty level in 2022:
This zip code:
22.1%
Whole state:
9.4%
Residents with income below 50% of the poverty level in 2022:
This zip code:
16.0%
Whole state:
4.6%
Median number of rooms in houses and condos:
Here:
6.2
State:
6.8
Median number of rooms in apartments:
Here:
4.4
State:
4.0
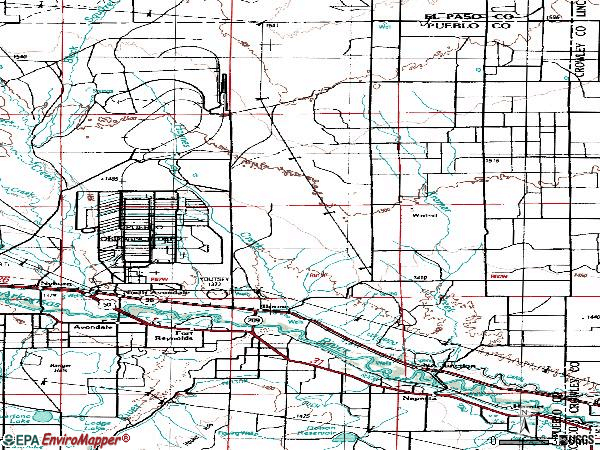
Notable locations in this zip code not listed on our city pages
Notable locations in zip code 81025: May Ranch (A), Bar J H Ranch (B), Appelt Senior Ranch (C), Pueblo Depot Chemical Activity Fire Department (D), Boone Volunteer Fire Department (E), Transportation Technology Center Emergency Services (F). Display/hide their locations on the map
Reservoirs: Tolle and Ditch Reservoir Number 1 (A), J N Holland Reservoir Number 2 (B), Thatcher Reservoir (C), Smith Reservoir (D). Display/hide their locations on the map
Rivers and creeks: Huerfano River (A), Boone Creek (B), Black Squirrel Creek (C), Dry Creek (D), Andy Creek (E), Burnt Creek (F), Haynes Creek (G), Kramer Creek (H). Display/hide their locations on the map
In group quarters: 16 (-1 institutionalized population)
Size of family households: 108 2-persons, 31 3-persons, 27 4-persons, 1 5-persons, 10 6-persons, 4 7-or-more-persons
Size of nonfamily households: 162 1-person, 19 2-persons
37 married couples with children.
11 single-parent households (11 women).
93.0% of residents of 81025 zip code speak English at home.
7.5% of residents speak Spanish at home (96% very well, 4% well).
Foreign born population: 0 (0.0%)
:
0.0%
Whole state:
9.5%
18%German
12%English
10%European
7%American
5%Irish
2%Dutch
2%Italian
Year of entry for the foreign-born population
02010 or later
02000 to 2009
01990 to 1999
6Before 1990
Facilities with environmental interests located in this zip code:
FUTURES ACADEMY (1516 ASBURY LANE in BOONE, CO)
(National Center for Education Statistics) - STATE ID-3279 Organizations: PUEBLO COUNTY RURAL 70 (SCHOOL DISTRICT)
Housing units lacking complete plumbing facilities: 18.1% Housing units lacking complete kitchen facilities: 16.0%
64.5%Utility gas
23.4%Bottled, tank, or LP gas
6.9%Fuel oil, kerosene, etc.
5.5%Wood
Population in 1990: 976. Population change in the 1990s: +133 (+13.6%).
Place of birth for U.S.-born residents:
This state: 448
Northeast: 39
Midwest: 51
South: 43
West: 133
61% of the 81025 zip code residents lived in the same house 5 years ago. Out of people who lived in different houses, 55% lived in this county. Out of people who lived in different counties, 50% lived in Colorado.
94% of the 81025 zip code residents lived in the same house 1 year ago. Out of people who lived in different houses, 61% moved from this county. Out of people who lived in different houses, 42% moved from different county within same state.
Private vs. public school enrollment:
Students in private schools in grades 1 to 8 (elementary and middle school): 4
Here:
19.0%
Colorado:
11.4%
Students in private schools in grades 9 to 12 (high school): 4
Here:
67.2%
Colorado:
8.5%
Students in private undergraduate colleges:
Here:
0.0%
Colorado:
14.0%
Occupation by median earnings in the past 12 months ($)
96,216Health technologists and technicians
53,053Office and administrative support occupations
45,314Management occupations
35,414Food preparation and serving related occupations
33,126Transportation occupations
22,928Healthcare support occupations
Companies with federal contracts located in this zip code:
SCHOLTZ, PAUL (58551 APPLE RD in BOONE, CO; small business)
$8,725 with Army for Saddlery, Harness, Whips, and Related Animal Furnishings. Signed on 2004-04-09. Completion date: 2004-05-14.
Top industries in this zip code by the number of employees in 2005:
Construction: New Single-Family Housing Construction (except Operative Builders) (10-19 employees: 1 establishment)
Wholesale Trade: Wholesale Trade Agents and Brokers (1-4: 1)
People in group quarters in 2010:
8 people in group homes intended for adults
People in group quarters in 2000:
17 people in agriculture workers' dormitories on farms
11 people in homes for the mentally retarded
Fatal accident statistics in 2012:
Fatal accident count: 2
Vehicles involved in fatal accidents: 5
Fatal accidents caused by drunken drivers: 0
Fatalities: 2
Persons involved in fatal accidents: 14
Pedestrians involved in fatal accidents: 0
Fatal accident statistics in 2011:
Fatal accident count: 1
Vehicles involved in fatal accidents: 1
Fatal accidents caused by drunken drivers: 1
Fatalities: 1
Persons involved in fatal accidents: 2
Pedestrians involved in fatal accidents: 0
Home Mortgage Disclosure Act Aggregated Statistics For Year 2009 (Based on 6 partial tracts)
A) FHA, FSA/RHS & VA Home Purchase Loans
B) Conventional Home Purchase Loans
C) Refinancings
D) Home Improvement Loans
F) Non-occupant Loans on < 5 Family Dwellings (A B C & D)
G) Loans On Manufactured Home Dwelling (A B C & D)
Number
Average Value
Number
Average Value
Number
Average Value
Number
Average Value
Number
Average Value
Number
Average Value
LOANS ORIGINATED
5
$113,616
2
$71,675
12
$131,482
4
$42,960
3
$52,100
4
$62,285
APPLICATIONS APPROVED, NOT ACCEPTED
0
$0
1
$89,740
6
$97,442
0
$0
0
$0
1
$146,510
APPLICATIONS DENIED
2
$88,795
1
$69,730
10
$111,877
3
$18,863
1
$99,920
1
$50,890
APPLICATIONS WITHDRAWN
0
$0
1
$177,180
5
$123,562
1
$69,690
0
$0
0
$0
FILES CLOSED FOR INCOMPLETENESS
0
$0
0
$0
3
$100,593
0
$0
0
$0
0
$0
Aggregated Statistics For Year 2008 (Based on 6 partial tracts)
A) FHA, FSA/RHS & VA Home Purchase Loans
B) Conventional Home Purchase Loans
C) Refinancings
D) Home Improvement Loans
F) Non-occupant Loans on < 5 Family Dwellings (A B C & D)
G) Loans On Manufactured Home Dwelling (A B C & D)
Number
Average Value
Number
Average Value
Number
Average Value
Number
Average Value
Number
Average Value
Number
Average Value
LOANS ORIGINATED
5
$115,422
4
$179,218
16
$169,042
2
$14,010
3
$69,263
5
$81,538
APPLICATIONS APPROVED, NOT ACCEPTED
1
$314,980
1
$87,690
2
$170,915
0
$0
0
$0
0
$0
APPLICATIONS DENIED
2
$74,210
2
$37,820
24
$118,095
8
$21,775
1
$66,810
3
$46,767
APPLICATIONS WITHDRAWN
1
$168,630
0
$0
6
$99,720
0
$0
0
$0
0
$0
FILES CLOSED FOR INCOMPLETENESS
0
$0
0
$0
0
$0
0
$0
0
$0
0
$0
Aggregated Statistics For Year 2007 (Based on 6 partial tracts)
A) FHA, FSA/RHS & VA Home Purchase Loans
B) Conventional Home Purchase Loans
C) Refinancings
D) Home Improvement Loans
F) Non-occupant Loans on < 5 Family Dwellings (A B C & D)
G) Loans On Manufactured Home Dwelling (A B C & D)
Number
Average Value
Number
Average Value
Number
Average Value
Number
Average Value
Number
Average Value
Number
Average Value
LOANS ORIGINATED
1
$109,260
8
$96,696
19
$103,074
3
$62,987
3
$68,537
4
$83,865
APPLICATIONS APPROVED, NOT ACCEPTED
0
$0
1
$89,190
3
$149,740
2
$101,960
1
$25,710
2
$114,400
APPLICATIONS DENIED
0
$0
4
$75,542
21
$94,890
3
$62,380
1
$35,440
4
$76,115
APPLICATIONS WITHDRAWN
0
$0
1
$103,950
7
$150,911
3
$132,367
1
$51,410
1
$101,910
FILES CLOSED FOR INCOMPLETENESS
0
$0
0
$0
3
$78,687
1
$118,120
0
$0
2
$118,120
Aggregated Statistics For Year 2006 (Based on 6 partial tracts)
A) FHA, FSA/RHS & VA Home Purchase Loans
B) Conventional Home Purchase Loans
C) Refinancings
D) Home Improvement Loans
F) Non-occupant Loans on < 5 Family Dwellings (A B C & D)
G) Loans On Manufactured Home Dwelling (A B C & D)
Number
Average Value
Number
Average Value
Number
Average Value
Number
Average Value
Number
Average Value
Number
Average Value
LOANS ORIGINATED
3
$66,647
8
$79,580
17
$102,422
4
$22,380
5
$63,528
4
$81,278
APPLICATIONS APPROVED, NOT ACCEPTED
0
$0
2
$97,465
9
$84,894
1
$24,170
0
$0
0
$0
APPLICATIONS DENIED
1
$152,920
4
$88,250
22
$93,978
5
$81,654
5
$52,790
4
$74,495
APPLICATIONS WITHDRAWN
0
$0
2
$122,185
12
$112,447
0
$0
0
$0
1
$46,490
FILES CLOSED FOR INCOMPLETENESS
0
$0
0
$0
3
$67,030
0
$0
1
$59,060
0
$0
Aggregated Statistics For Year 2005 (Based on 6 partial tracts)
B) Conventional Home Purchase Loans
C) Refinancings
D) Home Improvement Loans
F) Non-occupant Loans on < 5 Family Dwellings (A B C & D)
G) Loans On Manufactured Home Dwelling (A B C & D)
Number
Average Value
Number
Average Value
Number
Average Value
Number
Average Value
Number
Average Value
LOANS ORIGINATED
13
$72,189
22
$98,236
3
$73,470
0
$0
2
$75,365
APPLICATIONS APPROVED, NOT ACCEPTED
4
$49,272
5
$124,428
0
$0
0
$0
1
$127,240
APPLICATIONS DENIED
5
$52,436
18
$98,355
5
$22,352
0
$0
2
$43,910
APPLICATIONS WITHDRAWN
2
$94,625
13
$89,117
2
$48,010
1
$78,110
2
$146,525
FILES CLOSED FOR INCOMPLETENESS
0
$0
3
$115,167
0
$0
0
$0
0
$0
Aggregated Statistics For Year 2004 (Based on 6 partial tracts)
A) FHA, FSA/RHS & VA Home Purchase Loans
B) Conventional Home Purchase Loans
C) Refinancings
D) Home Improvement Loans
F) Non-occupant Loans on < 5 Family Dwellings (A B C & D)
G) Loans On Manufactured Home Dwelling (A B C & D)
Number
Average Value
Number
Average Value
Number
Average Value
Number
Average Value
Number
Average Value
Number
Average Value
LOANS ORIGINATED
3
$74,390
7
$87,143
25
$79,336
5
$27,304
3
$55,127
6
$84,603
APPLICATIONS APPROVED, NOT ACCEPTED
0
$0
2
$67,785
3
$126,123
0
$0
0
$0
1
$58,270
APPLICATIONS DENIED
1
$57,960
10
$66,472
21
$109,272
5
$21,218
1
$67,730
3
$55,637
APPLICATIONS WITHDRAWN
1
$88,590
1
$102,810
11
$116,121
0
$0
0
$0
0
$0
FILES CLOSED FOR INCOMPLETENESS
0
$0
0
$0
2
$81,230
0
$0
0
$0
0
$0
Aggregated Statistics For Year 2003 (Based on 6 partial tracts)
A) FHA, FSA/RHS & VA Home Purchase Loans
B) Conventional Home Purchase Loans
C) Refinancings
D) Home Improvement Loans
F) Non-occupant Loans on < 5 Family Dwellings (A B C & D)
Number
Average Value
Number
Average Value
Number
Average Value
Number
Average Value
Number
Average Value
LOANS ORIGINATED
2
$92,905
9
$88,164
47
$98,264
3
$16,490
6
$57,517
APPLICATIONS APPROVED, NOT ACCEPTED
0
$0
2
$45,300
10
$105,491
3
$12,163
2
$31,830
APPLICATIONS DENIED
0
$0
5
$77,932
31
$93,296
6
$31,055
1
$64,920
APPLICATIONS WITHDRAWN
0
$0
4
$180,580
20
$158,102
1
$14,640
1
$345,750
FILES CLOSED FOR INCOMPLETENESS
0
$0
0
$0
3
$129,803
0
$0
0
$0
Aggregated Statistics For Year 2001 (Based on 6 partial tracts)
A) FHA, FSA/RHS & VA Home Purchase Loans
B) Conventional Home Purchase Loans
C) Refinancings
D) Home Improvement Loans
F) Non-occupant Loans on < 5 Family Dwellings (A B C & D)
Number
Average Value
Number
Average Value
Number
Average Value
Number
Average Value
Number
Average Value
LOANS ORIGINATED
5
$82,964
11
$80,535
22
$98,125
5
$20,754
3
$40,543
APPLICATIONS APPROVED, NOT ACCEPTED
0
$0
3
$50,130
2
$105,015
0
$0
0
$0
APPLICATIONS DENIED
0
$0
6
$58,563
28
$71,266
4
$7,315
1
$111,810
APPLICATIONS WITHDRAWN
0
$0
2
$131,080
7
$108,466
0
$0
0
$0
FILES CLOSED FOR INCOMPLETENESS
0
$0
0
$0
3
$91,927
0
$0
0
$0
Aggregated Statistics For Year 2000 (Based on 6 partial tracts)
A) FHA, FSA/RHS & VA Home Purchase Loans
B) Conventional Home Purchase Loans
C) Refinancings
D) Home Improvement Loans
F) Non-occupant Loans on < 5 Family Dwellings (A B C & D)
Number
Average Value
Number
Average Value
Number
Average Value
Number
Average Value
Number
Average Value
LOANS ORIGINATED
1
$62,050
11
$94,175
16
$81,624
5
$15,210
3
$15,527
APPLICATIONS APPROVED, NOT ACCEPTED
0
$0
5
$99,366
10
$104,722
1
$11,550
0
$0
APPLICATIONS DENIED
0
$0
10
$66,644
33
$87,385
3
$16,113
0
$0
APPLICATIONS WITHDRAWN
1
$72,040
5
$103,436
11
$88,485
0
$0
0
$0
FILES CLOSED FOR INCOMPLETENESS
0
$0
1
$161,820
3
$45,790
1
$17,720
2
$59,060
Aggregated Statistics For Year 1999 (Based on 3 partial tracts)
A) FHA, FSA/RHS & VA Home Purchase Loans
B) Conventional Home Purchase Loans
C) Refinancings
D) Home Improvement Loans
F) Non-occupant Loans on < 5 Family Dwellings (A B C & D)

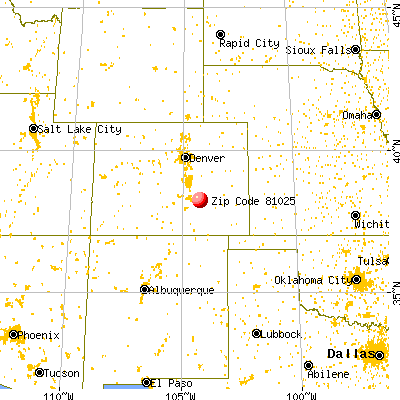


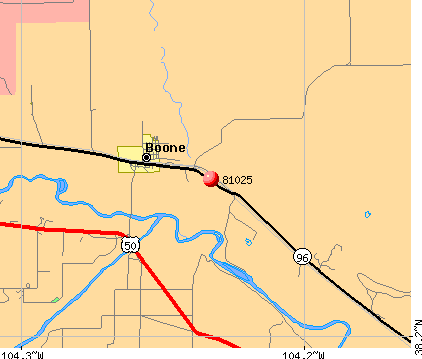 Nearest zip codes: 80928, 81001, 81006, 81008, 80864, 81003.