Estimated zip code population in 2022: 2,056 Zip code population in 2010: 2,341 Zip code population in 2000: 2,505
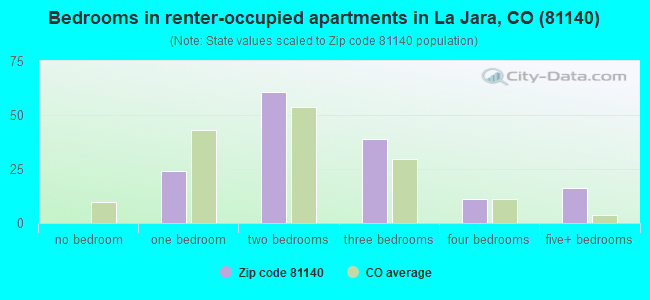
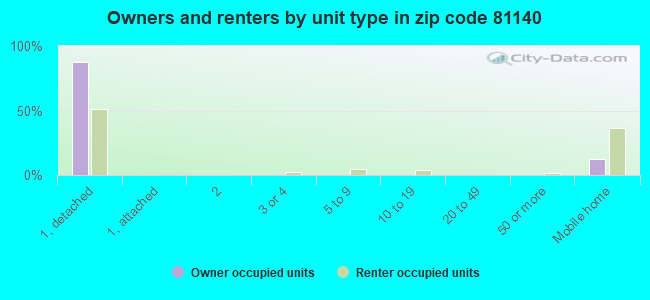
Houses and condos: 912 Renter-occupied apartments: 150
% of renters here:
19%
State:
34%
March 2022 cost of living index in zip code 81140: 92.4 (less than average, U.S. average is 100)
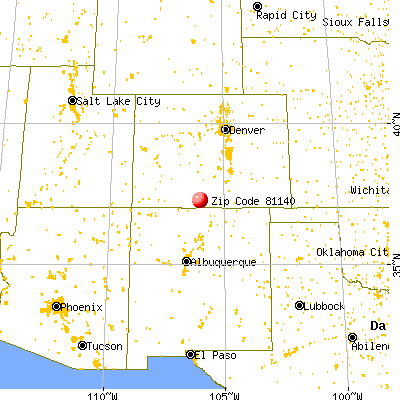
Land area: 220.4 sq. mi. Water area: 0.0 sq. mi.
Population density: 9 people per square mile
(very low).
OSM Map
General Map
Google Map
MSN Map
OSM Map
General Map
Google Map
MSN Map
OSM Map
General Map
Google Map
MSN Map
OSM Map
General Map
Google Map
MSN Map
Please wait while loading the map...
Real estate property taxes paid for housing units in 2022:
This zip code:
0.5% ($1,034)
Colorado:
0.5% ($2,422)
Median real estate property taxes paid for housing units with mortgages in 2022: $957 (0.4%) Median real estate property taxes paid for housing units with no mortgage in 2022: $1,124 (0.5%)
Business Search- 14 Million verified businesses
Males: 953
(46.4%)
Females: 1,102
(53.6%)
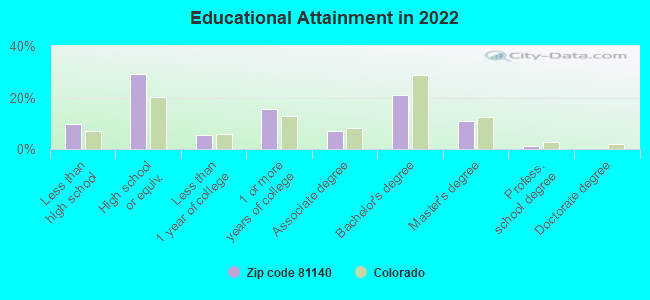
For population 25 years and over in 81140:
High school or higher: 88.5%
Bachelor's degree or higher: 32.6%
Graduate or professional degree: 12.2%
Unemployed: 4.5%
Mean travel time to work (commute): 16.7 minutes
For population 15 years and over in 81140:
Never married: 26.5%
Now married: 55.0%
Separated: 2.4%
Widowed: 11.6%
Divorced: 4.5%
Zip code 81140 compared to state average:
Median household income below state average.
Median house value significantly below state average.
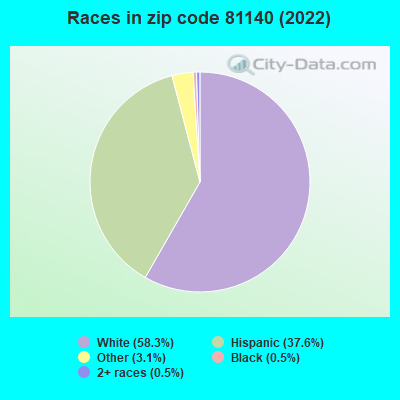
Black race population percentage significantly below state average.
Hispanic race population percentage above state average.
Foreign-born population percentage significantly below state average.
Renting percentage below state average.
Length of stay since moving in significantly above state average.
Percentage of population with a bachelor's degree or higher below state average.
Estimated median house/condo value in 2022: $227,533
81140:
$227,533
Colorado:
$531,100
According to our research of Colorado and other state lists, there were 4 registered sex offenders living in 81140 zip code as of June 16, 2024. The ratio of all residents to sex offenders in zip code 81140 is 685 to 1. The ratio of registered sex offenders to all residents in this zip code is lower than the state average.
Median resident age:
This zip code:
35.8 years
Colorado median age:
37.7 years
Average household size:
This zip code:
2.6 people
Colorado:
2.4 people
Averages for the 2020 tax year for zip code 81140, filed in 2021:
Average Adjusted Gross Income (AGI) in 2020: $46,833 (Individual Income Tax Returns)
Here:
$46,833
State:
$89,260
Salary/wage: $40,408 (reported on 77.7% of returns)
Here:
$40,408
State:
$70,330
(% of AGI for various income ranges: 1273.6% for AGIs below $25k, 3672.5% for AGIs $25k-50k, 7747.5% for AGIs $50k-75k, 12345.0% for AGIs $75k-100k, 19582.5% for AGIs $100k-200k)
Taxable interest for individuals: $662 (reported on 34.0% of returns)
This zip code:
$662
Colorado:
$2,176
(% of AGI for various income ranges: 8.8% for AGIs below $25k, 17.5% for AGIs $25k-50k, 65.0% for AGIs $50k-75k, 57.5% for AGIs $75k-100k, 200.0% for AGIs $100k-200k)
Ordinary dividends: $2,000 (reported on 9.6% of returns)
Here:
$2,000
State:
$8,820
(% of AGI for various income ranges: 20.8% for AGIs below $25k, 41.2% for AGIs $50k-75k, 237.5% for AGIs $75k-100k)
Net capital gain/loss in AGI: +$7,830 (reported on 10.6% of returns)
Here:
+$7,830
State:
+$37,276
(% of AGI for various income ranges: 7.6% for AGIs below $25k, 20.0% for AGIs $25k-50k, 187.5% for AGIs $50k-75k, 1435.0% for AGIs $75k-100k)
Profit/loss from business: +$18,330 (reported on 21.3% of returns)
Here:
+$18,330
State:
+$15,295
(% of AGI for various income ranges: 209.2% for AGIs below $25k, 544.5% for AGIs $25k-50k, 758.8% for AGIs $50k-75k, 1132.5% for AGIs $75k-100k, 2485.0% for AGIs $100k-200k)
Taxable individual retirement arrangement distribution: $9,940 (reported on 5.3% of returns)
81140:
$9,940
Colorado:
$23,785
(% of AGI for various income ranges: 123.6% for AGIs below $25k, 235.0% for AGIs $50k-75k)
Earned income credit: $2,362 (reported on 22.3% of returns)
Here:
$2,362
State:
$2,053
(% of AGI for various income ranges: 100.0% for AGIs below $25k, 123.0% for AGIs $25k-50k)
Percentage of individuals using paid preparers for their 2020 taxes: 94.7%
Here:
95%
State:
93%
(% for various income ranges: 91.7% for AGIs below $25k, 96.3% for AGIs $25k-50k, 100.0% for AGIs $50k-75k, 88.9% for AGIs $75k-100k, 100.0% for AGIs $100k-200k)
Averages for the 2012 tax year for zip code 81140, filed in 2013:
Average Adjusted Gross Income (AGI) in 2012: $39,771 (Individual Income Tax Returns)
Here:
$39,771
State:
$69,103
Salary/wage: $34,350 (reported on 80.0% of returns)
Here:
$34,350
State:
$54,794
(% of AGI for various income ranges: 74.6% for AGIs below $25k, 76.8% for AGIs $25k-50k, 75.3% for AGIs $50k-75k, 72.1% for AGIs $75k-100k, 53.5% for AGIs $100k-200k)
Taxable interest for individuals: $713 (reported on 35.3% of returns)
This zip code:
$713
Colorado:
$1,971
(% of AGI for various income ranges: 0.8% for AGIs below $25k, 0.2% for AGIs $25k-50k, 0.9% for AGIs $50k-75k, 0.5% for AGIs $75k-100k, 0.7% for AGIs $100k-200k)
Ordinary dividends: $900 (reported on 8.2% of returns)
Here:
$900
State:
$7,140
Net capital gain/loss in AGI: +$6,662 (reported on 9.4% of returns)
Here:
+$6,662
State:
+$23,009
(% of AGI for various income ranges: 1.7% for AGIs below $25k, 2.1% for AGIs $50k-75k, 7.1% for AGIs $75k-100k)
Profit/loss from business: +$9,136 (reported on 25.9% of returns)
Here:
+$9,136
State:
+$13,514
(% of AGI for various income ranges: 11.5% for AGIs below $25k, 8.0% for AGIs $25k-50k, 5.4% for AGIs $50k-75k, 10.4% for AGIs $75k-100k)
Taxable individual retirement arrangement distribution: $9,375 (reported on 4.7% of returns)
81140:
$9,375
Colorado:
$17,927
Total itemized deductions: $17,519 (21% of AGI, reported on 18.8% of returns)
Here:
$17,519
State:
$24,621
Here:
20.9% of AGI
State:
18.5% of AGI
(% of AGI for various income ranges: 9.9% for AGIs $25k-50k, 8.9% for AGIs $50k-75k, 9.9% for AGIs $75k-100k, 10.1% for AGIs $100k-200k)
Charity contributions: $6,777 (reported on 15.3% of returns)
Here:
$6,777
State:
$4,449
(% of AGI for various income ranges: 2.7% for AGIs $25k-50k, 4.4% for AGIs $50k-75k, 3.5% for AGIs $100k-200k)
Taxes paid: $3,569 (reported on 18.8% of returns)
81140:
$3,569
State:
$7,641
(% of AGI for various income ranges: 1.3% for AGIs $25k-50k, 1.5% for AGIs $50k-75k, 2.0% for AGIs $75k-100k, 2.9% for AGIs $100k-200k)
Earned income credit: $2,312 (reported on 28.2% of returns)
Here:
$2,312
State:
$2,095
(% of AGI for various income ranges: 8.2% for AGIs below $25k, 2.0% for AGIs $25k-50k)
Percentage of individuals using paid preparers for their 2012 taxes: 55.3%
Here:
55%
State:
49%
(% for various income ranges: 52.5% for AGIs below $25k, 57.1% for AGIs $25k-50k, 53.8% for AGIs $50k-75k, 60.0% for AGIs $75k-100k, 66.7% for AGIs $100k-200k)
Averages for the 2004 tax year for zip code 81140, filed in 2005:
Average Adjusted Gross Income (AGI) in 2004: $27,289 (Individual Income Tax Returns)
Here:
$27,289
State:
$55,014
Salary/wage: $27,335 (reported on 80.7% of returns)
Here:
$27,335
State:
$46,010
(% of AGI for various income ranges: 186.8% for AGIs below $10k, 77.3% for AGIs $10k-25k, 85.3% for AGIs $25k-50k, 85.3% for AGIs $50k-75k, 73.3% for AGIs $75k-100k, 56.2% for AGIs over 100k)
Taxable interest for individuals: $1,114 (reported on 47.9% of returns)
This zip code:
$1,114
Colorado:
$2,127
(% of AGI for various income ranges: 16.8% for AGIs below $10k, 2.4% for AGIs $10k-25k, 2.0% for AGIs $25k-50k, 0.8% for AGIs $50k-75k, 0.9% for AGIs $75k-100k, 1.5% for AGIs over 100k)
Taxable dividends: $711 (reported on 13.6% of returns)
Here:
$711
State:
$3,782
(% of AGI for various income ranges: 3.0% for AGIs below $10k, 0.3% for AGIs $10k-25k, 0.2% for AGIs $25k-50k, 0.4% for AGIs $50k-75k, 0.5% for AGIs $75k-100k)
Net capital gain/loss: +$4,895 (reported on 12.5% of returns)
Here:
+$4,895
State:
+$17,882
(% of AGI for various income ranges: 12.1% for AGIs below $10k, 2.4% for AGIs $10k-25k, 0.8% for AGIs $25k-50k, 1.0% for AGIs $50k-75k, 8.5% for AGIs $75k-100k)
Profit/loss from business: +$4,206 (reported on 20.8% of returns)
Here:
+$4,206
State:
+$11,247
(% of AGI for various income ranges: 17.7% for AGIs below $10k, 3.7% for AGIs $10k-25k, 4.9% for AGIs $25k-50k, 0.9% for AGIs $50k-75k, 3.5% for AGIs $75k-100k)
IRA payment deduction: $2,786 (reported on 1.7% of returns)
81140:
$2,786
Colorado:
$2,947
Total itemized deductions: $13,812 (25% of AGI, reported on 17.1% of returns)
Here:
$13,812
State:
$20,560
Here:
24.6% of AGI
State:
21.4% of AGI
(% of AGI for various income ranges: 7.8% for AGIs $10k-25k, 7.0% for AGIs $25k-50k, 10.9% for AGIs $50k-75k, 9.0% for AGIs $75k-100k, 11.1% for AGIs over 100k)
Charity contributions deductions: $4,496 (8% of AGI, reported on 14.6% of returns)
Here:
$4,496
State:
$3,518
Here:
7.7% of AGI
State:
3.4% of AGI
(% of AGI for various income ranges: 1.8% for AGIs $10k-25k, 1.8% for AGIs $25k-50k, 2.7% for AGIs $50k-75k, 3.1% for AGIs $75k-100k, 3.9% for AGIs over 100k)
Total tax: $3,177 (reported on 66.4% of returns)
81140:
$3,177
State:
$9,173
(% of AGI for various income ranges: 5.8% for AGIs below $10k, 4.0% for AGIs $10k-25k, 5.3% for AGIs $25k-50k, 7.9% for AGIs $50k-75k, 12.6% for AGIs $75k-100k, 14.5% for AGIs over 100k)
Earned income credit: $1,770 (reported on 24.3% of returns)
Here:
$1,770
State:
$1,595
Percentage of individuals using paid preparers for their 2004 taxes: 63.1%
Here:
63%
State:
55%
(% for various income ranges: 63.5% for AGIs below $10k, 60.0% for AGIs $10k-25k, 60.9% for AGIs $25k-50k, 71.9% for AGIs $50k-75k, 75.0% for AGIs $75k-100k, 61.9% for AGIs over 100k)
Household received Food Stamps/SNAP in the past 12 months: 124 Household did not receive Food Stamps/SNAP in the past 12 months: 666
Women who had a birth in the past 12 months: 21 (18 now married, 3 unmarried) Women who did not have a birth in the past 12 months: 448 (199 now married, 248 unmarried)
Housing units in zip code 81140 with a mortgage: 256 (5 second mortgage) Median monthly owner costs for units with a mortgage: $1,224 Median monthly owner costs for units without a mortgage: $478
Residents with income below the poverty level in 2022:
This zip code:
16.9%
Whole state:
9.4%
Residents with income below 50% of the poverty level in 2022:
This zip code:
11.3%
Whole state:
4.6%
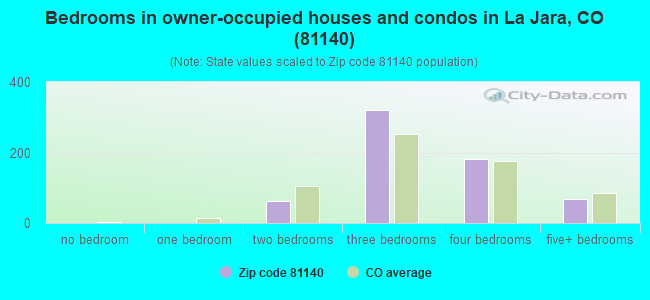
Median number of rooms in houses and condos:
Here:
6.2
State:
6.8
Median number of rooms in apartments:
Here:
4.6
State:
4.0
Notable locations in this zip code not listed on our city pages
Notable locations in zip code 81140: Shawcroft Cow Camp (A), Baxter and Martin Cow Camp (B), Alamosa Guard Station (C), Carmel Fire Department (D), La Jara Fire Department (E), La Jara Police Department (F). Display/hide their locations on the map
Reservoirs: Dodo Reservoir (A), Whippoorwill Reservoir (B), Chipmunk Reservoir (C), Wren Reservoir (D), Pine Squirrel Reservoir (E). Display/hide their locations on the map
Creeks: Ojito Creek (A), Poso Creek (B), Posito Creek (C), Piedrosa Creek (D), Deer Creek (E), Ranger Creek (F), Lieutenant Creek (G), Silver Creek (H). Display/hide their locations on the map
In group quarters: 40 (-1 institutionalized population)
Size of family households: 198 2-persons, 77 3-persons, 52 4-persons, 54 5-persons, 25 6-persons, 61 7-or-more-persons
Size of nonfamily households: 308 1-person, 2 2-persons
514 married couples with children.
107 single-parent households (18 men, 89 women).
73.0% of residents of 81140 zip code speak English at home.
17.4% of residents speak Spanish at home (75% very well, 22% well, 4% not well).
10.4% of residents speak other Indo-European language at home (89% very well, 11% not well).
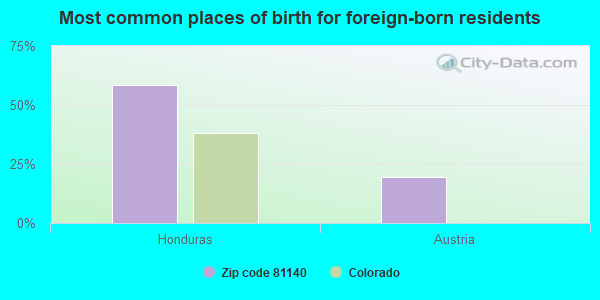
Foreign born population: 36 (1.8%) (59.4% of them are naturalized citizens)
This zip code:
1.8%
Whole state:
9.5%
58%Honduras
19%Austria
19%German
12%English
5%American
5%Danish
3%Italian
2%European
2%Irish
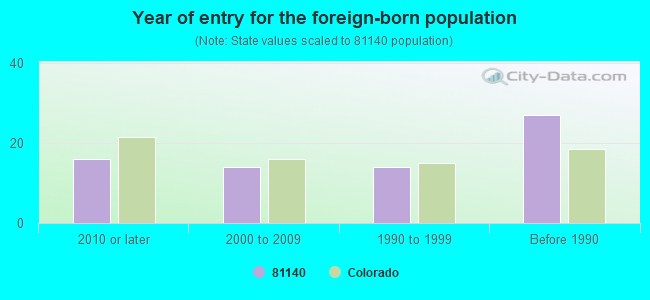
Year of entry for the foreign-born population
162010 or later
142000 to 2009
141990 to 1999
27Before 1990
Facilities with environmental interests located in this zip code:
JAMES COWEN FARM (4521 EAST COUNTY ROAD 12S in LA JARA, CO)
(Integrated Compliance Information System) - ICIS-08-1989-0204, FORMAL ENFORCEMENT ACTION COMPLIANCE ACTIVITY (Tracking inspections of insecticide, fungicide, and rodenticide, and toxic substances) Alternative names: COWEN JIM FARM, JIM COWEN FARM
CENTAURI HIGH SCHOOL (17889 STATE HIGHWAY 285 in LA JARA, CO)
(Geographic Names Information System) (National Center for Education Statistics) - STATE ID-1378 Organizations: NORTH CONEJOS RE-1J (SCHOOL DISTRICT)
CENTAURI MIDDLE SCHOOL (17891 STATE HIGHWAY 285 in LA JARA, CO)
(Geographic Names Information System) (National Center for Education Statistics) - STATE ID-1276 Organizations: NORTH CONEJOS RE-1J (SCHOOL DISTRICT)
ASPHALT GRAVEL PRODUCTS - GARRETT PIT (NE NE SEC 9 T36N R8E in LA JARA, 10.2 MI NW OF, CO)
AIR MINOR (AIRS/AFS) Business SIC classification: CONSTRUCTION SAND AND GRAVEL
CSU COOPERATIVE EXTENSION OFFICE-CONEJOS COUNTY (17705 US HIGHWAY 285 in LA JARA, CO)
COMPLIANCE ACTIVITY (Tracking inspections of insecticide, fungicide, and rodenticide, and toxic substances) Alternative names: CSU COOP EXT OFF-CONEJOS CNTY
Housing units lacking complete plumbing facilities: 3.3%
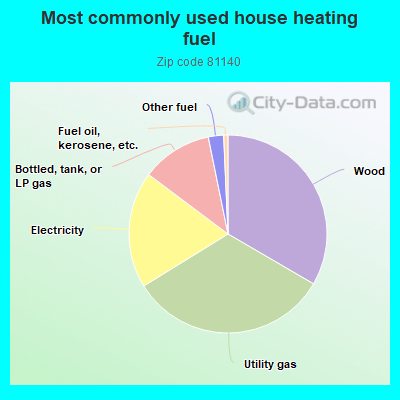
33.5%Wood
32.9%Utility gas
19.1%Electricity
11.6%Bottled, tank, or LP gas
2.5%Other fuel
0.7%Fuel oil, kerosene, etc.
Population in 1990: 2,274. Population change in the 1990s: +231 (+10.2%).
Place of birth for U.S.-born residents:
This state: 1,439
Northeast: 113
Midwest: 71
South: 76
West: 278
69% of the 81140 zip code residents lived in the same house 5 years ago. Out of people who lived in different houses, 48% lived in this county. Out of people who lived in different counties, 50% lived in Colorado.
95% of the 81140 zip code residents lived in the same house 1 year ago. Out of people who lived in different houses, 74% moved from this county. Out of people who lived in different houses, 21% moved from different county within same state. Out of people who lived in different houses, 10% moved from different state.
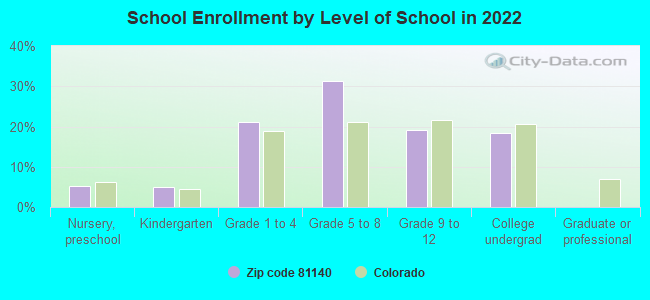
Private vs. public school enrollment:
Students in private schools in grades 1 to 8 (elementary and middle school): 86
Here:
30.5%
Colorado:
11.4%
Students in private schools in grades 9 to 12 (high school): 12
Here:
12.5%
Colorado:
8.5%
Students in private undergraduate colleges: 26
Here:
27.5%
Colorado:
14.0%
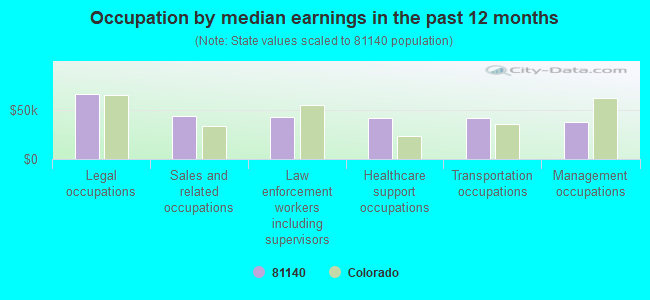
Occupation by median earnings in the past 12 months ($)
66,542Legal occupations
43,676Sales and related occupations
42,476Law enforcement workers including supervisors
42,034Healthcare support occupations
41,699Transportation occupations
38,069Management occupations
Top industries in this zip code by the number of employees in 2005:
Health Care and Social Assistance: General Medical and Surgical Hospitals (100-249 employees: 1 establishment, 1-4 employees: 1 establishment)
Finance and Insurance: Commercial Banking (20-49: 1)
7 people in hospitals/wards and hospices for chronically ill
7 people in other hospitals or wards for chronically ill
5 people in other group homes
Fatal accident statistics in 2011:
Fatal accident count: 1
Vehicles involved in fatal accidents: 2
Fatal accidents caused by drunken drivers: 2
Fatalities: 1
Persons involved in fatal accidents: 2
Pedestrians involved in fatal accidents: 0
Fatal accident statistics in 2010:
Fatal accident count: 1
Vehicles involved in fatal accidents: 3
Fatal accidents caused by drunken drivers: 1
Fatalities: 3
Persons involved in fatal accidents: 5
Pedestrians involved in fatal accidents: 0
2006 - 2018 National Fire Incident Reporting System (NFIRS) incidents
According to the data from the years 2006 - 2018 the average number of fires per year is 15. The highest number of reported fires - 35 took place in 2008, and the least - 5 in 2017. The data has a declining trend.
When looking into fire subcategories, the most incidents belonged to: Outside Fires (67.9%), and Structure Fires (25.3%).
Fire incident types reported to NFIRS in Zip Code 81140


 Nearest zip codes: 81124, 81148, 81129, 81120, 81144, 81141.


 According to the data from the years 2006 - 2018 the average number of fires per year is 15. The highest number of reported fires - 35 took place in 2008, and the least - 5 in 2017. The data has a declining trend.
 When looking into fire subcategories, the most incidents belonged to: Outside Fires (67.9%), and Structure Fires (25.3%).