Estimated zip code population in 2022: 1,031 Zip code population in 2010: 823 Zip code population in 2000: 906
Houses and condos: 710 Renter-occupied apartments: 106
% of renters here:
20%
State:
34%
March 2022 cost of living index in zip code 81233: 94.2 (less than average, U.S. average is 100)
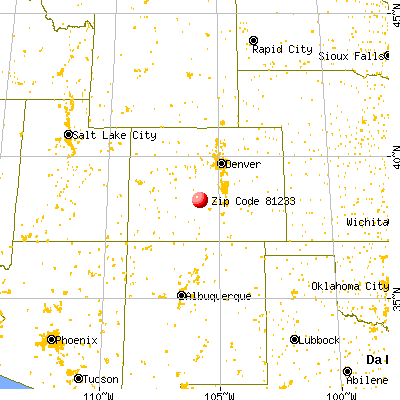
Land area: 88.1 sq. mi. Water area: 0.0 sq. mi.
Population density: 12 people per square mile
(very low).
OSM Map
General Map
Google Map
MSN Map
OSM Map
General Map
Google Map
MSN Map
OSM Map
General Map
Google Map
MSN Map
OSM Map
General Map
Google Map
MSN Map
Please wait while loading the map...
Real estate property taxes paid for housing units in 2022:
This zip code:
0.3% ($1,226)
Colorado:
0.5% ($2,422)
Median real estate property taxes paid for housing units with mortgages in 2022: $1,572 (0.3%) Median real estate property taxes paid for housing units with no mortgage in 2022: $1,046 (0.3%)
Estimated median house/condo value in 2022: $425,085
81233:
$425,085
Colorado:
$531,100
According to our research of Colorado and other state lists, there was 1 registered sex offender living in 81233 zip code as of June 16, 2024. The ratio of all residents to sex offenders in zip code 81233 is 861 to 1. The ratio of registered sex offenders to all residents in this zip code is lower than the state average.
Median resident age:
This zip code:
48.7 years
Colorado median age:
37.7 years
Average household size:
This zip code:
1.9 people
Colorado:
2.4 people
Averages for the 2020 tax year for zip code 81233, filed in 2021:
Average Adjusted Gross Income (AGI) in 2020: $69,026 (Individual Income Tax Returns)
Here:
$69,026
State:
$89,260
Salary/wage: $55,931 (reported on 67.4% of returns)
Here:
$55,931
State:
$70,330
(% of AGI for various income ranges: 1057.1% for AGIs below $25k, 3443.8% for AGIs $25k-50k, 5962.5% for AGIs $50k-75k, 8440.0% for AGIs $75k-100k, 21630.0% for AGIs $100k-200k)
Taxable interest for individuals: $878 (reported on 41.9% of returns)
This zip code:
$878
Colorado:
$2,176
(% of AGI for various income ranges: 18.6% for AGIs below $25k, 40.0% for AGIs $25k-50k, 130.0% for AGIs $50k-75k, 152.5% for AGIs $100k-200k)
Ordinary dividends: $4,177 (reported on 30.2% of returns)
Here:
$4,177
State:
$8,820
(% of AGI for various income ranges: 108.6% for AGIs below $25k, 121.2% for AGIs $25k-50k, 187.5% for AGIs $50k-75k, 737.5% for AGIs $100k-200k)
Net capital gain/loss in AGI: +$23,364 (reported on 25.6% of returns)
Here:
+$23,364
State:
+$37,276
(% of AGI for various income ranges: 310.0% for AGIs $25k-50k, 202.5% for AGIs $50k-75k, 5602.5% for AGIs $100k-200k)
Profit/loss from business: +$8,733 (reported on 20.9% of returns)
Here:
+$8,733
State:
+$15,295
(% of AGI for various income ranges: 70.0% for AGIs below $25k, 662.5% for AGIs $25k-50k, 517.5% for AGIs $100k-200k)
Taxable individual retirement arrangement distribution: $19,029 (reported on 16.3% of returns)
81233:
$19,029
Colorado:
$23,785
(% of AGI for various income ranges: 612.5% for AGIs $25k-50k, 4210.0% for AGIs $75k-100k)
Total itemized deductions: $32,100 (reported on 4.7% of returns)
Here:
$32,100
State:
$35,141
(% of AGI for various income ranges: 802.5% for AGIs $25k-50k)
Taxes paid: $6,950 (reported on 4.7% of returns)
81233:
$6,950
State:
$7,710
(% of AGI for various income ranges: 173.8% for AGIs $25k-50k)
Earned income credit: $2,050 (reported on 9.3% of returns)
Here:
$2,050
State:
$2,053
(% of AGI for various income ranges: 117.1% for AGIs below $25k)
Percentage of individuals using paid preparers for their 2020 taxes: 90.7%
Here:
91%
State:
93%
(% for various income ranges: 81.8% for AGIs below $25k, 91.7% for AGIs $25k-50k, 85.7% for AGIs $50k-75k, 100.0% for AGIs $75k-100k, 100.0% for AGIs $100k-200k)
Averages for the 2012 tax year for zip code 81233, filed in 2013:
Average Adjusted Gross Income (AGI) in 2012: $51,331 (Individual Income Tax Returns)
Here:
$51,331
State:
$69,103
Salary/wage: $36,909 (reported on 65.7% of returns)
Here:
$36,909
State:
$54,794
(% of AGI for various income ranges: 50.1% for AGIs below $25k, 50.2% for AGIs $25k-50k, 52.9% for AGIs $50k-75k, 60.3% for AGIs $75k-100k, 32.2% for AGIs $100k-200k)
Taxable interest for individuals: $953 (reported on 48.6% of returns)
This zip code:
$953
Colorado:
$1,971
(% of AGI for various income ranges: 2.3% for AGIs below $25k, 0.8% for AGIs $25k-50k, 1.4% for AGIs $50k-75k, 0.5% for AGIs $75k-100k, 0.6% for AGIs $100k-200k)
Ordinary dividends: $2,250 (reported on 28.6% of returns)
Here:
$2,250
State:
$7,140
(% of AGI for various income ranges: 2.0% for AGIs below $25k, 2.0% for AGIs $25k-50k, 1.9% for AGIs $50k-75k, 1.7% for AGIs $75k-100k)
Net capital gain/loss in AGI: +$4,925 (reported on 22.9% of returns)
Here:
+$4,925
State:
+$23,009
(% of AGI for various income ranges: 0.5% for AGIs $25k-50k, 9.8% for AGIs $75k-100k)
Profit/loss from business: +$5,386 (reported on 20.0% of returns)
Here:
+$5,386
State:
+$13,514
Taxable individual retirement arrangement distribution: $12,788 (reported on 22.9% of returns)
81233:
$12,788
Colorado:
$17,927
Total itemized deductions: $19,118 (23% of AGI, reported on 31.4% of returns)
Here:
$19,118
State:
$24,621
Here:
23.2% of AGI
State:
18.5% of AGI
Charity contributions: $2,878 (reported on 25.7% of returns)
Here:
$2,878
State:
$4,449
Taxes paid: $4,127 (reported on 31.4% of returns)
81233:
$4,127
State:
$7,641
Earned income credit: $1,533 (reported on 8.6% of returns)
Here:
$1,533
State:
$2,095
(% of AGI for various income ranges: 3.2% for AGIs below $25k)
Percentage of individuals using paid preparers for their 2012 taxes: 54.3%
Here:
54%
State:
49%
(% for various income ranges: 50.0% for AGIs below $25k, 55.6% for AGIs $25k-50k, 50.0% for AGIs $50k-75k, 60.0% for AGIs $75k-100k, 66.7% for AGIs $100k-200k)
Averages for the 2004 tax year for zip code 81233, filed in 2005:
Average Adjusted Gross Income (AGI) in 2004: $33,178 (Individual Income Tax Returns)
Here:
$33,178
State:
$55,014
Salary/wage: $27,636 (reported on 67.2% of returns)
Here:
$27,636
State:
$46,010
(% of AGI for various income ranges: 107.4% for AGIs below $10k, 57.2% for AGIs $10k-25k, 62.3% for AGIs $25k-50k, 59.2% for AGIs $50k-75k, 61.7% for AGIs $75k-100k, 37.0% for AGIs over 100k)
Taxable interest for individuals: $1,440 (reported on 64.1% of returns)
This zip code:
$1,440
Colorado:
$2,127
(% of AGI for various income ranges: 32.6% for AGIs below $10k, 4.5% for AGIs $10k-25k, 1.2% for AGIs $25k-50k, 2.8% for AGIs $50k-75k, 1.0% for AGIs $75k-100k, 1.9% for AGIs over 100k)
Taxable dividends: $2,236 (reported on 32.3% of returns)
Here:
$2,236
State:
$3,782
(% of AGI for various income ranges: 27.1% for AGIs below $10k, 3.9% for AGIs $10k-25k, 2.0% for AGIs $25k-50k, 1.4% for AGIs $50k-75k, 1.3% for AGIs over 100k)
Net capital gain/loss: +$4,726 (reported on 28.8% of returns)
Here:
+$4,726
State:
+$17,882
(% of AGI for various income ranges: -4.7% for AGIs below $10k, 1.7% for AGIs $10k-25k, 1.5% for AGIs $25k-50k, 0.6% for AGIs $50k-75k, 15.2% for AGIs over 100k)
Profit/loss from business: +$264 (reported on 22.1% of returns)
Here:
+$264
State:
+$11,247
(% of AGI for various income ranges: -32.9% for AGIs below $10k, 11.8% for AGIs $10k-25k, -2.4% for AGIs $25k-50k, -0.1% for AGIs $50k-75k)
IRA payment deduction: $2,375 (reported on 4.1% of returns)
81233:
$2,375
Colorado:
$2,947
Total itemized deductions: $16,746 (31% of AGI, reported on 31.0% of returns)
Here:
$16,746
State:
$20,560
Here:
30.9% of AGI
State:
21.4% of AGI
(% of AGI for various income ranges: 67.1% for AGIs below $10k, 18.8% for AGIs $10k-25k, 16.1% for AGIs $25k-50k, 13.4% for AGIs $50k-75k, 17.6% for AGIs $75k-100k, 10.6% for AGIs over 100k)
Charity contributions deductions: $1,891 (3% of AGI, reported on 23.4% of returns)
Here:
$1,891
State:
$3,518
Here:
3.3% of AGI
State:
3.4% of AGI
(% of AGI for various income ranges: 1.9% for AGIs $10k-25k, 1.0% for AGIs $25k-50k, 1.7% for AGIs $50k-75k, 1.9% for AGIs $75k-100k, 0.9% for AGIs over 100k)
Total tax: $4,480 (reported on 71.0% of returns)
81233:
$4,480
State:
$9,173
(% of AGI for various income ranges: 7.4% for AGIs below $10k, 4.7% for AGIs $10k-25k, 6.4% for AGIs $25k-50k, 8.9% for AGIs $50k-75k, 9.9% for AGIs $75k-100k, 16.7% for AGIs over 100k)
Earned income credit: $1,464 (reported on 14.2% of returns)
Here:
$1,464
State:
$1,595
Percentage of individuals using paid preparers for their 2004 taxes: 53.9%
Here:
54%
State:
55%
(% for various income ranges: 54.3% for AGIs below $10k, 51.1% for AGIs $10k-25k, 48.4% for AGIs $25k-50k, 81.8% for AGIs $50k-75k, 63.2% for AGIs over 100k)
Household received Food Stamps/SNAP in the past 12 months: 27 Household did not receive Food Stamps/SNAP in the past 12 months: 514
Women who had a birth in the past 12 months: 5 (5 now married, 0 unmarried) Women who did not have a birth in the past 12 months: 165 (123 now married, 40 unmarried)
Housing units in zip code 81233 with a mortgage: 220 Houses without a mortgage: 15
Median monthly owner costs for units with a mortgage: $1,950 Median monthly owner costs for units without a mortgage: $309
Residents with income below the poverty level in 2022:
This zip code:
6.5%
Whole state:
9.4%
Residents with income below 50% of the poverty level in 2022:
This zip code:
3.2%
Whole state:
4.6%
Median number of rooms in houses and condos:
Here:
5.2
State:
6.8
Median number of rooms in apartments:
Here:
2.3
State:
4.0
Notable locations in this zip code not listed on our city pages
Creeks: Little Badger Creek (A), Stout Creek (B), Spring Creek (C), Cherry Creek (D), West Creek (E), Howard Creek (F), Gross Creek (G). Display/hide their locations on the map
Size of family households: 238 2-persons, 48 3-persons, 70 4-persons, 4 5-persons
Size of nonfamily households: 148 1-person, 33 2-persons
112 married couples with children.
0 single-parent households ().
97.7% of residents of 81233 zip code speak English at home.
3.8% of residents speak other Indo-European language at home (29% very well, 71% not well).
Foreign born population: 64 (6.3%) (67.7% of them are naturalized citizens)
This zip code:
6.3%
Whole state:
9.5%
41%France
33%Australia
27%Norway
27%Italian
19%Irish
18%German
9%English
7%American
5%Swedish
3%Czech
Year of entry for the foreign-born population
02010 or later
242000 to 2009
201990 to 1999
16Before 1990
Facilities with environmental interests located in this zip code:
GROENDYKE TRANSPORT, INC. (1.5 MILES_WEST OF HOWARD in HOWARD, CO)
(Integrated Compliance Information System) - ICIS-08-1997-0013, FORMAL ENFORCEMENT ACTION Business SIC classification: TRUCKING, EXCEPT LOCAL
Housing units lacking complete kitchen facilities: 16.1%
41.4%Wood
30.7%Bottled, tank, or LP gas
23.3%Electricity
4.8%Utility gas
Population in 1990: 485. Population change in the 1990s: +421 (+86.8%).
Place of birth for U.S.-born residents:
This state: 222
Northeast: 139
Midwest: 298
South: 66
West: 240
57% of the 81233 zip code residents lived in the same house 5 years ago. Out of people who lived in different houses, 11% lived in this county. Out of people who lived in different counties, 50% lived in Colorado.
89% of the 81233 zip code residents lived in the same house 1 year ago. Out of people who lived in different houses, 6% moved from this county. Out of people who lived in different houses, 88% moved from different county within same state. Out of people who lived in different houses, 12% moved from different state.
Private vs. public school enrollment:
Students in private schools in grades 1 to 8 (elementary and middle school):
Here:
0.0%
Colorado:
11.4%
Students in private schools in grades 9 to 12 (high school):
Here:
0.0%
Colorado:
8.5%
Students in private undergraduate colleges:
Here:
0.0%
Colorado:
14.0%
Occupation by median earnings in the past 12 months ($)
107,712Construction and extraction occupations
55,756Management occupations
54,059Business and financial operations occupations
38,008Office and administrative support occupations
Top industries in this zip code by the number of employees in 2005:
Accommodation and Food Services: Hotels (except Casino Hotels) and Motels (5-9 employees: 1 establishment)
Professional, Scientific, and Technical Services: Building Inspection Services (5-9: 1)
Construction: Electrical Contractors (5-9: 1)
Construction: New Single-Family Housing Construction (except Operative Builders) (1-4: 1)
Health Care and Social Assistance: Other Individual and Family Services (1-4: 1)
Other Services (except Public Administration): Religious Organizations (1-4: 1)
Construction: Water and Sewer Line and Related Structures Construction (1-4: 1)
Construction: New Multifamily Housing Construction (except Operative Builders) (1-4: 1)
Fatal accident statistics in 2013:
Fatal accident count: 1
Vehicles involved in fatal accidents: 2
Fatal accidents caused by drunken drivers: 0
Fatalities: 1
Persons involved in fatal accidents: 2
Pedestrians involved in fatal accidents: 0
Fatal accident statistics in 2012:
Fatal accident count: 1
Vehicles involved in fatal accidents: 2
Fatal accidents caused by drunken drivers: 0
Fatalities: 1
Persons involved in fatal accidents: 2
Pedestrians involved in fatal accidents: 0
Most common first names in zip code 81233 among deceased individuals
Name
Count
Lived (average)
William
8
66.5 years
John
6
79.7 years
George
5
80.0 years
James
5
69.2 years
Edward
4
58.7 years
Helen
4
77.2 years
Mary
4
78.5 years
Robert
4
71.5 years
Bertha
3
82.0 years
Harry
3
75.6 years
Most common last names in zip code 81233 among deceased individuals
Last name
Count
Lived (average)
Bloesser
4
73.0 years
Willoughby
4
71.3 years
Green
3
67.3 years
Wadsworth
3
51.0 years
Deangelo
2
79.0 years
Degroot
2
88.5 years
Kelso
2
80.0 years
Auld
2
86.5 years
Domenick
2
88.5 years
Hall
2
78.0 years
Discuss Howard, Colorado (CO) on our hugely popular Colorado forum.


 Nearest zip codes: 81222, 81223, 81232, 81242, 81201, 81155.