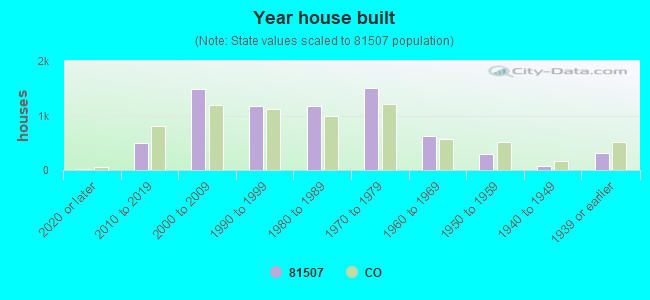
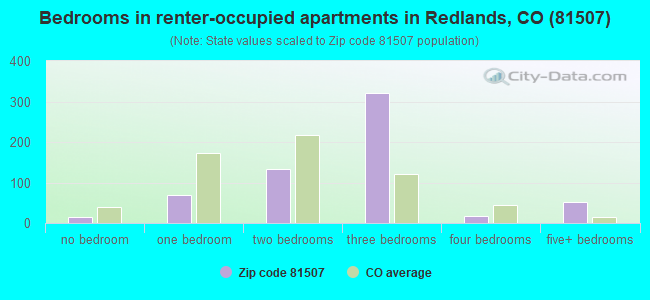
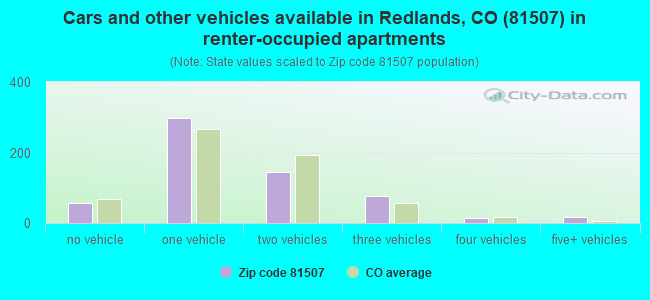
Houses and condos: 7,380 Renter-occupied apartments: 606
% of renters here:
9%
State:
34%
March 2022 cost of living index in zip code 81507: 95.0 (less than average, U.S. average is 100)
Land area: 110.1 sq. mi. Water area: 0.9 sq. mi.
Population density: 149 people per square mile
(very low).
OSM Map
Google Map
MSN Map
OSM Map
General Map
Google Map
MSN Map
OSM Map
Google Map
MSN Map
OSM Map
Google Map
MSN Map
Please wait while loading the map...
Real estate property taxes paid for housing units in 2022:
This zip code:
0.4% ($1,808)
Colorado:
0.5% ($2,422)
Median real estate property taxes paid for housing units with mortgages in 2022: $1,906 (0.4%) Median real estate property taxes paid for housing units with no mortgage in 2022: $1,661 (0.3%)
Business Search- 14 Million verified businesses
Males: 8,010
(49.0%)
Females: 8,345
(51.0%)
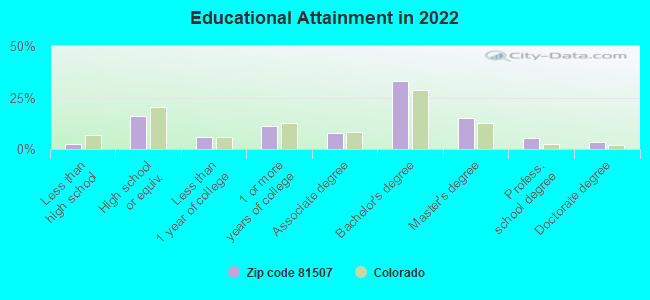
For population 25 years and over in 81507:
High school or higher: 98.7%
Bachelor's degree or higher: 57.8%
Graduate or professional degree: 24.4%
Unemployed: 2.7%
Mean travel time to work (commute): 19.7 minutes
For population 15 years and over in 81507:
Never married: 17.2%
Now married: 67.0%
Separated: 1.1%
Widowed: 5.1%
Divorced: 9.6%
Zip code 81507 compared to state average:
Black race population percentage significantly below state average.
Hispanic race population percentage below state average.
Median age significantly above state average.
Foreign-born population percentage significantly below state average.
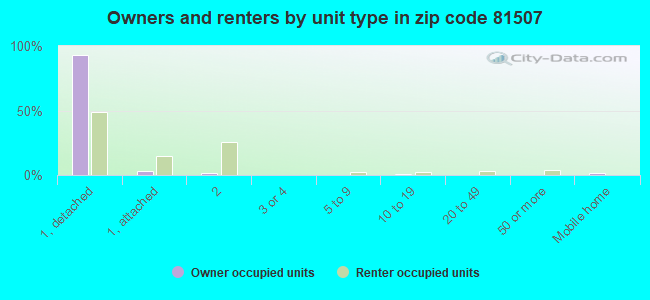
Renting percentage significantly below state average.
Length of stay since moving in significantly above state average.
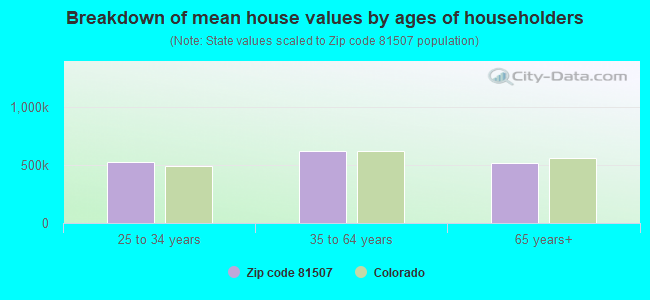
Estimated median house/condo value in 2022: $510,239
81507:
$510,239
Colorado:
$531,100
According to our research of Colorado and other state lists, there were 17 registered sex offenders living in 81507 zip code as of June 16, 2024. The ratio of all residents to sex offenders in zip code 81507 is 892 to 1. The ratio of registered sex offenders to all residents in this zip code is lower than the state average.
Median resident age:
This zip code:
50.9 years
Colorado median age:
37.7 years
Average household size:
This zip code:
2.4 people
Colorado:
2.4 people
Averages for the 2020 tax year for zip code 81507, filed in 2021:
Average Adjusted Gross Income (AGI) in 2020: $108,061 (Individual Income Tax Returns)
Here:
$108,061
State:
$89,260
Salary/wage: $80,371 (reported on 71.5% of returns)
Here:
$80,371
State:
$70,330
(% of AGI for various income ranges: 1215.3% for AGIs below $25k, 3269.1% for AGIs $25k-50k, 5640.3% for AGIs $50k-75k, 8215.6% for AGIs $75k-100k, 17303.8% for AGIs $100k-200k, 69689.6% for AGIs over 200k)
Taxable interest for individuals: $2,435 (reported on 48.5% of returns)
This zip code:
$2,435
Colorado:
$2,176
(% of AGI for various income ranges: 42.8% for AGIs below $25k, 80.1% for AGIs $25k-50k, 104.0% for AGIs $50k-75k, 231.4% for AGIs $75k-100k, 364.8% for AGIs $100k-200k, 1193.7% for AGIs over 200k)
Ordinary dividends: $8,655 (reported on 38.2% of returns)
Here:
$8,655
State:
$8,820
(% of AGI for various income ranges: 73.0% for AGIs below $25k, 161.0% for AGIs $25k-50k, 304.3% for AGIs $50k-75k, 405.2% for AGIs $75k-100k, 993.5% for AGIs $100k-200k, 4266.7% for AGIs over 200k)
Net capital gain/loss in AGI: +$24,381 (reported on 37.3% of returns)
Here:
+$24,381
State:
+$37,276
(% of AGI for various income ranges: 52.9% for AGIs below $25k, 127.5% for AGIs $25k-50k, 242.6% for AGIs $50k-75k, 404.0% for AGIs $75k-100k, 1705.8% for AGIs $100k-200k, 19264.8% for AGIs over 200k)
Profit/loss from business: +$16,161 (reported on 18.6% of returns)
Here:
+$16,161
State:
+$15,295
(% of AGI for various income ranges: 102.1% for AGIs below $25k, 218.8% for AGIs $25k-50k, 297.2% for AGIs $50k-75k, 325.6% for AGIs $75k-100k, 894.3% for AGIs $100k-200k, 3526.7% for AGIs over 200k)
Taxable individual retirement arrangement distribution: $25,442 (reported on 19.1% of returns)
81507:
$25,442
Colorado:
$23,785
(% of AGI for various income ranges: 134.3% for AGIs below $25k, 299.0% for AGIs $25k-50k, 505.0% for AGIs $50k-75k, 833.2% for AGIs $75k-100k, 1841.9% for AGIs $100k-200k, 4240.4% for AGIs over 200k)
Self-employed (Keogh) retirement plans: $25,740 (reported on 1.3% of returns)
81507:
$25,740
Colorado:
$23,633
(% of AGI for various income ranges: 60.9% for AGIs $100k-200k, 775.2% for AGIs over 200k)
Total itemized deductions: $37,089 (reported on 14.5% of returns)
Here:
$37,089
State:
$35,141
(% of AGI for various income ranges: 146.5% for AGIs below $25k, 195.0% for AGIs $25k-50k, 370.1% for AGIs $50k-75k, 745.2% for AGIs $75k-100k, 1460.5% for AGIs $100k-200k, 7643.3% for AGIs over 200k)
Charity contributions: $14,420 (reported on 12.1% of returns)
Here:
$14,420
State:
$12,103
(% of AGI for various income ranges: 7.2% for AGIs below $25k, 28.3% for AGIs $25k-50k, 57.4% for AGIs $50k-75k, 124.0% for AGIs $75k-100k, 409.5% for AGIs $100k-200k, 3321.1% for AGIs over 200k)
Taxes paid: $7,688 (reported on 14.4% of returns)
81507:
$7,688
State:
$7,710
(% of AGI for various income ranges: 16.6% for AGIs below $25k, 26.6% for AGIs $25k-50k, 58.7% for AGIs $50k-75k, 144.6% for AGIs $75k-100k, 366.7% for AGIs $100k-200k, 1538.5% for AGIs over 200k)
Earned income credit: $1,892 (reported on 6.4% of returns)
Here:
$1,892
State:
$2,053
(% of AGI for various income ranges: 49.5% for AGIs below $25k, 40.4% for AGIs $25k-50k)
Percentage of individuals using paid preparers for their 2020 taxes: 92.2%
Here:
92%
State:
93%
(% for various income ranges: 89.5% for AGIs below $25k, 92.4% for AGIs $25k-50k, 90.9% for AGIs $50k-75k, 92.0% for AGIs $75k-100k, 93.3% for AGIs $100k-200k, 96.7% for AGIs over 200k)
Averages for the 2012 tax year for zip code 81507, filed in 2013:
Average Adjusted Gross Income (AGI) in 2012: $90,229 (Individual Income Tax Returns)
Here:
$90,229
State:
$69,103
Salary/wage: $64,892 (reported on 75.3% of returns)
Here:
$64,892
State:
$54,794
(% of AGI for various income ranges: 67.1% for AGIs below $25k, 62.9% for AGIs $25k-50k, 60.1% for AGIs $50k-75k, 58.8% for AGIs $75k-100k, 63.8% for AGIs $100k-200k, 41.1% for AGIs over 200k)
Taxable interest for individuals: $2,334 (reported on 49.4% of returns)
This zip code:
$2,334
Colorado:
$1,971
(% of AGI for various income ranges: 2.6% for AGIs below $25k, 1.7% for AGIs $25k-50k, 1.4% for AGIs $50k-75k, 1.2% for AGIs $75k-100k, 1.2% for AGIs $100k-200k, 1.1% for AGIs over 200k)
Ordinary dividends: $7,386 (reported on 36.5% of returns)
Here:
$7,386
State:
$7,140
(% of AGI for various income ranges: 5.0% for AGIs below $25k, 2.6% for AGIs $25k-50k, 2.6% for AGIs $50k-75k, 2.9% for AGIs $75k-100k, 2.7% for AGIs $100k-200k, 3.2% for AGIs over 200k)
Net capital gain/loss in AGI: +$27,279 (reported on 32.5% of returns)
Here:
+$27,279
State:
+$23,009
(% of AGI for various income ranges: 0.5% for AGIs $25k-50k, 0.7% for AGIs $50k-75k, 1.5% for AGIs $75k-100k, 2.9% for AGIs $100k-200k, 22.8% for AGIs over 200k)
Profit/loss from business: +$16,015 (reported on 18.5% of returns)
Here:
+$16,015
State:
+$13,514
(% of AGI for various income ranges: 6.1% for AGIs below $25k, 4.7% for AGIs $25k-50k, 3.0% for AGIs $50k-75k, 2.7% for AGIs $75k-100k, 3.0% for AGIs $100k-200k, 3.2% for AGIs over 200k)
Taxable individual retirement arrangement distribution: $17,922 (reported on 19.2% of returns)
81507:
$17,922
Colorado:
$17,927
(% of AGI for various income ranges: 6.3% for AGIs below $25k, 5.9% for AGIs $25k-50k, 5.4% for AGIs $50k-75k, 5.5% for AGIs $75k-100k, 4.1% for AGIs $100k-200k, 2.0% for AGIs over 200k)
Self-employment retirement plans: $21,060 (reported on 1.4% of returns)
81507:
$21,060
Colorado:
$19,483
(% of AGI for various income ranges: 0.6% for AGIs $25k-50k, 0.2% for AGIs $100k-200k, 0.6% for AGIs over 200k)
Total itemized deductions: $25,516 (17% of AGI, reported on 46.7% of returns)
Here:
$25,516
State:
$24,621
Here:
17.3% of AGI
State:
18.5% of AGI
(% of AGI for various income ranges: 18.6% for AGIs below $25k, 15.2% for AGIs $25k-50k, 15.2% for AGIs $50k-75k, 15.0% for AGIs $75k-100k, 14.5% for AGIs $100k-200k, 10.2% for AGIs over 200k)
Charity contributions: $5,175 (reported on 38.9% of returns)
Here:
$5,175
State:
$4,449
(% of AGI for various income ranges: 1.7% for AGIs below $25k, 1.5% for AGIs $25k-50k, 1.9% for AGIs $50k-75k, 2.3% for AGIs $75k-100k, 2.4% for AGIs $100k-200k, 2.3% for AGIs over 200k)
Taxes paid: $8,185 (reported on 46.5% of returns)
81507:
$8,185
State:
$7,641
(% of AGI for various income ranges: 2.7% for AGIs below $25k, 2.5% for AGIs $25k-50k, 3.0% for AGIs $50k-75k, 3.7% for AGIs $75k-100k, 4.4% for AGIs $100k-200k, 5.0% for AGIs over 200k)
Earned income credit: $1,668 (reported on 8.4% of returns)
Here:
$1,668
State:
$2,095
(% of AGI for various income ranges: 3.0% for AGIs below $25k, 0.7% for AGIs $25k-50k)
Percentage of individuals using paid preparers for their 2012 taxes: 55.6%
Here:
56%
State:
49%
(% for various income ranges: 46.2% for AGIs below $25k, 52.1% for AGIs $25k-50k, 57.3% for AGIs $50k-75k, 54.9% for AGIs $75k-100k, 62.3% for AGIs $100k-200k, 80.8% for AGIs over 200k)
Household received Food Stamps/SNAP in the past 12 months: 72 Household did not receive Food Stamps/SNAP in the past 12 months: 6,823
Women who had a birth in the past 12 months: 69 (71 now married, 0 unmarried) Women who did not have a birth in the past 12 months: 2,682 (1,444 now married, 1,231 unmarried)
Housing units in zip code 81507 with a mortgage: 3,751 (388 second mortgage, 352 both second mortgage and home equity loan) Houses without a mortgage: 66
Median monthly owner costs for units with a mortgage: $1,894 Median monthly owner costs for units without a mortgage: $434
Residents with income below the poverty level in 2022:
This zip code:
4.8%
Whole state:
9.4%
Residents with income below 50% of the poverty level in 2022:
This zip code:
2.3%
Whole state:
4.6%
Median number of rooms in houses and condos:
Here:
6.8
State:
6.8
Median number of rooms in apartments:
Here:
5.3
State:
4.0
Notable locations in this zip code not listed on our city pages
Notable locations in zip code 81507: Devils Kitchen Picnic Area (A), Highland View Overlook (B), Coke Ovens Overlook (C), Book Cliff View (D), Grand View (E), West Entrance Colorado National Monument (F), East Entrance Colorado National Monument (G), Colorado National Monument Headquarters (H), Grand Junction Fire Department Station 5 (I). Display/hide their locations on the map
2,535 married couples with children.
358 single-parent households (189 men, 169 women).
96.9% of residents of 81507 zip code speak English at home.
1.9% of residents speak Spanish at home (64% very well, 27% well, 9% not well).
1.7% of residents speak other Indo-European language at home (83% very well, 17% not well).
0.6% of residents speak Asian or Pacific Island language at home (64% very well, 13% well, 23% not well).
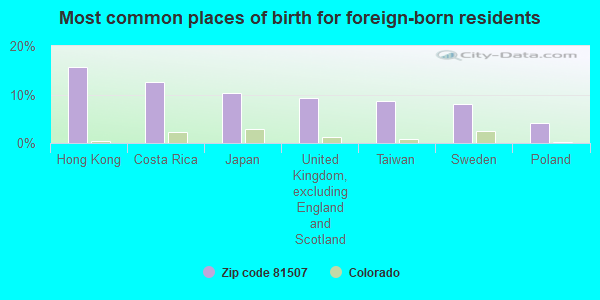
Foreign born population: 317 (1.9%) (89.0% of them are naturalized citizens)
This zip code:
1.9%
Whole state:
9.5%
16%Hong Kong
13%Costa Rica
10%Japan
9%United Kingdom, excluding England and Scotland
9%Taiwan
8%Sweden
4%Poland
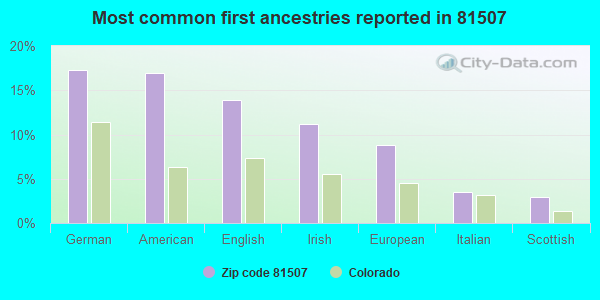
17%German
17%American
14%English
11%Irish
9%European
3%Italian
3%Scottish
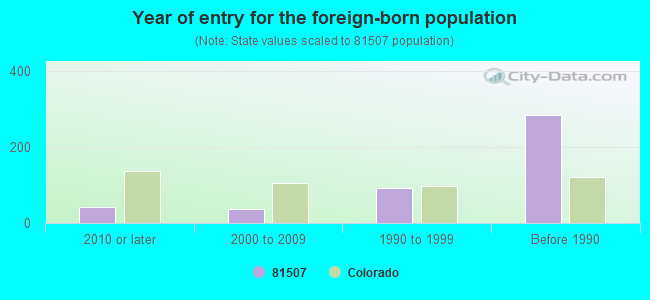
Year of entry for the foreign-born population
432010 or later
372000 to 2009
931990 to 1999
284Before 1990
Housing units lacking complete plumbing facilities: 0.2% Housing units lacking complete kitchen facilities: 0.2%
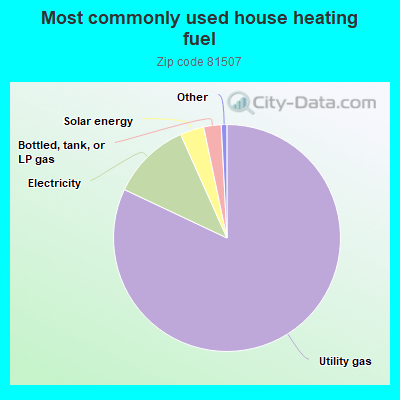
82.1%Utility gas
11.3%Electricity
3.4%Solar energy
2.5%Bottled, tank, or LP gas
Place of birth for U.S.-born residents:
This state: 6,519
Northeast: 1,166
Midwest: 3,227
South: 1,443
West: 3,508
90% of the 81507 zip code residents lived in the same house 1 year ago. Out of people who lived in different houses, 52% moved from this county. Out of people who lived in different houses, 17% moved from different county within same state. Out of people who lived in different houses, 29% moved from different state. Out of people who lived in different houses, 1% moved from abroad.
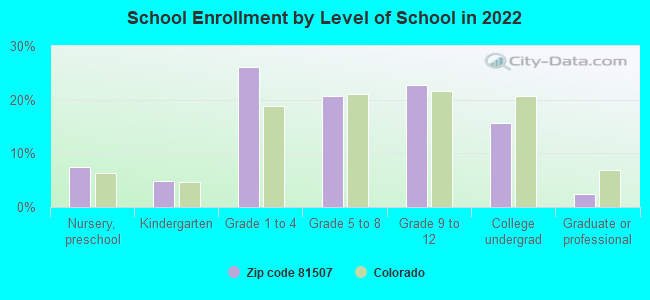
Private vs. public school enrollment:
Students in private schools in grades 1 to 8 (elementary and middle school): 152
Here:
9.6%
Colorado:
11.4%
Students in private schools in grades 9 to 12 (high school): 39
Here:
5.0%
Colorado:
8.5%
Students in private undergraduate colleges: 108
Here:
20.1%
Colorado:
14.0%
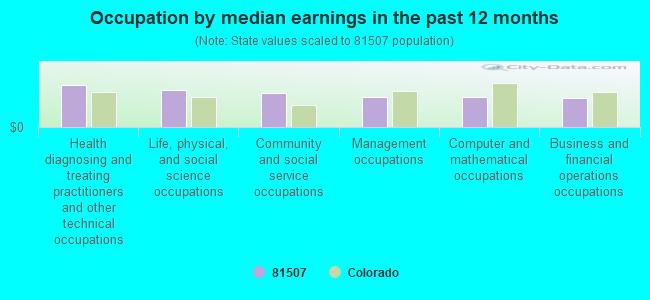
Occupation by median earnings in the past 12 months ($)
110,209Health diagnosing and treating practitioners and other technical occupations
94,826Life, physical, and social science occupations
87,641Community and social service occupations
78,457Management occupations
78,365Computer and mathematical occupations
75,504Business and financial operations occupations
Fatal accident statistics in 2014:
Fatal accident count: 2
Vehicles involved in fatal accidents: 2
Fatal accidents caused by drunken drivers: 2
Fatalities: 2
Persons involved in fatal accidents: 2
Pedestrians involved in fatal accidents: 0
Fatal accident statistics in 2013:
Fatal accident count: 1
Vehicles involved in fatal accidents: 1
Fatal accidents caused by drunken drivers: 0
Fatalities: 1
Persons involved in fatal accidents: 1
Pedestrians involved in fatal accidents: 1
2008 - 2018 National Fire Incident Reporting System (NFIRS) incidents
Based on the data from the years 2008 - 2018 the average number of fire incidents per year is 24. The highest number of fire incidents - 39 took place in 2017, and the least - 0 in 2010. The data has a growing trend.
When looking into fire subcategories, the most reports belonged to: Outside Fires (54.0%), and Structure Fires (30.8%).
Fire incident types reported to NFIRS in Zip Code 81507


 Based on the data from the years 2008 - 2018 the average number of fire incidents per year is 24. The highest number of fire incidents - 39 took place in 2017, and the least - 0 in 2010. The data has a growing trend.
 When looking into fire subcategories, the most reports belonged to: Outside Fires (54.0%), and Structure Fires (30.8%).