Estimated zip code population in 2022: 1,132 Zip code population in 2010: 979 Zip code population in 2000: 861
Houses and condos: 507 Renter-occupied apartments: 83
% of renters here:
19%
State:
34%
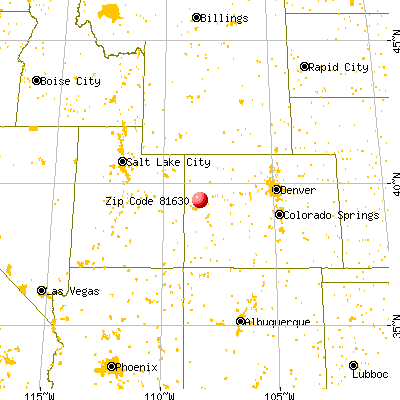
March 2022 cost of living index in zip code 81630: 92.9 (less than average, U.S. average is 100)
Land area: 1274.2 sq. mi. Water area: 1.3 sq. mi.
Population density: 0.888 people per square mile
(very low).
OSM Map
General Map
Google Map
MSN Map
OSM Map
General Map
Google Map
MSN Map
OSM Map
General Map
Google Map
MSN Map
OSM Map
General Map
Google Map
MSN Map
Please wait while loading the map...
Real estate property taxes paid for housing units in 2022:
This zip code:
0.3% ($809)
Colorado:
0.5% ($2,422)
Median real estate property taxes paid for housing units with mortgages in 2022: $895 (0.3%) Median real estate property taxes paid for housing units with no mortgage in 2022: $606 (0.2%)
Business Search- 14 Million verified businesses
Males: 592
(52.3%)
Females: 539
(47.7%)
For population 25 years and over in 81630:
High school or higher: 86.5%
Bachelor's degree or higher: 20.9%
Graduate or professional degree: 11.9%
Unemployed: 4.3%
Mean travel time to work (commute): 40.1 minutes
For population 15 years and over in 81630:
Never married: 18.9%
Now married: 63.2%
Separated: 1.7%
Widowed: 4.2%
Divorced: 12.0%
Zip code 81630 compared to state average:
Median house value below state average.
Black race population percentage significantly below state average.
Hispanic race population percentage below state average.
Median age above state average.
Foreign-born population percentage significantly below state average.
Renting percentage below state average.
Length of stay since moving in significantly above state average.
Percentage of population with a bachelor's degree or higher significantly below state average.
Averages for the 2020 tax year for zip code 81630, filed in 2021:
Average Adjusted Gross Income (AGI) in 2020: $54,993 (Individual Income Tax Returns)
Here:
$54,993
State:
$89,260
Salary/wage: $49,697 (reported on 83.3% of returns)
Here:
$49,697
State:
$70,330
(% of AGI for various income ranges: 1094.0% for AGIs below $25k, 3668.2% for AGIs $25k-50k, 6017.5% for AGIs $50k-75k, 11120.0% for AGIs $75k-100k, 16305.0% for AGIs $100k-200k)
Taxable interest for individuals: $612 (reported on 19.0% of returns)
This zip code:
$612
Colorado:
$2,176
(% of AGI for various income ranges: 1.0% for AGIs below $25k, 4.5% for AGIs $25k-50k, 65.0% for AGIs $50k-75k, 42.5% for AGIs $100k-200k)
Ordinary dividends: $1,175 (reported on 9.5% of returns)
Here:
$1,175
State:
$8,820
(% of AGI for various income ranges: 117.5% for AGIs $50k-75k)
Net capital gain/loss in AGI: +$2,867 (reported on 14.3% of returns)
Here:
+$2,867
State:
+$37,276
(% of AGI for various income ranges: 17.0% for AGIs below $25k, 387.5% for AGIs $50k-75k)
Profit/loss from business: +$3,833 (reported on 14.3% of returns)
Here:
+$3,833
State:
+$15,295
(% of AGI for various income ranges: 82.0% for AGIs below $25k, 120.0% for AGIs $25k-50k, 40.0% for AGIs $50k-75k)
Earned income credit: $2,475 (reported on 19.0% of returns)
Here:
$2,475
State:
$2,053
(% of AGI for various income ranges: 114.0% for AGIs below $25k, 76.4% for AGIs $25k-50k)
Percentage of individuals using paid preparers for their 2020 taxes: 92.9%
Here:
93%
State:
93%
(% for various income ranges: 85.7% for AGIs below $25k, 92.3% for AGIs $25k-50k, 100.0% for AGIs $50k-75k, 100.0% for AGIs $75k-100k, 100.0% for AGIs $100k-200k)
Averages for the 2012 tax year for zip code 81630, filed in 2013:
Average Adjusted Gross Income (AGI) in 2012: $62,554 (Individual Income Tax Returns)
Here:
$62,554
State:
$69,103
Salary/wage: $49,439 (reported on 84.6% of returns)
Here:
$49,439
State:
$54,794
(% of AGI for various income ranges: 71.6% for AGIs below $25k, 80.8% for AGIs $25k-50k, 84.5% for AGIs $50k-75k, 84.4% for AGIs $75k-100k, 51.5% for AGIs $100k-200k)
Taxable interest for individuals: $411 (reported on 23.1% of returns)
This zip code:
$411
Colorado:
$1,971
(% of AGI for various income ranges: 1.3% for AGIs below $25k, 0.2% for AGIs $50k-75k)
Ordinary dividends: $1,480 (reported on 12.8% of returns)
Here:
$1,480
State:
$7,140
Net capital gain/loss in AGI: +$600 (reported on 7.7% of returns)
Here:
+$600
State:
+$23,009
Profit/loss from business: +$11,967 (reported on 15.4% of returns)
Here:
+$11,967
State:
+$13,514
(% of AGI for various income ranges: 9.4% for AGIs below $25k, 2.0% for AGIs $25k-50k, 14.1% for AGIs $75k-100k)
Total itemized deductions: $21,175 (20% of AGI, reported on 30.8% of returns)
Here:
$21,175
State:
$24,621
Here:
20.0% of AGI
State:
18.5% of AGI
(% of AGI for various income ranges: 26.6% for AGIs $25k-50k, 15.0% for AGIs $75k-100k, 9.3% for AGIs $100k-200k)
Charity contributions: $2,886 (reported on 17.9% of returns)
Here:
$2,886
State:
$4,449
Taxes paid: $4,692 (reported on 30.8% of returns)
81630:
$4,692
State:
$7,641
(% of AGI for various income ranges: 3.5% for AGIs $25k-50k, 3.2% for AGIs $75k-100k, 2.8% for AGIs $100k-200k)
Earned income credit: $2,183 (reported on 15.4% of returns)
Here:
$2,183
State:
$2,095
(% of AGI for various income ranges: 8.1% for AGIs below $25k)
Percentage of individuals using paid preparers for their 2012 taxes: 53.8%
Here:
54%
State:
49%
(% for various income ranges: 50.0% for AGIs below $25k, 44.4% for AGIs $25k-50k, 66.7% for AGIs $50k-75k, 50.0% for AGIs $75k-100k, 66.7% for AGIs $100k-200k)
Averages for the 2004 tax year for zip code 81630, filed in 2005:
Average Adjusted Gross Income (AGI) in 2004: $41,517 (Individual Income Tax Returns)
Here:
$41,517
State:
$55,014
Salary/wage: $37,346 (reported on 86.2% of returns)
Here:
$37,346
State:
$46,010
(% of AGI for various income ranges: 105.0% for AGIs below $10k, 74.6% for AGIs $10k-25k, 88.2% for AGIs $25k-50k, 92.1% for AGIs $50k-75k, 71.3% for AGIs $75k-100k, 45.5% for AGIs over 100k)
Taxable interest for individuals: $1,127 (reported on 30.4% of returns)
This zip code:
$1,127
Colorado:
$2,127
(% of AGI for various income ranges: 6.8% for AGIs below $10k, 4.6% for AGIs $10k-25k, 0.2% for AGIs $25k-50k, 0.2% for AGIs $50k-75k, 1.6% for AGIs $75k-100k)
Taxable dividends: $920 (reported on 13.8% of returns)
Here:
$920
State:
$3,782
Net capital gain/loss: +$1,786 (reported on 15.5% of returns)
Here:
+$1,786
State:
+$17,882
(% of AGI for various income ranges: -1.4% for AGIs below $10k, 0.8% for AGIs $25k-50k, 0.2% for AGIs $50k-75k, 2.6% for AGIs $75k-100k)
Profit/loss from business: +$1,877 (reported on 18.0% of returns)
Here:
+$1,877
State:
+$11,247
Total itemized deductions: $16,488 (25% of AGI, reported on 34.0% of returns)
Here:
$16,488
State:
$20,560
Here:
24.8% of AGI
State:
21.4% of AGI
(% of AGI for various income ranges: 19.9% for AGIs $10k-25k, 12.1% for AGIs $25k-50k, 15.4% for AGIs $50k-75k, 13.5% for AGIs $75k-100k, 11.0% for AGIs over 100k)
Charity contributions deductions: $1,862 (3% of AGI, reported on 24.0% of returns)
Here:
$1,862
State:
$3,518
Here:
2.7% of AGI
State:
3.4% of AGI
(% of AGI for various income ranges: 4.5% for AGIs below $10k, 0.7% for AGIs $25k-50k, 1.1% for AGIs $50k-75k, 3.1% for AGIs $75k-100k)
Total tax: $5,277 (reported on 72.9% of returns)
81630:
$5,277
State:
$9,173
(% of AGI for various income ranges: 3.2% for AGIs below $10k, 3.5% for AGIs $10k-25k, 5.7% for AGIs $25k-50k, 7.7% for AGIs $50k-75k, 10.8% for AGIs $75k-100k, 18.1% for AGIs over 100k)
Earned income credit: $1,549 (reported on 14.1% of returns)
Here:
$1,549
State:
$1,595
Percentage of individuals using paid preparers for their 2004 taxes: 63.3%
Here:
63%
State:
55%
(% for various income ranges: 54.4% for AGIs below $10k, 63.9% for AGIs $10k-25k, 63.3% for AGIs $25k-50k, 71.0% for AGIs $50k-75k, 55.2% for AGIs $75k-100k, 80.0% for AGIs over 100k)
Likely homosexual households (counted as self-reported same-sex unmarried-partner households)
Lesbian couples: 0.3% of all households
Gay men: 0.0% of all households
Household received Food Stamps/SNAP in the past 12 months: 73 Household did not receive Food Stamps/SNAP in the past 12 months: 374
Women who had a birth in the past 12 months: 6 (2 now married, 3 unmarried) Women who did not have a birth in the past 12 months: 193 (131 now married, 60 unmarried)
Housing units in zip code 81630 with a mortgage: 201 (3 second mortgage) Houses without a mortgage: 5
Median monthly owner costs for units with a mortgage: $1,495 Median monthly owner costs for units without a mortgage: $391
Residents with income below the poverty level in 2022:
This zip code:
11.2%
Whole state:
9.4%
Residents with income below 50% of the poverty level in 2022:
This zip code:
9.3%
Whole state:
4.6%
Median number of rooms in houses and condos:
Here:
5.4
State:
6.8
Median number of rooms in apartments:
Here:
4.3
State:
4.0
Notable locations in this zip code not listed on our city pages
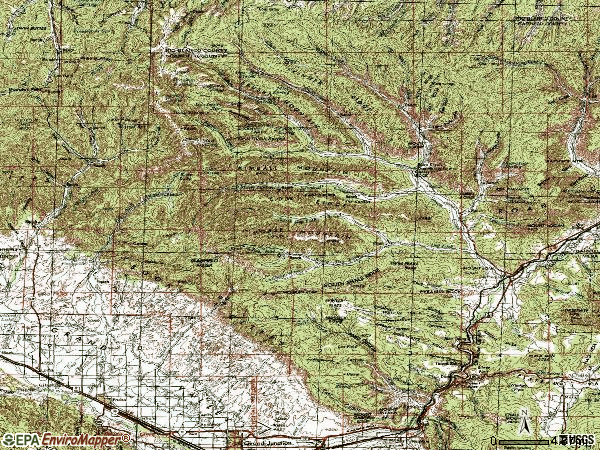
Notable locations in zip code 81630: Young Ranch (A), Cuddy Ranch (B), Roan Creek Community Center (C), Snipes Corral (D), Tunnel (E), Harris Homestead (F), Eddington Homestead (G), U C Cow Camp (H), Square S Ranch (I), Hill Cow Camp (J), Altenbern Ranch (K), De Beque Fire Protection District (L). Display/hide their locations on the map
Lakes and reservoirs: McAndrews Lake (A), Baxter Reservoir (B), Echo Lake (C), Sunnyside Reservoir (D), Piute Reservoir (E), De Beque Reservoir (F), Baugh Reservoir (G), Pine Trail Reservoir (H). Display/hide their locations on the map
Streams, rivers, and creeks: Horsethief Creek (A), Munger Creek (B), Corcoran Wash (C), Tourist Run (D), Roan Creek (E), Logan Wash (F), Conn Creek (G), South Dry Fork (H), Clear Creek (I). Display/hide their locations on the map
Size of family households: 167 2-persons, 45 3-persons, 34 4-persons, 42 5-persons, 10 6-persons, 4 7-or-more-persons
Size of nonfamily households: 109 1-person, 28 2-persons
118 married couples with children.
21 single-parent households (5 men, 16 women).
98.3% of residents of 81630 zip code speak English at home.
1.8% of residents speak Spanish at home (84% very well, 16% not well).
0.2% of residents speak other Indo-European language at home (50% very well, 50% well).
Foreign born population: 21 (1.9%) (44.0% of them are naturalized citizens)
This zip code:
1.9%
Whole state:
9.5%
38%Costa Rica
38%Honduras
14%United Kingdom, excluding England and Scotland
10%Sweden
5%France
25%English
14%German
11%American
8%Irish
5%Italian
4%Polish
3%Norwegian
Year of entry for the foreign-born population
22010 or later
72000 to 2009
21990 to 1999
13Before 1990
Facilities with environmental interests located in this zip code:
DAVID FURR (6601 COUNTY RD 200 in DE BEQUE, CO)
ENFORCEMENT/COMPLIANCE ACTIVITY (Integrated Compliance Information System) - ICIS-08-2001-0157, FORMAL ENFORCEMENT ACTION (Integrated Compliance Information System) - ICIS-08-2001-0157, FORMAL ENFORCEMENT ACTION
BLACK MOUNTAIN DISPOSAL FACILITY (1551 COUNTY ROAD 45.5 in DEBEQUE, 7.3 MI S OF, CO)
AIR MINOR (AIRS/AFS) STATE MASTER (Colorado database) - SWMS-077-LFL-010, REFUSE DISPOSAL CRITERIA AND HAZARDOUS AIR POLLUTANT INVENTORY (Inventory of air pollution sources) Business SIC classification: SANITARY SERVICES
CHEVRON OIL SHALE (DE BEQUE RD 211 in DE BEQUE, CO)
AIR MINOR (AIRS/AFS) CRITERIA AND HAZARDOUS AIR POLLUTANT INVENTORY (Inventory of air pollution sources) (Resource Conservation and Recovery Act (tracking hazardous waste)) Business SIC classification: CYCLIC ORGANIC CRUDES AND INTERMEDIATES, AND ORGANIC DYES AND PIGMENTS Organizations: CHEVRON SHALE OIL CO (CONTACT/OWNER)
Alternative names: CHEVRON SHALE OIL SEMIWORKS PROJECT
BRONCCO FLATS COMPRESSOR STA (SECT 29 TWNSHP 8 S RANGE 97 W in DEBEQUE, CO)
Conditionally Exempt Small Quantity Generators, less than 100 kg/month of hazardous waste (Resource Conservation and Recovery Act (tracking hazardous waste)) - notification Organizations: TBI FIELD SERVICES (CONTACT/OWNER)
, CANYON GAS RESOURCES INC (CONTACT/OWNER)
, WILLIAMS FIELD SERVICES (CONTACT/OWNER)
Alternative names: WEP BRONCCO FLATS COMPRESSOR
CANYON GAS RESOURCES, INC. - MESA CTY #3 (SEC 21 T8S R97W in DEBEQUE, CO)
AIR MINOR (AIRS/AFS) CRITERIA AND HAZARDOUS AIR POLLUTANT INVENTORY (Inventory of air pollution sources) Business SIC classification: CRUDE PETROLEUM AND NATURAL GAS
CHEVRON OIL SHALE (S.E. OF DEBEQUE in DE BEQUE, CO)
AIR MINOR (AIRS/AFS) Business SIC classification: CRUDE PETROLEUM AND NATURAL GAS
GASCO INC ROBERTS CANYON NO 2 (NESW SEC 36 T9S R97W in DEBEQUE, 7.3 MI S OF, CO)
AIR MINOR (AIRS/AFS) Business SIC classification: CRUDE PETROLEUM AND NATURAL GAS Alternative names: GASCO INCORPORATED ROBERTS CANYON NUMBER 2
CDOT DE BEQUE ROAD MAINTENANCE FACILITY (4615 HWY 6 in DE BEQUE, CO)
ENFORCEMENT/COMPLIANCE ACTIVITY (Integrated Compliance Information System)
HIGH LONESOME LODGE (0275 222 ROAD in DEBEQUE, CO)
ENFORCEMENT/COMPLIANCE ACTIVITY (Integrated Compliance Information System)
Housing units lacking complete plumbing facilities: 3.7% Housing units lacking complete kitchen facilities: 2.3%
47.9%Utility gas
20.9%Bottled, tank, or LP gas
15.2%Electricity
12.6%Wood
1.7%Solar energy
1.4%No fuel used
0.9%Other fuel
Population in 1990: 464. Population change in the 1990s: +397 (+85.6%).
Place of birth for U.S.-born residents:
This state: 669
Northeast: 42
Midwest: 100
South: 98
West: 192
45% of the 81630 zip code residents lived in the same house 5 years ago. Out of people who lived in different houses, 50% lived in this county. Out of people who lived in different counties, 50% lived in Colorado.
91% of the 81630 zip code residents lived in the same house 1 year ago. Out of people who lived in different houses, 54% moved from this county. Out of people who lived in different houses, 32% moved from different county within same state. Out of people who lived in different houses, 12% moved from different state. Out of people who lived in different houses, 1% moved from abroad.
Private vs. public school enrollment:
Students in private schools in grades 1 to 8 (elementary and middle school): 15
Here:
11.8%
Colorado:
11.4%
Students in private schools in grades 9 to 12 (high school):
Here:
0.0%
Colorado:
8.5%
Students in private undergraduate colleges:
Here:
0.0%
Colorado:
14.0%
Occupation by median earnings in the past 12 months ($)
73,760Production occupations
68,256Health technologists and technicians
67,352Computer and mathematical occupations
59,323Management occupations
56,053Construction and extraction occupations
54,572Education, training, and library occupations
Top industries in this zip code by the number of employees in 2005:
Accommodation and Food Services: Recreational and Vacation Camps (except Campgrounds) (10-19 employees: 1 establishment)
Health Care and Social Assistance: Offices of Physicians (except Mental Health Specialists) (10-19: 1)
Mining: Support Activities for Oil and Gas Operations (5-9: 1, 1-4: 2)
Other Services (except Public Administration): Coin-Operated Laundries and Drycleaners (5-9: 1)
Construction: Drywall and Insulation Contractors (5-9: 1)
Other Services (except Public Administration): Religious Organizations (1-4: 1)
People in group quarters in 2010:
2 people in workers' group living quarters and job corps centers
Fatal accident statistics in 2013:
Fatal accident count: 3
Vehicles involved in fatal accidents: 3
Fatal accidents caused by drunken drivers: 2
Fatalities: 4
Persons involved in fatal accidents: 4
Pedestrians involved in fatal accidents: 0
Fatal accident statistics in 2011:
Fatal accident count: 2
Vehicles involved in fatal accidents: 2
Fatal accidents caused by drunken drivers: 2
Fatalities: 2
Persons involved in fatal accidents: 2
Pedestrians involved in fatal accidents: 0
Home Mortgage Disclosure Act Aggregated Statistics For Year 2009 (Based on 4 partial tracts)
A) FHA, FSA/RHS & VA Home Purchase Loans
B) Conventional Home Purchase Loans
C) Refinancings
D) Home Improvement Loans
F) Non-occupant Loans on < 5 Family Dwellings (A B C & D)
G) Loans On Manufactured Home Dwelling (A B C & D)
Number
Average Value
Number
Average Value
Number
Average Value
Number
Average Value
Number
Average Value
Number
Average Value
LOANS ORIGINATED
8
$194,321
4
$344,088
67
$234,027
4
$153,248
7
$281,240
11
$167,441
APPLICATIONS APPROVED, NOT ACCEPTED
0
$0
1
$75,420
6
$196,163
0
$0
1
$230,590
0
$0
APPLICATIONS DENIED
3
$272,707
4
$170,062
27
$231,998
3
$115,137
3
$171,343
6
$145,162
APPLICATIONS WITHDRAWN
0
$0
1
$336,760
14
$240,715
1
$178,230
1
$273,350
2
$159,010
FILES CLOSED FOR INCOMPLETENESS
0
$0
0
$0
3
$227,390
0
$0
0
$0
0
$0
Aggregated Statistics For Year 2008 (Based on 4 partial tracts)
A) FHA, FSA/RHS & VA Home Purchase Loans
B) Conventional Home Purchase Loans
C) Refinancings
D) Home Improvement Loans
F) Non-occupant Loans on < 5 Family Dwellings (A B C & D)
G) Loans On Manufactured Home Dwelling (A B C & D)
Number
Average Value
Number
Average Value
Number
Average Value
Number
Average Value
Number
Average Value
Number
Average Value
LOANS ORIGINATED
12
$211,296
10
$203,209
41
$223,503
3
$136,113
12
$184,834
13
$180,668
APPLICATIONS APPROVED, NOT ACCEPTED
2
$253,650
1
$317,540
5
$214,162
1
$15,850
2
$130,910
2
$243,080
APPLICATIONS DENIED
2
$344,205
5
$140,084
24
$236,257
5
$105,112
4
$283,435
7
$106,786
APPLICATIONS WITHDRAWN
1
$239,720
5
$233,858
10
$311,203
2
$151,325
1
$76,380
1
$139,320
FILES CLOSED FOR INCOMPLETENESS
0
$0
0
$0
1
$245,000
0
$0
0
$0
0
$0
Aggregated Statistics For Year 2007 (Based on 4 partial tracts)
A) FHA, FSA/RHS & VA Home Purchase Loans
B) Conventional Home Purchase Loans
C) Refinancings
D) Home Improvement Loans
F) Non-occupant Loans on < 5 Family Dwellings (A B C & D)
G) Loans On Manufactured Home Dwelling (A B C & D)
Number
Average Value
Number
Average Value
Number
Average Value
Number
Average Value
Number
Average Value
Number
Average Value
LOANS ORIGINATED
7
$174,249
29
$233,474
43
$208,281
5
$49,386
10
$162,087
15
$155,746
APPLICATIONS APPROVED, NOT ACCEPTED
0
$0
10
$176,883
5
$278,728
0
$0
0
$0
3
$135,473
APPLICATIONS DENIED
1
$220,500
10
$166,170
28
$189,827
6
$88,953
4
$178,710
8
$121,001
APPLICATIONS WITHDRAWN
2
$190,480
3
$220,343
9
$242,229
1
$36,030
1
$98,000
1
$301,210
FILES CLOSED FOR INCOMPLETENESS
0
$0
2
$180,630
2
$140,755
0
$0
1
$120,100
0
$0
Aggregated Statistics For Year 2006 (Based on 4 partial tracts)
A) FHA, FSA/RHS & VA Home Purchase Loans
B) Conventional Home Purchase Loans
C) Refinancings
D) Home Improvement Loans
F) Non-occupant Loans on < 5 Family Dwellings (A B C & D)
G) Loans On Manufactured Home Dwelling (A B C & D)
Number
Average Value
Number
Average Value
Number
Average Value
Number
Average Value
Number
Average Value
Number
Average Value
LOANS ORIGINATED
9
$163,817
46
$187,377
41
$179,037
4
$54,405
14
$141,718
13
$150,882
APPLICATIONS APPROVED, NOT ACCEPTED
0
$0
8
$134,752
7
$205,749
1
$125,380
1
$162,860
2
$139,315
APPLICATIONS DENIED
2
$155,170
19
$254,991
27
$191,893
2
$64,375
6
$344,447
12
$138,115
APPLICATIONS WITHDRAWN
2
$135,955
8
$305,474
16
$197,474
0
$0
1
$344,450
2
$160,215
FILES CLOSED FOR INCOMPLETENESS
0
$0
0
$0
3
$158,693
0
$0
0
$0
0
$0
Aggregated Statistics For Year 2005 (Based on 4 partial tracts)
A) FHA, FSA/RHS & VA Home Purchase Loans
B) Conventional Home Purchase Loans
C) Refinancings
D) Home Improvement Loans
F) Non-occupant Loans on < 5 Family Dwellings (A B C & D)
G) Loans On Manufactured Home Dwelling (A B C & D)
Number
Average Value
Number
Average Value
Number
Average Value
Number
Average Value
Number
Average Value
Number
Average Value
LOANS ORIGINATED
7
$121,679
40
$124,316
43
$165,537
2
$39,395
14
$112,036
8
$112,474
APPLICATIONS APPROVED, NOT ACCEPTED
0
$0
5
$185,338
11
$157,265
1
$14,410
2
$131,390
0
$0
APPLICATIONS DENIED
1
$132,590
17
$164,918
29
$182,718
8
$102,745
4
$174,265
5
$100,308
APPLICATIONS WITHDRAWN
1
$214,260
9
$98,962
23
$163,900
1
$171,980
5
$126,730
2
$157,570
FILES CLOSED FOR INCOMPLETENESS
0
$0
0
$0
8
$153,308
0
$0
0
$0
0
$0
Aggregated Statistics For Year 2004 (Based on 4 partial tracts)
A) FHA, FSA/RHS & VA Home Purchase Loans
B) Conventional Home Purchase Loans
C) Refinancings
D) Home Improvement Loans
F) Non-occupant Loans on < 5 Family Dwellings (A B C & D)
G) Loans On Manufactured Home Dwelling (A B C & D)
Number
Average Value
Number
Average Value
Number
Average Value
Number
Average Value
Number
Average Value
Number
Average Value
LOANS ORIGINATED
5
$121,830
29
$121,442
44
$152,451
3
$61,970
12
$120,220
13
$108,682
APPLICATIONS APPROVED, NOT ACCEPTED
0
$0
5
$145,946
10
$167,083
0
$0
1
$113,370
2
$130,910
APPLICATIONS DENIED
3
$159,493
10
$170,254
26
$157,682
2
$109,050
3
$124,583
10
$117,314
APPLICATIONS WITHDRAWN
0
$0
3
$238,280
14
$147,517
1
$151,330
2
$207,295
0
$0
FILES CLOSED FOR INCOMPLETENESS
0
$0
0
$0
3
$238,600
0
$0
0
$0
0
$0
Aggregated Statistics For Year 2003 (Based on 4 partial tracts)
A) FHA, FSA/RHS & VA Home Purchase Loans
B) Conventional Home Purchase Loans
C) Refinancings
D) Home Improvement Loans
F) Non-occupant Loans on < 5 Family Dwellings (A B C & D)
Number
Average Value
Number
Average Value
Number
Average Value
Number
Average Value
Number
Average Value
LOANS ORIGINATED
5
$124,904
30
$150,862
94
$150,002
3
$46,920
16
$140,878
APPLICATIONS APPROVED, NOT ACCEPTED
0
$0
3
$154,047
10
$150,029
0
$0
1
$87,430
APPLICATIONS DENIED
0
$0
12
$143,680
41
$170,600
2
$58,370
4
$150,845
APPLICATIONS WITHDRAWN
0
$0
3
$135,473
24
$323,129
0
$0
2
$77,585
FILES CLOSED FOR INCOMPLETENESS
0
$0
1
$64,850
4
$167,660
0
$0
0
$0
Aggregated Statistics For Year 2002 (Based on 4 partial tracts)
A) FHA, FSA/RHS & VA Home Purchase Loans
B) Conventional Home Purchase Loans
C) Refinancings
D) Home Improvement Loans
F) Non-occupant Loans on < 5 Family Dwellings (A B C & D)
Number
Average Value
Number
Average Value
Number
Average Value
Number
Average Value
Number
Average Value
LOANS ORIGINATED
3
$136,913
20
$150,942
63
$135,480
7
$34,726
8
$123,582
APPLICATIONS APPROVED, NOT ACCEPTED
0
$0
3
$136,433
12
$123,783
0
$0
1
$78,310
APPLICATIONS DENIED
1
$69,180
7
$79,816
29
$133,468
3
$55,887
0
$0
APPLICATIONS WITHDRAWN
0
$0
3
$180,950
19
$143,159
2
$58,610
0
$0
FILES CLOSED FOR INCOMPLETENESS
0
$0
1
$96,560
3
$127,307
0
$0
1
$96,560
Aggregated Statistics For Year 2001 (Based on 4 partial tracts)
A) FHA, FSA/RHS & VA Home Purchase Loans
B) Conventional Home Purchase Loans
C) Refinancings
D) Home Improvement Loans
F) Non-occupant Loans on < 5 Family Dwellings (A B C & D)
Number
Average Value
Number
Average Value
Number
Average Value
Number
Average Value
Number
Average Value
LOANS ORIGINATED
4
$100,042
18
$119,833
58
$131,423
1
$58,130
7
$164,366
APPLICATIONS APPROVED, NOT ACCEPTED
0
$0
3
$146,363
6
$106,088
0
$0
0
$0
APPLICATIONS DENIED
0
$0
8
$89,234
29
$109,862
4
$26,542
2
$153,250
APPLICATIONS WITHDRAWN
1
$158,050
2
$133,550
18
$113,321
0
$0
0
$0
FILES CLOSED FOR INCOMPLETENESS
0
$0
0
$0
4
$114,455
0
$0
0
$0
Aggregated Statistics For Year 2000 (Based on 4 partial tracts)
A) FHA, FSA/RHS & VA Home Purchase Loans
B) Conventional Home Purchase Loans
C) Refinancings
D) Home Improvement Loans
F) Non-occupant Loans on < 5 Family Dwellings (A B C & D)
Number
Average Value
Number
Average Value
Number
Average Value
Number
Average Value
Number
Average Value
LOANS ORIGINATED
4
$89,715
24
$116,917
23
$104,999
7
$36,099
5
$82,436
APPLICATIONS APPROVED, NOT ACCEPTED
0
$0
3
$171,983
7
$98,826
3
$23,540
0
$0
APPLICATIONS DENIED
1
$72,540
8
$90,195
23
$92,968
3
$33,627
1
$92,240
APPLICATIONS WITHDRAWN
1
$46,600
2
$86,470
9
$77,078
1
$40,830
0
$0
FILES CLOSED FOR INCOMPLETENESS
0
$0
1
$139,800
4
$143,880
0
$0
0
$0
Aggregated Statistics For Year 1999 (Based on 2 partial tracts)
A) FHA, FSA/RHS & VA Home Purchase Loans
B) Conventional Home Purchase Loans
C) Refinancings
D) Home Improvement Loans
F) Non-occupant Loans on < 5 Family Dwellings (A B C & D)
Detailed PMIC statistics for the following Tracts:0018.00
2003 - 2018 National Fire Incident Reporting System (NFIRS) incidents
According to the data from the years 2003 - 2018 the average number of fires per year is 12. The highest number of reported fires - 36 took place in 2018, and the least - 0 in 2009. The data has a rising trend.
When looking into fire subcategories, the most incidents belonged to: Outside Fires (65.6%), and Mobile Property/Vehicle Fires (15.6%).
Fire incident types reported to NFIRS in Zip Code 81630


 Nearest zip codes: 81505, 81524, 81506, 81520, 81501, 81504.


 According to the data from the years 2003 - 2018 the average number of fires per year is 12. The highest number of reported fires - 36 took place in 2018, and the least - 0 in 2009. The data has a rising trend.
 When looking into fire subcategories, the most incidents belonged to: Outside Fires (65.6%), and Mobile Property/Vehicle Fires (15.6%).