Estimated zip code population in 2022: 473 Zip code population in 2010: 793 Zip code population in 2000: 718
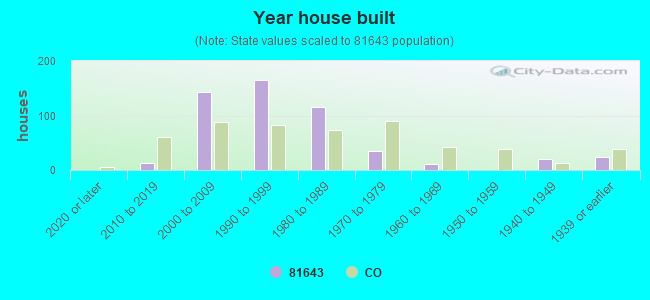
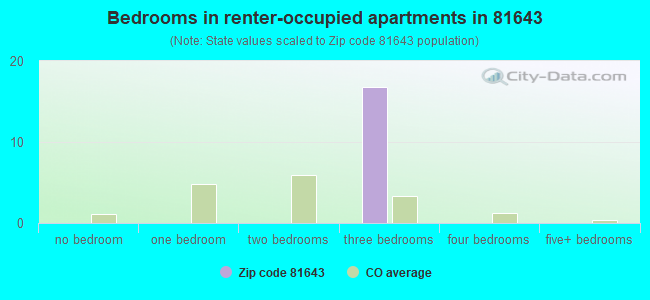
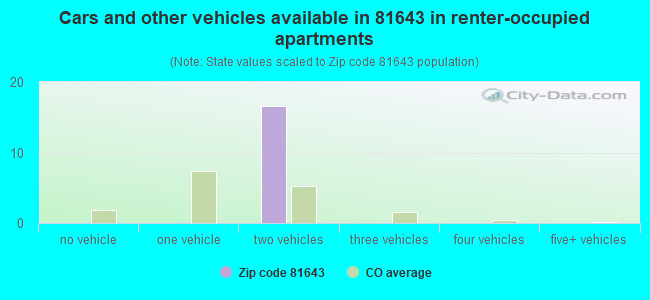
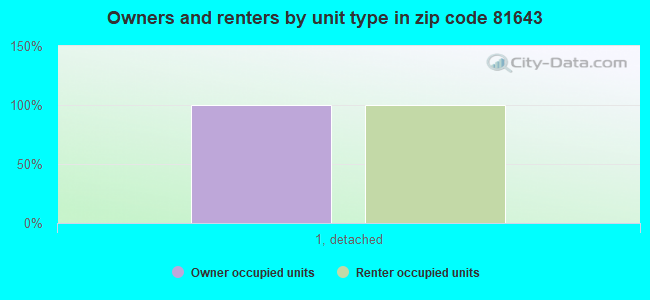
Houses and condos: 551 Renter-occupied apartments: 16
% of renters here:
7%
State:
34%
March 2022 cost of living index in zip code 81643: 93.1 (less than average, U.S. average is 100)
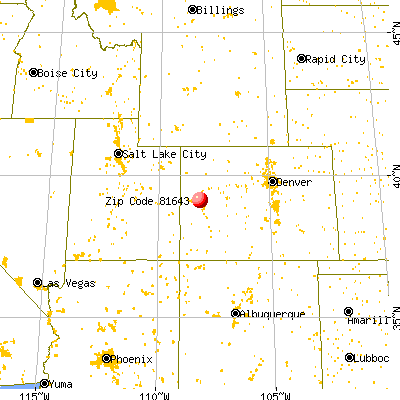
Land area: 216.1 sq. mi. Water area: 0.4 sq. mi.
Population density: 2 people per square mile
(very low).
OSM Map
General Map
Google Map
MSN Map
OSM Map
General Map
Google Map
MSN Map
OSM Map
General Map
Google Map
MSN Map
OSM Map
General Map
Google Map
MSN Map
Please wait while loading the map...
Real estate property taxes paid for housing units in 2022:
This zip code:
0.2% ($1,234)
Colorado:
0.5% ($2,422)
Median real estate property taxes paid for housing units with mortgages in 2022: $1,277 (0.2%) Median real estate property taxes paid for housing units with no mortgage in 2022: $1,210 (0.2%)
Business Search- 14 Million verified businesses
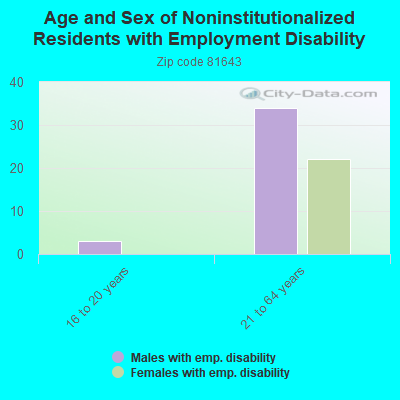
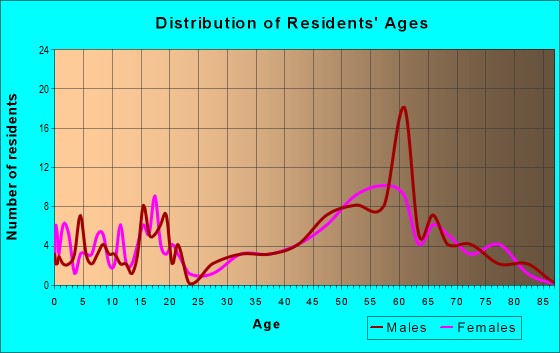
Males: 250
(53.0%)
Females: 222
(47.0%)
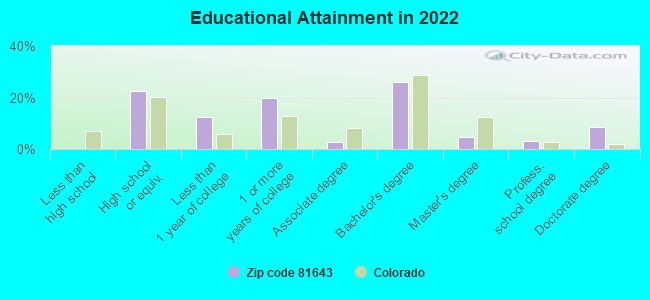
For population 25 years and over in 81643:
High school or higher: 99.7%
Bachelor's degree or higher: 42.3%
Graduate or professional degree: 16.4%
Mean travel time to work (commute): 32.8 minutes
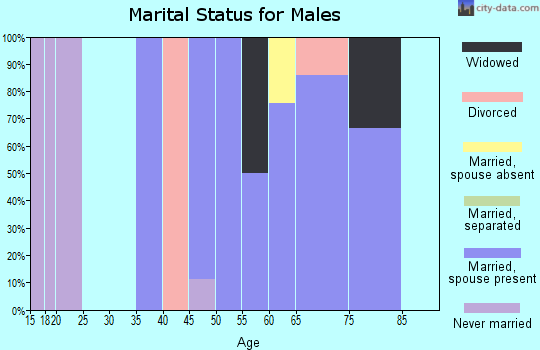
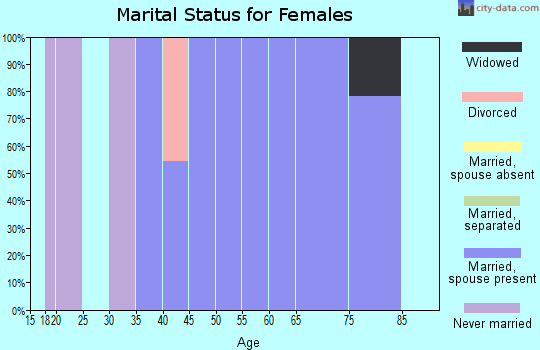
For population 15 years and over in 81643:
Never married: 12.7%
Now married: 72.2%
Separated: 4.7%
Widowed: 6.6%
Divorced: 3.8%
Zip code 81643 compared to state average:
Unemployed percentage significantly below state average.
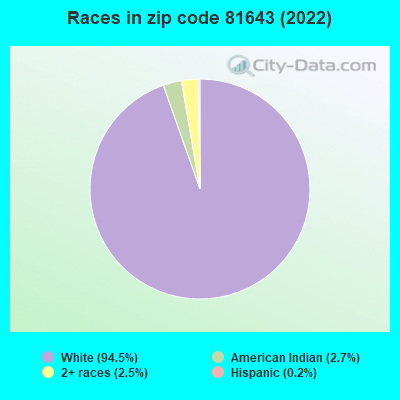
Black race population percentage significantly below state average.
Hispanic race population percentage significantly below state average.
Median age significantly above state average.
Foreign-born population percentage significantly below state average.
Renting percentage significantly below state average.
Length of stay since moving in significantly above state average.
Number of college students significantly below state average.
Averages for the 2004 tax year for zip code 81643, filed in 2005:
Average Adjusted Gross Income (AGI) in 2004: $54,929 (Individual Income Tax Returns)
Here:
$54,929
State:
$55,014
Salary/wage: $38,895 (reported on 79.3% of returns)
Here:
$38,895
State:
$46,010
(% of AGI for various income ranges: 121.6% for AGIs below $10k, 71.8% for AGIs $10k-25k, 75.5% for AGIs $25k-50k, 78.7% for AGIs $50k-75k, 68.2% for AGIs $75k-100k, 33.0% for AGIs over 100k)
Taxable interest for individuals: $1,722 (reported on 52.2% of returns)
This zip code:
$1,722
Colorado:
$2,127
(% of AGI for various income ranges: 12.6% for AGIs below $10k, 1.9% for AGIs $10k-25k, 0.9% for AGIs $25k-50k, 0.5% for AGIs $50k-75k, 2.5% for AGIs $75k-100k, 1.6% for AGIs over 100k)
Taxable dividends: $1,632 (reported on 32.7% of returns)
Here:
$1,632
State:
$3,782
(% of AGI for various income ranges: 4.1% for AGIs below $10k, 2.4% for AGIs $10k-25k, 1.0% for AGIs $25k-50k, 0.3% for AGIs $50k-75k, 0.5% for AGIs $75k-100k, 1.1% for AGIs over 100k)
Net capital gain/loss: +$18,138 (reported on 29.0% of returns)
Here:
+$18,138
State:
+$17,882
(% of AGI for various income ranges: -11.7% for AGIs below $10k, 5.9% for AGIs $25k-50k, 10.0% for AGIs $75k-100k, 16.2% for AGIs over 100k)
Profit/loss from business: +$7,846 (reported on 24.1% of returns)
Here:
+$7,846
State:
+$11,247
(% of AGI for various income ranges: 23.9% for AGIs below $10k, 9.2% for AGIs $10k-25k, 4.4% for AGIs $25k-50k, 11.6% for AGIs $50k-75k)
Total itemized deductions: $17,887 (25% of AGI, reported on 41.0% of returns)
Here:
$17,887
State:
$20,560
Here:
24.6% of AGI
State:
21.4% of AGI
(% of AGI for various income ranges: 25.5% for AGIs $10k-25k, 17.3% for AGIs $25k-50k, 11.1% for AGIs $50k-75k, 20.1% for AGIs $75k-100k, 8.9% for AGIs over 100k)
Charity contributions deductions: $2,692 (4% of AGI, reported on 32.1% of returns)
Here:
$2,692
State:
$3,518
Here:
3.7% of AGI
State:
3.4% of AGI
(% of AGI for various income ranges: 3.3% for AGIs $10k-25k, 1.7% for AGIs $25k-50k, 0.7% for AGIs $50k-75k, 2.4% for AGIs $75k-100k, 1.3% for AGIs over 100k)
Total tax: $8,248 (reported on 75.9% of returns)
81643:
$8,248
State:
$9,173
(% of AGI for various income ranges: 5.0% for AGIs below $10k, 4.8% for AGIs $10k-25k, 6.0% for AGIs $25k-50k, 10.7% for AGIs $50k-75k, 8.7% for AGIs $75k-100k, 15.8% for AGIs over 100k)
Earned income credit: $1,205 (reported on 12.0% of returns)
Here:
$1,205
State:
$1,595
Percentage of individuals using paid preparers for their 2004 taxes: 67.6%
Here:
68%
State:
55%
(% for various income ranges: 54.7% for AGIs below $10k, 60.9% for AGIs $10k-25k, 71.6% for AGIs $25k-50k, 68.2% for AGIs $50k-75k, 68.8% for AGIs $75k-100k, 94.1% for AGIs over 100k)
Household received Food Stamps/SNAP in the past 12 months: 0 Household did not receive Food Stamps/SNAP in the past 12 months: 247
Women who had a birth in the past 12 months: 15 (15 now married, 0 unmarried) Women who did not have a birth in the past 12 months: 23 (4 now married, 18 unmarried)
Housing units in zip code 81643 with a mortgage: 141 (39 second mortgage, 30 both second mortgage and home equity loan) Median monthly owner costs for units with a mortgage: $2,056 Median monthly owner costs for units without a mortgage: $377
Residents with income below the poverty level in 2022:
This zip code:
3.3%
Whole state:
9.4%
Residents with income below 50% of the poverty level in 2022:
This zip code:
3.3%
Whole state:
4.6%
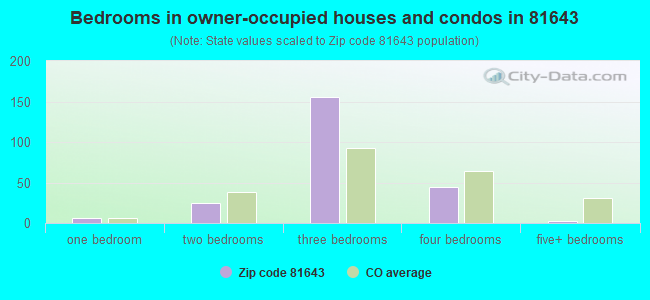
Median number of rooms in houses and condos:
Here:
5.9
State:
6.8
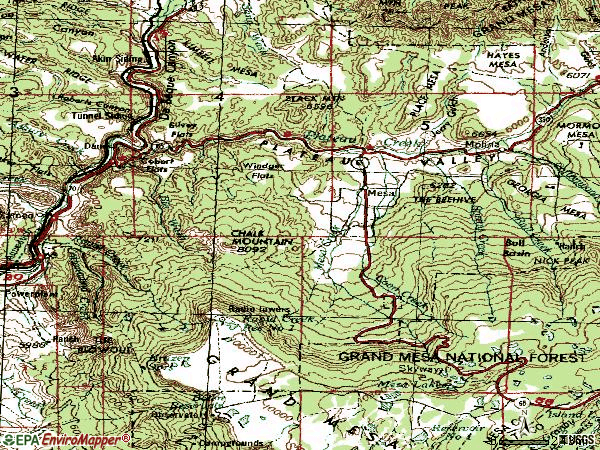
Notable locations in this zip code not listed on our city pages
Notable locations in zip code 81643: Spring Bull Cow Camp (A), Mesa Lake Picnic Area (B), Atwell Homestead (C), Carver Homestead (D), Morris Ranch (E), Meeker Tree (F), Ray Ball Homestead (G), Frank Ball Homestead (H), Halfway House (I), Tanner Homestead (J), Taylor Homestead (K), Colclasure Homestead (L), McKenny Homestead (M), Monroe Homestead (N), Steamboat Rock Campground (O), Wild Rose Picnic Ground (P), Crater View (Q), Kiwanis Youth Camp (R), Jumbo Reservoir Campground (S), Mesa Lakes Ranger Station (T). Display/hide their locations on the map
Lakes and reservoirs: Blue Lake (A), South Mesa Lake (B), Lost Lake (C), Crane Lake (D), Vincent Reservoirs (E), Big Beaver Reservoir (F), Grand Mesa Reservoir Number 6 (G), Hallenbeck Reservoir Number 2 (H). Display/hide their locations on the map
Streams, rivers, and creeks: Sheep Creek (A), Cheever Creek (B), Service Creek (C), East Two Creek (D), West Two Creek (E), Bull Creek (F), Spring Creek (G), Little Wash (H), Coon Creek (I). Display/hide their locations on the map
Size of family households: 175 2-persons, 8 3-persons, 17 4-persons
Size of nonfamily households: 32 1-person, 18 2-persons
21 married couples with children.
36 single-parent households (23 men, 13 women).
101.1% of residents of 81643 zip code speak English at home.
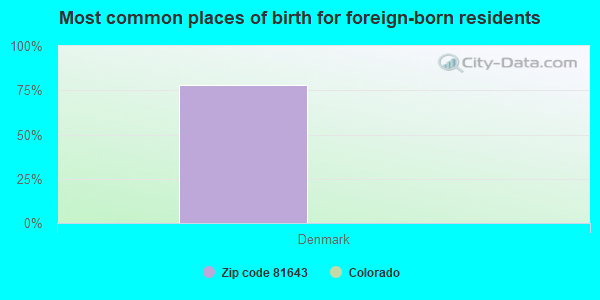
Foreign born population: 9 (2.0%) (100.0% of them are naturalized citizens)
This zip code:
2.0%
Whole state:
9.5%
78%Denmark
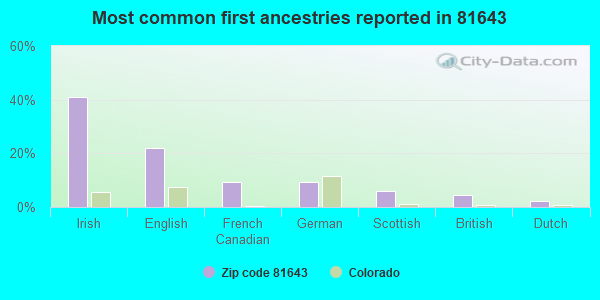
41%Irish
22%English
9%French Canadian
9%German
6%Scottish
4%British
2%Dutch
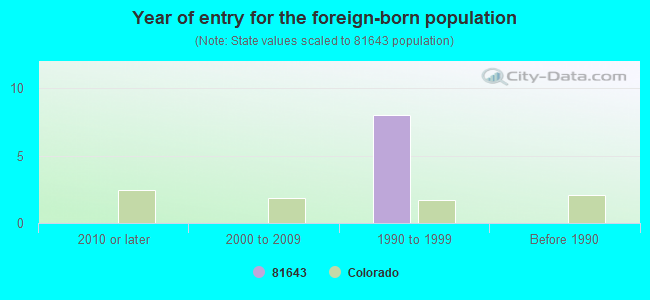
Year of entry for the foreign-born population
02010 or later
02000 to 2009
81990 to 1999
0Before 1990
Major facilities with environmental interests located in this zip code:
CANYON GAS RESOURCES -PREMIER DEBEQUE (NW 1/4 SE 1/4 SEC 29 T8S R97W in MESA, CO)
AIR MINOR (AIRS/AFS) CRITERIA AND HAZARDOUS AIR POLLUTANT INVENTORY (Inventory of air pollution sources) Business SIC classification: CRUDE PETROLEUM AND NATURAL GAS Alternative names: DEBEQUE GATERING L.L.C., DEBEQUE GATERING LIMITED LIABILITY COMPANY, DEBEQUE GATHERING LLC
CURRIER GRAVEL PIT (NW SE SEC 12 T9S R93W in MESA, CO)
AIR MINOR (AIRS/AFS) CRITERIA AND HAZARDOUS AIR POLLUTANT INVENTORY (Inventory of air pollution sources) Business SIC classification: CONSTRUCTION SAND AND GRAVEL
GATEWAY PROCESSING CO BADGER WASH (NW OF MACK in MESA, CO)
AIR MINOR (AIRS/AFS) CRITERIA AND HAZARDOUS AIR POLLUTANT INVENTORY (Inventory of air pollution sources) Business SIC and NAICS classification: CRUDE PETROLEUM AND NATURAL GAS
GENERAL PRODUCTION DEVICES (2322 I70 FRONTAGE RD in MESA, CO)
AIR MINOR (AIRS/AFS) CRITERIA AND HAZARDOUS AIR POLLUTANT INVENTORY (Inventory of air pollution sources) Business SIC classification: SPECIAL INDUSTRY MACHINERY
GIPP GRAVEL (6570 HWY 330 in MESA, CO)
AIR MINOR (AIRS/AFS) CRITERIA AND HAZARDOUS AIR POLLUTANT INVENTORY (Inventory of air pollution sources) Business SIC classification: CONSTRUCTION SAND AND GRAVEL
GRAND JUNCTION PIP & SUPPLY CO (SEC 7 T1S R2E in MESA, CO)
AIR MINOR (AIRS/AFS) CRITERIA AND HAZARDOUS AIR POLLUTANT INVENTORY (Inventory of air pollution sources) Business SIC classification: CONSTRUCTION SAND AND GRAVEL
GRAND JUNCTION PIPE & SUPPLY CO (SEC 20 T1N R2W in MESA, CO)
AIR MINOR (AIRS/AFS) CRITERIA AND HAZARDOUS AIR POLLUTANT INVENTORY (Inventory of air pollution sources) Business SIC classification: CONSTRUCTION SAND AND GRAVEL; INDUSTRIAL SAND
GRAND JUNCTION PIPE & SUPPLY CO (29 ROAD SOUTH OF C 0.5 RD in MESA, CO)
AIR MINOR (AIRS/AFS) CRITERIA AND HAZARDOUS AIR POLLUTANT INVENTORY (Inventory of air pollution sources) Business SIC classification: CONSTRUCTION SAND AND GRAVEL
GRAND JUNCTION PIPE & SUPPLY CO. (NE/4 SEC 25 T2S R1E - HWY 50 in MESA, CO)
AIR MINOR (AIRS/AFS) CRITERIA AND HAZARDOUS AIR POLLUTANT INVENTORY (Inventory of air pollution sources) Business SIC classification: CONSTRUCTION SAND AND GRAVEL
GRAND JUNCTION PIPE & SUPPLY CO. (NE SEC 34 & NW SEC 35 T1N R2W in MESA, CO)
AIR MINOR (AIRS/AFS) CRITERIA AND HAZARDOUS AIR POLLUTANT INVENTORY (Inventory of air pollution sources) Business SIC classification: CONSTRUCTION SAND AND GRAVEL
ALTENBERN & SONS (3875 RD S in MESA CNTY, CO)
AIR MINOR (AIRS/AFS) Business SIC classification: CRUSHED AND BROKEN GRANITE
CALSILITE/JOHNS MANVILLE CORP (NW1/4,NW1/4,S18,T1N,R2W in MESA COUNTY, CO)
National Pollutant Discharge Elimination System NON-MAJOR (Tracking pollutant discharge elimination systems) - permit Business SIC classification: SEWERAGE SYSTEMS Alternative names: INDUSTRIAL INSULATION, LLC
GASCO INC - FEDERAL 9-1 (SEC 26 T8S R97W in MESA, CO)
AIR MINOR (AIRS/AFS) Business SIC classification: CRUDE PETROLEUM AND NATURAL GAS Alternative names: GASCO INCORPORATED SHIRE GULCH GATHERING FIELD
Housing units lacking complete plumbing facilities: 6.7% Housing units lacking complete kitchen facilities: 4.0%
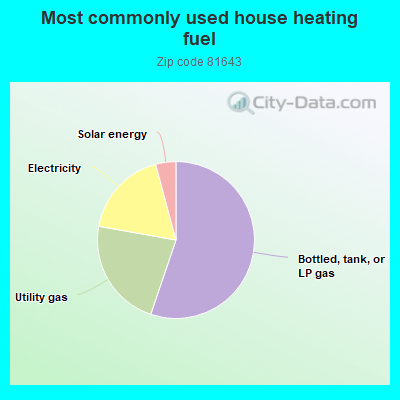
55.5%Bottled, tank, or LP gas
22.7%Utility gas
18.1%Electricity
4.2%Solar energy
Population in 1990: 741.
Place of birth for U.S.-born residents:
This state: 281
Northeast: 7
Midwest: 46
South: 11
West: 116
63% of the 81643 zip code residents lived in the same house 5 years ago. Out of people who lived in different houses, 64% lived in this county. Out of people who lived in different counties, 50% lived in Colorado.
101% of the 81643 zip code residents lived in the same house 1 year ago.
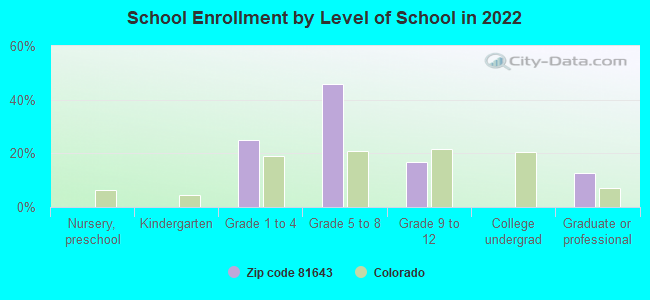
Private vs. public school enrollment:
Students in private schools in grades 1 to 8 (elementary and middle school):
Here:
0.0%
Colorado:
11.4%
Students in private schools in grades 9 to 12 (high school):
Here:
0.0%
Colorado:
8.5%
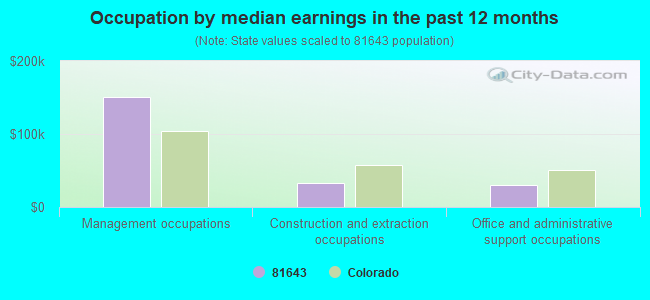
Occupation by median earnings in the past 12 months ($)
150,341Management occupations
32,722Construction and extraction occupations
30,120Office and administrative support occupations
Top industries in this zip code by the number of employees in 2005:
Accommodation and Food Services: Hotels (except Casino Hotels) and Motels (250-499 employees: 1 establishment, 5-9 employees: 1 establishment)
Accommodation and Food Services: Full-Service Restaurants (5-9: 1, 1-4: 1)
Other Services (except Public Administration): Other Similar Organizations (except Business, Professional, Labor, and Political Organizations) (5-9: 1)
Real Estate and Rental and Leasing: Nonresidential Property Managers (5-9: 1)
Construction: New Single-Family Housing Construction (except Operative Builders) (1-4: 3)
Construction: Water and Sewer Line and Related Structures Construction (1-4: 2)
Real Estate and Rental and Leasing: Construction, Mining, and Forestry Machinery and Equipment Rental and Leasing (1-4: 1)
Professional, Scientific, and Technical Services: Landscape Architectural Services (1-4: 1)
Arts, Entertainment, and Recreation: All Other Amusement and Recreation Industries (1-4: 1)
Professional, Scientific, and Technical Services: All Other Professional, Scientific, and Technical Services (1-4: 1)
People in group quarters in 2000:
6 people in unknown juvenile institutions
Fatal accident statistics in 2014:
Fatal accident count: 1
Vehicles involved in fatal accidents: 1
Fatal accidents caused by drunken drivers: 0
Fatalities: 1
Persons involved in fatal accidents: 1
Pedestrians involved in fatal accidents: 0
Home Mortgage Disclosure Act Aggregated Statistics For Year 2009 (Based on 2 partial tracts)
A) FHA, FSA/RHS & VA Home Purchase Loans
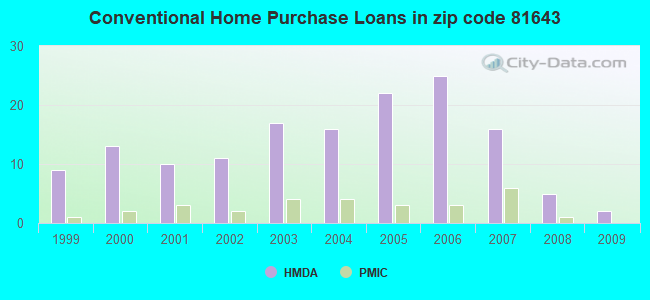
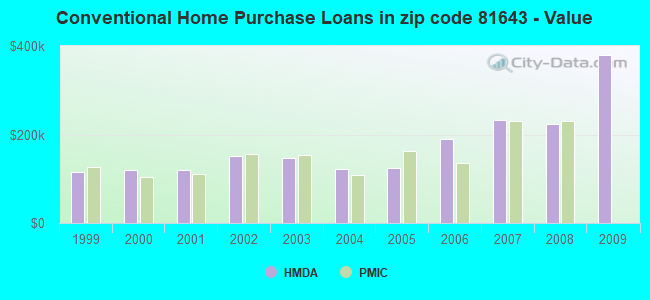
B) Conventional Home Purchase Loans
C) Refinancings
D) Home Improvement Loans
F) Non-occupant Loans on < 5 Family Dwellings (A B C & D)
G) Loans On Manufactured Home Dwelling (A B C & D)
Number
Average Value
Number
Average Value
Number
Average Value
Number
Average Value
Number
Average Value
Number
Average Value
LOANS ORIGINATED
4
$213,900
2
$378,755
37
$233,236
2
$168,685
4
$270,878
6
$168,952
APPLICATIONS APPROVED, NOT ACCEPTED
0
$0
1
$41,510
3
$215,927
0
$0
1
$126,910
0
$0
APPLICATIONS DENIED
2
$225,135
2
$187,195
15
$229,834
2
$95,050
2
$141,455
3
$159,787
APPLICATIONS WITHDRAWN
0
$0
1
$185,340
8
$231,846
1
$98,090
1
$150,440
1
$175,030
FILES CLOSED FOR INCOMPLETENESS
0
$0
0
$0
2
$187,725
0
$0
0
$0
0
$0
Aggregated Statistics For Year 2008 (Based on 2 partial tracts)
A) FHA, FSA/RHS & VA Home Purchase Loans
B) Conventional Home Purchase Loans
C) Refinancings
D) Home Improvement Loans
F) Non-occupant Loans on < 5 Family Dwellings (A B C & D)
G) Loans On Manufactured Home Dwelling (A B C & D)
Number
Average Value
Number
Average Value
Number
Average Value
Number
Average Value
Number
Average Value
Number
Average Value
LOANS ORIGINATED
7
$199,357
5
$223,682
23
$219,280
2
$112,370
6
$203,455
7
$184,664
APPLICATIONS APPROVED, NOT ACCEPTED
1
$279,210
1
$174,770
3
$196,450
1
$8,730
1
$144,100
1
$267,570
APPLICATIONS DENIED
1
$378,890
3
$128,500
13
$240,055
3
$96,417
2
$311,990
4
$102,852
APPLICATIONS WITHDRAWN
1
$131,940
3
$214,517
5
$342,556
1
$166,570
1
$42,040
1
$76,680
FILES CLOSED FOR INCOMPLETENESS
0
$0
0
$0
1
$134,840
0
$0
0
$0
0
$0
Aggregated Statistics For Year 2007 (Based on 2 partial tracts)
A) FHA, FSA/RHS & VA Home Purchase Loans
B) Conventional Home Purchase Loans
C) Refinancings
D) Home Improvement Loans
F) Non-occupant Loans on < 5 Family Dwellings (A B C & D)
G) Loans On Manufactured Home Dwelling (A B C & D)
Number
Average Value
Number
Average Value
Number
Average Value
Number
Average Value
Number
Average Value
Number
Average Value
LOANS ORIGINATED
4
$167,828
16
$232,903
24
$205,384
3
$45,300
5
$178,418
8
$160,722
APPLICATIONS APPROVED, NOT ACCEPTED
0
$0
6
$162,253
3
$255,673
0
$0
0
$0
2
$111,840
APPLICATIONS DENIED
1
$121,360
5
$182,912
15
$195,021
3
$97,917
2
$196,715
4
$133,192
APPLICATIONS WITHDRAWN
1
$209,670
2
$181,905
5
$239,970
1
$19,830
1
$53,940
1
$165,780
FILES CLOSED FOR INCOMPLETENESS
0
$0
1
$198,830
1
$154,940
0
$0
1
$66,100
0
$0
Aggregated Statistics For Year 2006 (Based on 2 partial tracts)
A) FHA, FSA/RHS & VA Home Purchase Loans
B) Conventional Home Purchase Loans
C) Refinancings
D) Home Improvement Loans
F) Non-occupant Loans on < 5 Family Dwellings (A B C & D)
G) Loans On Manufactured Home Dwelling (A B C & D)
Number
Average Value
Number
Average Value
Number
Average Value
Number
Average Value
Number
Average Value
Number
Average Value
LOANS ORIGINATED
5
$162,288
25
$189,754
23
$175,653
2
$59,885
8
$136,496
7
$154,221
APPLICATIONS APPROVED, NOT ACCEPTED
0
$0
4
$148,328
4
$198,168
1
$69,010
1
$89,630
1
$153,350
APPLICATIONS DENIED
1
$170,800
11
$242,406
15
$190,103
1
$70,860
3
$379,150
6
$152,030
APPLICATIONS WITHDRAWN
1
$149,650
4
$336,250
9
$193,218
0
$0
1
$189,570
1
$176,350
FILES CLOSED FOR INCOMPLETENESS
0
$0
0
$0
2
$131,010
0
$0
0
$0
0
$0
Aggregated Statistics For Year 2005 (Based on 2 partial tracts)
A) FHA, FSA/RHS & VA Home Purchase Loans
B) Conventional Home Purchase Loans
C) Refinancings
D) Home Improvement Loans
F) Non-occupant Loans on < 5 Family Dwellings (A B C & D)
G) Loans On Manufactured Home Dwelling (A B C & D)
Number
Average Value
Number
Average Value
Number
Average Value
Number
Average Value
Number
Average Value
Number
Average Value
LOANS ORIGINATED
4
$117,195
22
$124,400
24
$163,234
1
$43,360
8
$107,909
4
$123,805
APPLICATIONS APPROVED, NOT ACCEPTED
0
$0
3
$170,010
6
$158,683
1
$7,930
1
$144,630
0
$0
APPLICATIONS DENIED
1
$72,970
9
$171,449
16
$182,271
4
$113,098
2
$191,820
3
$92,010
APPLICATIONS WITHDRAWN
1
$117,920
5
$98,040
13
$159,596
1
$94,660
3
$116,247
1
$173,450
FILES CLOSED FOR INCOMPLETENESS
0
$0
0
$0
4
$168,752
0
$0
0
$0
0
$0
Aggregated Statistics For Year 2004 (Based on 2 partial tracts)
A) FHA, FSA/RHS & VA Home Purchase Loans
B) Conventional Home Purchase Loans
C) Refinancings
D) Home Improvement Loans
F) Non-occupant Loans on < 5 Family Dwellings (A B C & D)
G) Loans On Manufactured Home Dwelling (A B C & D)
Number
Average Value
Number
Average Value
Number
Average Value
Number
Average Value
Number
Average Value
Number
Average Value
LOANS ORIGINATED
3
$111,753
16
$121,145
24
$153,826
2
$51,160
6
$132,332
7
$111,086
APPLICATIONS APPROVED, NOT ACCEPTED
0
$0
3
$133,873
6
$153,263
0
$0
1
$62,400
1
$144,100
APPLICATIONS DENIED
2
$131,670
5
$187,406
14
$161,171
1
$120,040
2
$102,850
5
$129,132
APPLICATIONS WITHDRAWN
0
$0
2
$196,715
8
$142,082
1
$83,290
1
$228,180
0
$0
FILES CLOSED FOR INCOMPLETENESS
0
$0
0
$0
2
$196,980
0
$0
0
$0
0
$0
Aggregated Statistics For Year 2003 (Based on 2 partial tracts)
A) FHA, FSA/RHS & VA Home Purchase Loans
B) Conventional Home Purchase Loans
C) Refinancings
D) Home Improvement Loans
F) Non-occupant Loans on < 5 Family Dwellings (A B C & D)
Number
Average Value
Number
Average Value
Number
Average Value
Number
Average Value
Number
Average Value
LOANS ORIGINATED
3
$114,573
17
$146,524
52
$149,238
2
$38,735
9
$137,840
APPLICATIONS APPROVED, NOT ACCEPTED
0
$0
2
$127,175
5
$165,144
0
$0
1
$48,120
APPLICATIONS DENIED
0
$0
6
$158,155
23
$167,377
1
$64,250
2
$166,045
APPLICATIONS WITHDRAWN
0
$0
2
$111,840
13
$328,324
0
$0
1
$85,400
FILES CLOSED FOR INCOMPLETENESS
0
$0
1
$35,690
2
$184,550
0
$0
0
$0
Aggregated Statistics For Year 2002 (Based on 2 partial tracts)
A) FHA, FSA/RHS & VA Home Purchase Loans
B) Conventional Home Purchase Loans
C) Refinancings
D) Home Improvement Loans
F) Non-occupant Loans on < 5 Family Dwellings (A B C & D)
Number
Average Value
Number
Average Value
Number
Average Value
Number
Average Value
Number
Average Value
LOANS ORIGINATED
2
$113,030
11
$151,045
35
$134,217
4
$33,448
4
$136,035
APPLICATIONS APPROVED, NOT ACCEPTED
0
$0
2
$112,635
6
$136,253
0
$0
1
$43,100
APPLICATIONS DENIED
1
$38,070
4
$76,875
16
$133,142
2
$46,140
0
$0
APPLICATIONS WITHDRAWN
0
$0
2
$149,385
11
$136,094
1
$64,510
0
$0
FILES CLOSED FOR INCOMPLETENESS
0
$0
1
$53,140
2
$105,100
0
$0
1
$53,140
Aggregated Statistics For Year 2001 (Based on 2 partial tracts)
A) FHA, FSA/RHS & VA Home Purchase Loans
B) Conventional Home Purchase Loans
C) Refinancings
D) Home Improvement Loans
F) Non-occupant Loans on < 5 Family Dwellings (A B C & D)
Number
Average Value
Number
Average Value
Number
Average Value
Number
Average Value
Number
Average Value
LOANS ORIGINATED
2
$110,125
10
$118,716
32
$131,101
1
$31,990
4
$158,310
APPLICATIONS APPROVED, NOT ACCEPTED
0
$0
2
$120,830
3
$116,777
0
$0
0
$0
APPLICATIONS DENIED
0
$0
4
$98,225
16
$109,594
2
$29,215
1
$168,690
APPLICATIONS WITHDRAWN
1
$86,990
1
$147,010
10
$112,264
0
$0
0
$0
FILES CLOSED FOR INCOMPLETENESS
0
$0
0
$0
2
$125,985
0
$0
0
$0
Aggregated Statistics For Year 2000 (Based on 2 partial tracts)
A) FHA, FSA/RHS & VA Home Purchase Loans
B) Conventional Home Purchase Loans
C) Refinancings
D) Home Improvement Loans
F) Non-occupant Loans on < 5 Family Dwellings (A B C & D)
Number
Average Value
Number
Average Value
Number
Average Value
Number
Average Value
Number
Average Value
LOANS ORIGINATED
2
$98,755
13
$118,797
13
$102,242
4
$34,768
3
$75,620
APPLICATIONS APPROVED, NOT ACCEPTED
0
$0
2
$141,985
4
$95,185
2
$19,435
0
$0
APPLICATIONS DENIED
1
$39,920
4
$99,282
13
$90,526
2
$27,760
1
$50,760
APPLICATIONS WITHDRAWN
1
$25,650
1
$95,180
5
$76,358
1
$22,470
0
$0
FILES CLOSED FOR INCOMPLETENESS
0
$0
1
$76,940
2
$158,375
0
$0
0
$0
Aggregated Statistics For Year 1999 (Based on 1 partial tract)
A) FHA, FSA/RHS & VA Home Purchase Loans
B) Conventional Home Purchase Loans
C) Refinancings
D) Home Improvement Loans
F) Non-occupant Loans on < 5 Family Dwellings (A B C & D)


 Nearest zip codes: 81646, 81526, 81413, 81418, 81503, 81520.