Estimated zip code population in 2022: 37,396 Zip code population in 2010: 31,373 Zip code population in 2000: 17,231
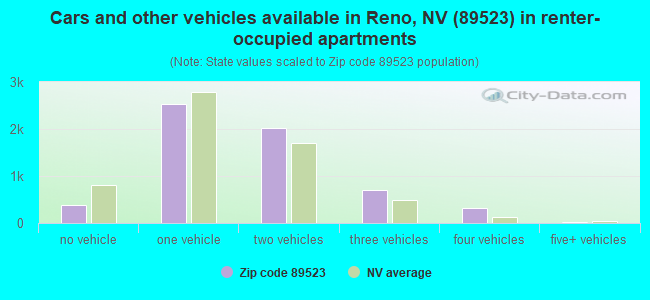
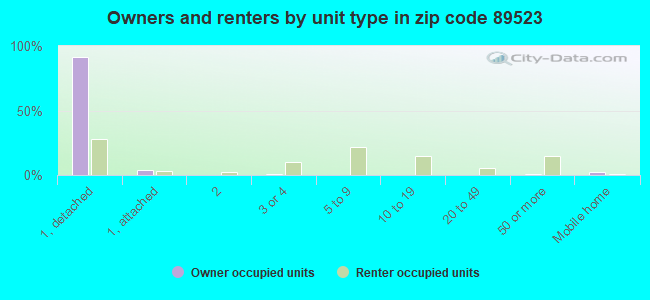
Houses and condos: 16,802 Renter-occupied apartments: 5,984
% of renters here:
37%
State:
40%
March 2022 cost of living index in zip code 89523: 98.8 (near average, U.S. average is 100)
Land area: 18.8 sq. mi. Water area: 0.1 sq. mi.
Population density: 1,985 people per square mile
(low).
OSM Map
General Map
Google Map
MSN Map
OSM Map
General Map
Google Map
MSN Map
OSM Map
General Map
Google Map
MSN Map
OSM Map
General Map
Google Map
MSN Map
Please wait while loading the map...
Real estate property taxes paid for housing units in 2022:
This zip code:
0.5% ($2,798)
Nevada:
0.4% ($1,889)
Median real estate property taxes paid for housing units with mortgages in 2022: $2,817 (0.5%) Median real estate property taxes paid for housing units with no mortgage in 2022: $2,766 (0.5%)
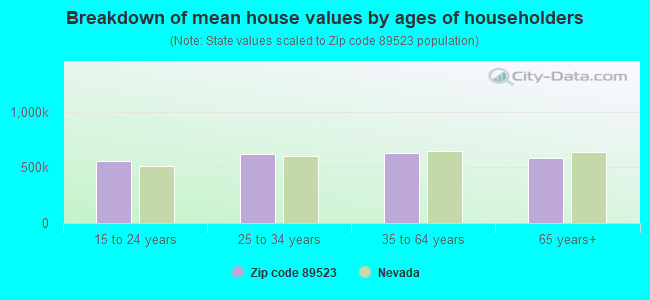
Estimated median house/condo value in 2022: $595,416
89523:
$595,416
Nevada:
$434,700
According to our research of Nevada and other state lists, there were 39 registered sex offenders living in 89523 zip code as of June 17, 2024. The ratio of all residents to sex offenders in zip code 89523 is 890 to 1. The ratio of registered sex offenders to all residents in this zip code is much lower than the state average.
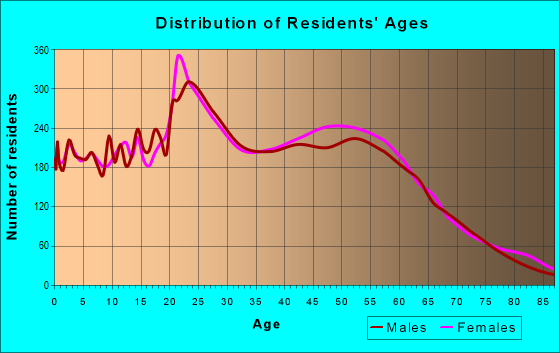
Median resident age:
This zip code:
41.1 years
Nevada median age:
39.0 years
Average household size:
This zip code:
2.3 people
Nevada:
2.6 people
Averages for the 2020 tax year for zip code 89523, filed in 2021:
Average Adjusted Gross Income (AGI) in 2020: $105,071 (Individual Income Tax Returns)
Here:
$105,071
State:
$78,964
Salary/wage: $71,522 (reported on 80.7% of returns)
Here:
$71,522
State:
$54,472
(% of AGI for various income ranges: 1245.6% for AGIs below $25k, 3652.4% for AGIs $25k-50k, 6254.9% for AGIs $50k-75k, 9162.4% for AGIs $75k-100k, 17591.7% for AGIs $100k-200k, 76154.0% for AGIs over 200k)
Taxable interest for individuals: $2,847 (reported on 32.4% of returns)
This zip code:
$2,847
Nevada:
$3,521
(% of AGI for various income ranges: 21.5% for AGIs below $25k, 22.6% for AGIs $25k-50k, 54.2% for AGIs $50k-75k, 106.4% for AGIs $75k-100k, 163.1% for AGIs $100k-200k, 2207.0% for AGIs over 200k)
Ordinary dividends: $7,811 (reported on 25.2% of returns)
Here:
$7,811
State:
$13,390
(% of AGI for various income ranges: 41.0% for AGIs below $25k, 55.0% for AGIs $25k-50k, 112.2% for AGIs $50k-75k, 211.9% for AGIs $75k-100k, 459.2% for AGIs $100k-200k, 4328.9% for AGIs over 200k)
Net capital gain/loss in AGI: +$63,502 (reported on 25.0% of returns)
Here:
+$63,502
State:
+$63,025
(% of AGI for various income ranges: 16.6% for AGIs below $25k, 49.1% for AGIs $25k-50k, 114.0% for AGIs $50k-75k, 303.4% for AGIs $75k-100k, 875.7% for AGIs $100k-200k, 58077.0% for AGIs over 200k)
Profit/loss from business: +$22,065 (reported on 14.6% of returns)
Here:
+$22,065
State:
+$11,500
(% of AGI for various income ranges: 94.0% for AGIs below $25k, 130.5% for AGIs $25k-50k, 242.9% for AGIs $50k-75k, 357.0% for AGIs $75k-100k, 910.6% for AGIs $100k-200k, 5672.6% for AGIs over 200k)
Taxable individual retirement arrangement distribution: $27,779 (reported on 10.6% of returns)
89523:
$27,779
Nevada:
$23,628
(% of AGI for various income ranges: 61.6% for AGIs below $25k, 110.1% for AGIs $25k-50k, 256.1% for AGIs $50k-75k, 503.1% for AGIs $75k-100k, 1102.7% for AGIs $100k-200k, 3845.3% for AGIs over 200k)
Self-employed (Keogh) retirement plans: $24,333 (reported on 1.0% of returns)
89523:
$24,333
Nevada:
$26,634
(% of AGI for various income ranges: 13.4% for AGIs $50k-75k, 60.7% for AGIs $100k-200k, 638.1% for AGIs over 200k)
Total itemized deductions: $38,245 (reported on 10.8% of returns)
Here:
$38,245
State:
$44,173
(% of AGI for various income ranges: 76.0% for AGIs below $25k, 115.7% for AGIs $25k-50k, 307.1% for AGIs $50k-75k, 566.4% for AGIs $75k-100k, 1107.9% for AGIs $100k-200k, 7972.8% for AGIs over 200k)
Charity contributions: $13,394 (reported on 8.5% of returns)
Here:
$13,394
State:
$12,589
(% of AGI for various income ranges: 4.0% for AGIs below $25k, 10.1% for AGIs $25k-50k, 33.2% for AGIs $50k-75k, 71.0% for AGIs $75k-100k, 190.4% for AGIs $100k-200k, 3333.8% for AGIs over 200k)
Taxes paid: $6,562 (reported on 10.7% of returns)
89523:
$6,562
State:
$6,112
(% of AGI for various income ranges: 10.4% for AGIs below $25k, 17.2% for AGIs $25k-50k, 52.3% for AGIs $50k-75k, 111.7% for AGIs $75k-100k, 241.5% for AGIs $100k-200k, 1140.9% for AGIs over 200k)
Earned income credit: $1,933 (reported on 8.9% of returns)
Here:
$1,933
State:
$2,214
(% of AGI for various income ranges: 54.0% for AGIs below $25k, 42.9% for AGIs $25k-50k, 0.6% for AGIs $50k-75k)
Percentage of individuals using paid preparers for their 2020 taxes: 93.8%
Here:
94%
State:
93%
(% for various income ranges: 93.4% for AGIs below $25k, 94.3% for AGIs $25k-50k, 94.4% for AGIs $50k-75k, 93.4% for AGIs $75k-100k, 93.4% for AGIs $100k-200k, 94.3% for AGIs over 200k)
Averages for the 2012 tax year for zip code 89523, filed in 2013:
Average Adjusted Gross Income (AGI) in 2012: $66,799 (Individual Income Tax Returns)
Here:
$66,799
State:
$61,164
Salary/wage: $54,637 (reported on 83.8% of returns)
Here:
$54,637
State:
$45,924
(% of AGI for various income ranges: 77.3% for AGIs below $25k, 79.8% for AGIs $25k-50k, 75.7% for AGIs $50k-75k, 74.7% for AGIs $75k-100k, 72.9% for AGIs $100k-200k, 48.7% for AGIs over 200k)
Taxable interest for individuals: $1,778 (reported on 33.4% of returns)
This zip code:
$1,778
Nevada:
$3,137
(% of AGI for various income ranges: 1.3% for AGIs below $25k, 0.6% for AGIs $25k-50k, 0.7% for AGIs $50k-75k, 0.6% for AGIs $75k-100k, 0.8% for AGIs $100k-200k, 1.3% for AGIs over 200k)
Ordinary dividends: $5,929 (reported on 21.8% of returns)
Here:
$5,929
State:
$11,762
(% of AGI for various income ranges: 3.1% for AGIs below $25k, 1.3% for AGIs $25k-50k, 1.3% for AGIs $50k-75k, 1.2% for AGIs $75k-100k, 1.5% for AGIs $100k-200k, 3.2% for AGIs over 200k)
Net capital gain/loss in AGI: +$12,992 (reported on 18.6% of returns)
Here:
+$12,992
State:
+$33,127
(% of AGI for various income ranges: 0.4% for AGIs $50k-75k, 0.7% for AGIs $75k-100k, 1.1% for AGIs $100k-200k, 12.3% for AGIs over 200k)
Profit/loss from business: +$19,780 (reported on 13.8% of returns)
Here:
+$19,780
State:
+$12,567
(% of AGI for various income ranges: 5.7% for AGIs below $25k, 3.6% for AGIs $25k-50k, 2.0% for AGIs $50k-75k, 2.6% for AGIs $75k-100k, 4.4% for AGIs $100k-200k, 5.5% for AGIs over 200k)
Taxable individual retirement arrangement distribution: $23,466 (reported on 9.8% of returns)
89523:
$23,466
Nevada:
$20,808
(% of AGI for various income ranges: 2.6% for AGIs below $25k, 2.3% for AGIs $25k-50k, 2.7% for AGIs $50k-75k, 3.4% for AGIs $75k-100k, 3.2% for AGIs $100k-200k, 4.9% for AGIs over 200k)
Self-employment retirement plans: $22,162 (reported on 0.8% of returns)
89523:
$22,162
Nevada:
$22,197
(% of AGI for various income ranges: 0.6% for AGIs $25k-50k, 0.3% for AGIs $100k-200k, 0.5% for AGIs over 200k)
Total itemized deductions: $24,201 (20% of AGI, reported on 33.3% of returns)
Here:
$24,201
State:
$26,148
Here:
19.9% of AGI
State:
20.0% of AGI
(% of AGI for various income ranges: 9.3% for AGIs below $25k, 9.6% for AGIs $25k-50k, 11.8% for AGIs $50k-75k, 13.3% for AGIs $75k-100k, 13.6% for AGIs $100k-200k, 11.8% for AGIs over 200k)
Charity contributions: $3,311 (reported on 27.0% of returns)
Here:
$3,311
State:
$4,329
(% of AGI for various income ranges: 0.5% for AGIs below $25k, 0.8% for AGIs $25k-50k, 1.0% for AGIs $50k-75k, 1.3% for AGIs $75k-100k, 1.6% for AGIs $100k-200k, 1.8% for AGIs over 200k)
Taxes paid: $5,548 (reported on 33.0% of returns)
89523:
$5,548
State:
$5,116
(% of AGI for various income ranges: 1.6% for AGIs below $25k, 1.7% for AGIs $25k-50k, 2.4% for AGIs $50k-75k, 3.0% for AGIs $75k-100k, 3.4% for AGIs $100k-200k, 2.9% for AGIs over 200k)
Earned income credit: $1,895 (reported on 11.8% of returns)
Here:
$1,895
State:
$2,279
(% of AGI for various income ranges: 3.7% for AGIs below $25k, 0.8% for AGIs $25k-50k)
Percentage of individuals using paid preparers for their 2012 taxes: 45.4%
Here:
45%
State:
55%
(% for various income ranges: 38.3% for AGIs below $25k, 42.9% for AGIs $25k-50k, 47.0% for AGIs $50k-75k, 49.7% for AGIs $75k-100k, 55.3% for AGIs $100k-200k, 70.7% for AGIs over 200k)
Averages for the 2004 tax year for zip code 89523, filed in 2005:
Average Adjusted Gross Income (AGI) in 2004: $55,666 (Individual Income Tax Returns)
Here:
$55,666
State:
$58,367
Salary/wage: $48,250 (reported on 88.4% of returns)
Here:
$48,250
State:
$42,695
(% of AGI for various income ranges: 167.5% for AGIs below $10k, 84.2% for AGIs $10k-25k, 84.5% for AGIs $25k-50k, 83.0% for AGIs $50k-75k, 83.2% for AGIs $75k-100k, 65.9% for AGIs over 100k)
Taxable interest for individuals: $1,752 (reported on 41.7% of returns)
This zip code:
$1,752
Nevada:
$3,867
(% of AGI for various income ranges: 6.9% for AGIs below $10k, 1.9% for AGIs $10k-25k, 1.2% for AGIs $25k-50k, 1.2% for AGIs $50k-75k, 0.9% for AGIs $75k-100k, 1.4% for AGIs over 100k)
Taxable dividends: $2,923 (reported on 24.7% of returns)
Here:
$2,923
State:
$5,770
(% of AGI for various income ranges: 4.7% for AGIs below $10k, 1.3% for AGIs $10k-25k, 0.8% for AGIs $25k-50k, 0.9% for AGIs $50k-75k, 0.8% for AGIs $75k-100k, 1.8% for AGIs over 100k)
Net capital gain/loss: +$12,612 (reported on 21.4% of returns)
Here:
+$12,612
State:
+$50,644
(% of AGI for various income ranges: -4.0% for AGIs below $10k, 0.1% for AGIs $10k-25k, 0.4% for AGIs $25k-50k, 0.6% for AGIs $50k-75k, 1.4% for AGIs $75k-100k, 10.4% for AGIs over 100k)
Profit/loss from business: +$19,154 (reported on 14.6% of returns)
Here:
+$19,154
State:
+$13,618
(% of AGI for various income ranges: 7.3% for AGIs below $10k, 4.4% for AGIs $10k-25k, 3.5% for AGIs $25k-50k, 3.9% for AGIs $50k-75k, 4.0% for AGIs $75k-100k, 6.5% for AGIs over 100k)
IRA payment deduction: $2,855 (reported on 3.4% of returns)
89523:
$2,855
Nevada:
$3,054
(% of AGI for various income ranges: 0.2% for AGIs $10k-25k, 0.3% for AGIs $25k-50k, 0.2% for AGIs $50k-75k, 0.2% for AGIs $75k-100k, 0.1% for AGIs over 100k)
Self-employed pension: $13,939 (reported on 1.1% of returns)
Here:
$13,939
Nevada:
$16,706
(% of AGI for various income ranges: 0.2% for AGIs $50k-75k, 0.2% for AGIs $75k-100k, 0.5% for AGIs over 100k)
Total itemized deductions: $19,534 (22% of AGI, reported on 42.8% of returns)
Here:
$19,534
State:
$22,990
Here:
22.0% of AGI
State:
21.8% of AGI
(% of AGI for various income ranges: 21.4% for AGIs below $10k, 10.5% for AGIs $10k-25k, 14.5% for AGIs $25k-50k, 17.7% for AGIs $50k-75k, 18.0% for AGIs $75k-100k, 13.4% for AGIs over 100k)
Charity contributions deductions: $2,199 (2% of AGI, reported on 36.8% of returns)
Here:
$2,199
State:
$3,443
Here:
2.4% of AGI
State:
3.1% of AGI
(% of AGI for various income ranges: 0.8% for AGIs below $10k, 0.7% for AGIs $10k-25k, 1.1% for AGIs $25k-50k, 1.5% for AGIs $50k-75k, 1.7% for AGIs $75k-100k, 1.6% for AGIs over 100k)
Total tax: $8,472 (reported on 82.0% of returns)
89523:
$8,472
State:
$10,585
(% of AGI for various income ranges: 4.6% for AGIs below $10k, 4.8% for AGIs $10k-25k, 7.5% for AGIs $25k-50k, 9.2% for AGIs $50k-75k, 10.4% for AGIs $75k-100k, 17.7% for AGIs over 100k)
Earned income credit: $1,457 (reported on 8.2% of returns)
Here:
$1,457
State:
$1,676
Percentage of individuals using paid preparers for their 2004 taxes: 51.7%
Here:
52%
State:
60%
(% for various income ranges: 41.7% for AGIs below $10k, 47.5% for AGIs $10k-25k, 52.6% for AGIs $25k-50k, 55.3% for AGIs $50k-75k, 53.2% for AGIs $75k-100k, 62.1% for AGIs over 100k)
Likely homosexual households (counted as self-reported same-sex unmarried-partner households)
Lesbian couples: 0.2% of all households
Gay men: 0.4% of all households
Household received Food Stamps/SNAP in the past 12 months: 1,089 Household did not receive Food Stamps/SNAP in the past 12 months: 14,860
Women who had a birth in the past 12 months: 216 (200 now married, 31 unmarried) Women who did not have a birth in the past 12 months: 8,784 (3,709 now married, 5,068 unmarried)
Housing units in zip code 89523 with a mortgage: 6,590 (450 second mortgage, 7 home equity loan, 446 both second mortgage and home equity loan) Houses without a mortgage: 59
Median monthly owner costs for units with a mortgage: $2,120 Median monthly owner costs for units without a mortgage: $552
Residents with income below the poverty level in 2022:
This zip code:
7.0%
Whole state:
12.5%
Residents with income below 50% of the poverty level in 2022:
This zip code:
3.4%
Whole state:
5.9%
Median number of rooms in houses and condos:
Here:
6.2
State:
6.0
Median number of rooms in apartments:
Here:
4.3
State:
4.2
Notable locations in this zip code not listed on our city pages
Notable locations in zip code 89523: Ambrose Park (A), Nevada Patrol Weighing Station (B), Verdi Fire Station (C), Sierra Fire Protection District Station 35 (D), Reno Fire Department Station 11 (E), Reno Fire Department Station 19 (F). Display/hide their locations on the map
Tourist attraction (not listed on the city page) : Secondhand Prose Bookstore (Cultural Attractions- Events- & Facilities; 2325 Robb Drive) (1). Display/hide its approximate location on the map
4,772 married couples with children.
1,793 single-parent households (752 men, 1,041 women).
80.5% of residents of 89523 zip code speak English at home.
8.3% of residents speak Spanish at home (76% very well, 10% well, 8% not well, 5% not at all).
4.3% of residents speak other Indo-European language at home (86% very well, 13% well, 1% not at all).
5.1% of residents speak Asian or Pacific Island language at home (74% very well, 14% well, 10% not well, 3% not at all).
1.5% of residents speak other language at home (86% very well, 9% well, 6% not well).
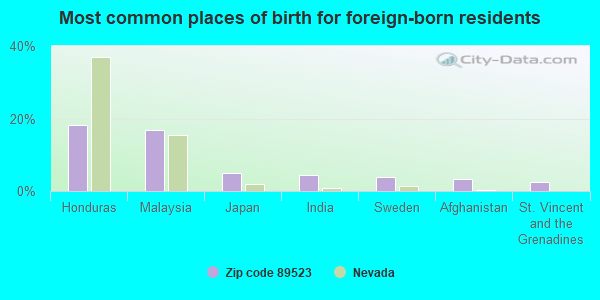
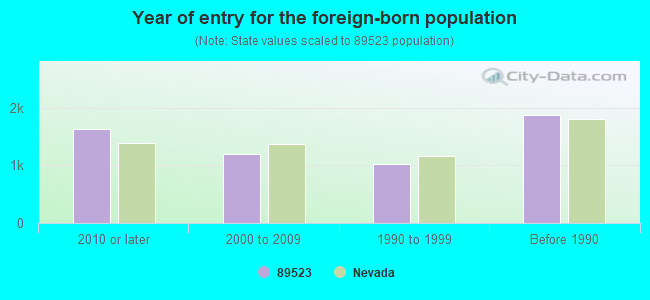
Foreign born population: 4,847 (13.0%) (60.0% of them are naturalized citizens)
Major facilities with environmental interests located in this zip code:
MCQUEEN HS (6055 LANCER in RENO, NV)
(National Center for Education Statistics) - STATE ID-16-508 Conditionally Exempt Small Quantity Generators, less than 100 kg/month of hazardous waste (Resource Conservation and Recovery Act (tracking hazardous waste)) Organizations: MCQUEEN HIGH SCHOOL (CONTACT/OPERATOR)
, WASHOE CO SCHOOL DIST (CONTACT/OWNER)
, WASHOE COUNTY SCHOOL DISTRICT (CONTACT/OWNER)
, WASHOE CO SCH DIST (SCHOOL DISTRICT)
Alternative names: MCQUEEN HIGH SCHOOL
TRUCKEE MEADOWS WTR AUTH CHALK BLUFF WTF (9605 S MCCARRAN BLVD in RENO, NV)
COMPLIANCE ACTIVITY (Tracking inspections of insecticide, fungicide, and rodenticide, and toxic substances) National Pollutant Discharge Elimination System NON-MAJOR (Tracking pollutant discharge elimination systems) - permit Conditionally Exempt Small Quantity Generators, less than 100 kg/month of hazardous waste (Resource Conservation and Recovery Act (tracking hazardous waste)) Business SIC classification: ELECTRIC SERVICES Organizations: TMWA (CONTACT/OPERATOR)
, SIERRA PACIFIC POWER COMPANY (CONTACT/OWNER)
Alternative names: SIERRA PACIFIC POWER COMPANY
BILLINGHURST MIDSCH (6685 CHESTERFIELD LANE in RENO, NV)
(National Center for Education Statistics) - STATE ID-16-310 Organizations: WASHOE CO SCH DIST (SCHOOL DISTRICT)
MELTON, ROLLAND ELEM (6557 ARCHIMEDES DRIVE in RENO, NV)
(National Center for Education Statistics) - STATE ID-16-210 Organizations: WASHOE CO SCH DIST (SCHOOL DISTRICT)
EXPRESS STOP PHOTO SAFEWAY 1210 (5150 MAE ANNE DR in RENO, NV)
(Resource Conservation and Recovery Act (tracking hazardous waste))
HOME DEPOT USA INC HD3311 (5125 SUMMIT RIDGE CT in RENO, NV)
Small Quantity Generators, between 100 kg and 1000 kg of hazardous waste/month (Resource Conservation and Recovery Act (tracking hazardous waste)) Organizations: HOME DEPOT 3311 (CONTACT/OPERATOR)
Alternative names: HOME DEPOT 3311
NEVATECH INDUSTRIES INC (127 WOODLAND AVE in RENO, NV)
(Resource Conservation and Recovery Act (tracking hazardous waste))
SAV ON DRUG STORE 2046 (10550 NORTH MCCARREN in RENO, NV)
(Resource Conservation and Recovery Act (tracking hazardous waste)) Organizations: AMERICAN DRUG STORES (CONTACT/OWNER)
Alternative names: SAV ON DRUG STORE NO 2046
ALBERTSONS 173 (10500 N MCCARRAN in RENO, NV)
Small Quantity Generators, between 100 kg and 1000 kg of hazardous waste/month (Resource Conservation and Recovery Act (tracking hazardous waste)) - notification Alternative names: ALBERTSONS NO 173
CARRIER CORP (121 WOODLAND AVE in RENO, NV)
(Resource Conservation and Recovery Act (tracking hazardous waste))
Housing units lacking complete plumbing facilities: 0.6% Housing units lacking complete kitchen facilities: 1.4%
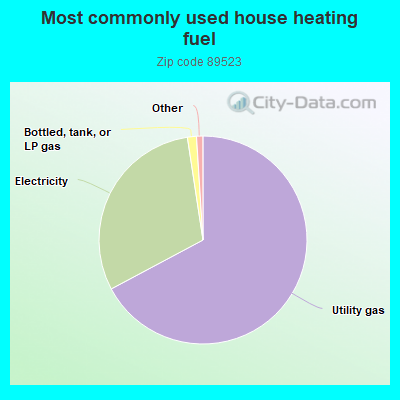
67.2%Utility gas
30.4%Electricity
1.4%Bottled, tank, or LP gas
Population in 1990: 7,697. Population change in the 1990s: +9,534 (+123.9%).
Place of birth for U.S.-born residents:
This state: 10,771
Northeast: 1,739
Midwest: 3,158
South: 2,377
West: 13,698
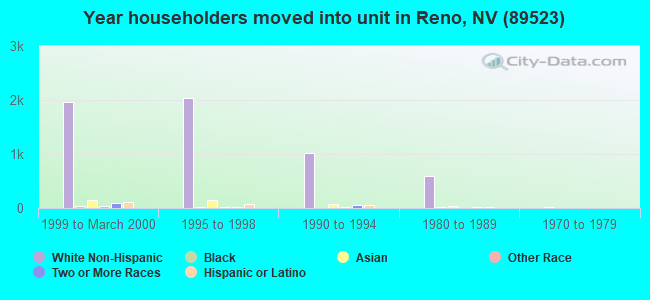
37% of the 89523 zip code residents lived in the same house 5 years ago. Out of people who lived in different houses, 50% lived in this county. Out of people who lived in different counties, 50% lived in Nevada.
88% of the 89523 zip code residents lived in the same house 1 year ago. Out of people who lived in different houses, 56% moved from this county. Out of people who lived in different houses, 2% moved from different county within same state. Out of people who lived in different houses, 42% moved from different state. Out of people who lived in different houses, 2% moved from abroad.
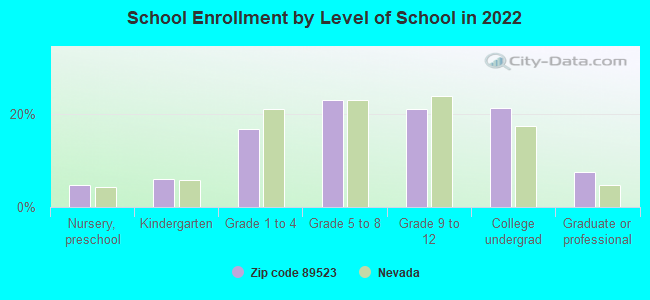
Private vs. public school enrollment:
Students in private schools in grades 1 to 8 (elementary and middle school): 455
Here:
13.4%
Nevada:
12.9%
Students in private schools in grades 9 to 12 (high school): 45
Here:
2.6%
Nevada:
6.9%
Students in private undergraduate colleges: 99
Here:
5.5%
Nevada:
16.0%
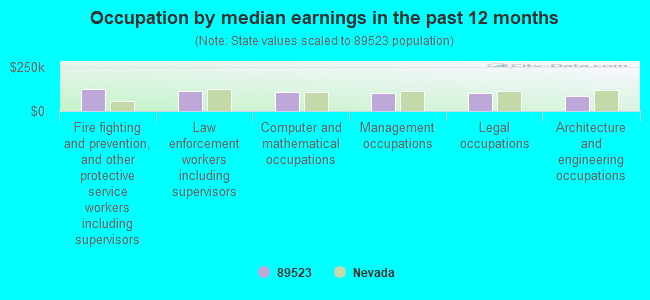
Occupation by median earnings in the past 12 months ($)
123,483Fire fighting and prevention, and other protective service workers including supervisors
112,359Law enforcement workers including supervisors
109,110Computer and mathematical occupations
104,885Management occupations
102,863Legal occupations
88,160Architecture and engineering occupations
Companies with federal contracts located in this zip code:
INFRARED SYSTEMS, INC (6788 ALICANTE COURT, SUITE in RENO, NV; small business) : $311,825 in 5 contractsfrom 2002 to 2004
Contracts for Electrical and Electronic Properties Measuring and Testing Instruments, Night Vision Equipment, Emitted and Reflected Radiation, Photographic Projection Equipment, Photographic Equipment and Accessories, and moreby Navy, Army, ENERGY, Department of, Air Force, and others Signed by year:2000: $0; 2001: $0; 2002: $80,000; 2003: $181,875; 2004: $49,950; 2005: $0; 2006: $0.
Biggest contracts:
$89,700 with Navy for Electrical and Electronic Properties Measuring and Testing Instruments. Signed on 2003-09-30. Completion date: 2003-10-31.
$80,000 with Army for Night Vision Equipment, Emitted and Reflected Radiation. Taking place in OH. Signed on 2002-09-23. Completion date: 2002-10-23.
$52,500 with ENERGY, Department of for Photographic Projection Equipment. Taking place in CO. Signed on 2003-06-05. Effective on 2003-05-05. Completion date: 2003-07-07.
$49,950 with Air Force for Photographic Equipment and Accessories. Signed on 2004-08-10. Completion date: 2004-06-09.
CARRIER CORPORATION (121 WOODLAND AVE STE 180 in RENO, NV) : $87,987 in 3 contractsfrom 2001 to 2005
$63,319 with Navy for Other Utilities. Taking place in CA. Signed on 2001-09-27. Completion date: 2001-12-30.
$18,240 with Navy for Maintenance, Repair or Alteration of Real Property -- Family Housing Facilities. Taking place in CA. Signed on 2002-06-14. Completion date: 2003-06-18.
$6,428 with Bureau of Prisoners/Federal Prison System for Equipment and Materials Testing -- Plumbing, Heating, and Waste Disposal Equipment. Taking place in CA. Signed on 2005-06-02. Completion date: 2005-06-30.
GREEN GATE SOLUTIONS, LLC (2924 SHADY CREEK CT in RENO, NV; small business)
$75,000 with Navy for Defense Electronics and Communication Equipment -- Advanced Development (R&D). Signed on 2003-06-19. Completion date: 2003-12-01.
Top industries in this zip code by the number of employees in 2005:
2003 - 2018 National Fire Incident Reporting System (NFIRS) incidents
Based on the data from the years 2003 - 2018 the average number of fire incidents per year is 34. The highest number of reported fires - 56 took place in 2006, and the least - 18 in 2003. The data has an increasing trend.
When looking into fire subcategories, the most incidents belonged to: Outside Fires (40.6%), and Structure Fires (35.6%).
Fire incident types reported to NFIRS in Zip Code 89523


 Nearest zip codes: 89519, 89503, 89439, 89509, 89501, 89512.
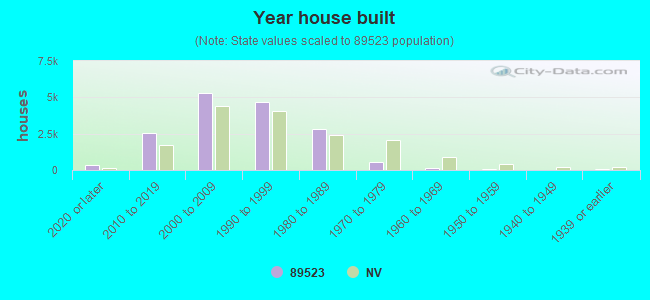


 Based on the data from the years 2003 - 2018 the average number of fire incidents per year is 34. The highest number of reported fires - 56 took place in 2006, and the least - 18 in 2003. The data has an increasing trend.
 When looking into fire subcategories, the most incidents belonged to: Outside Fires (40.6%), and Structure Fires (35.6%).